. 2025 Feb;27(2):283-297.
doi: 10.1038/s41556-024-01572-y. Epub 2025 Jan 7.

Phase separation of initiation hubs on cargo is a trigger switch for selective autophagy

Affiliations

Phase separation of initiation hubs on cargo is a trigger switch for selective autophagy

Mariya Licheva et al. Nat Cell Biol. 2025 Feb.

Abstract

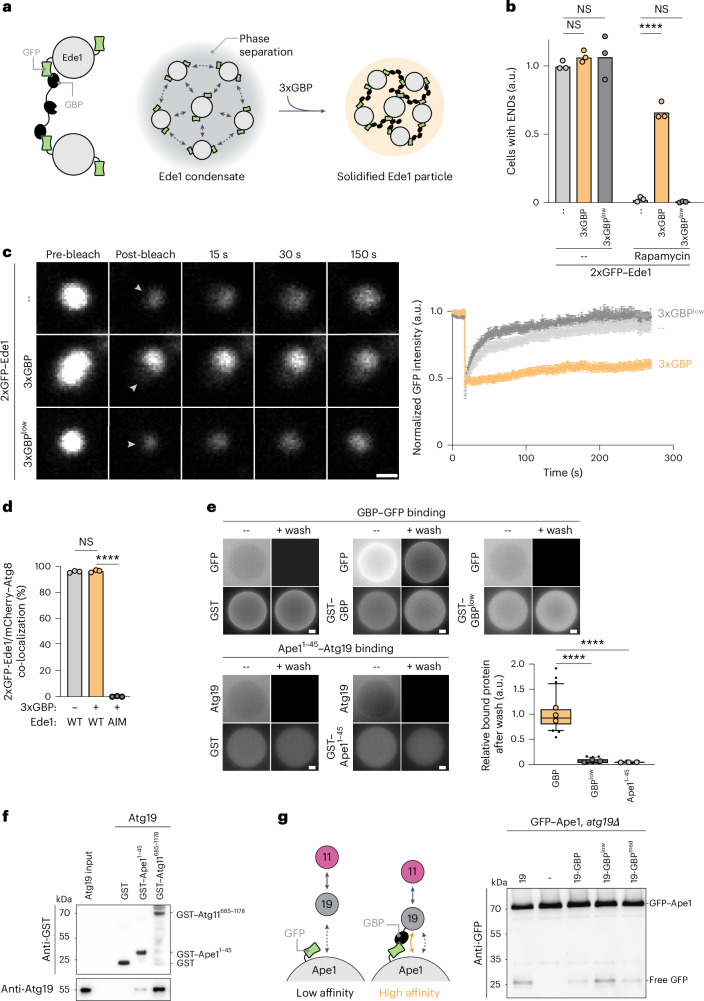
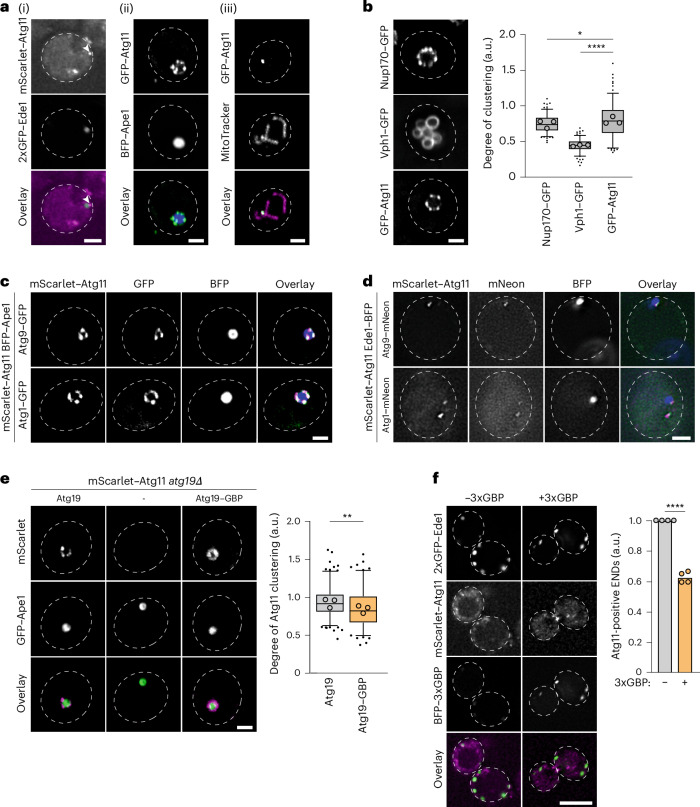
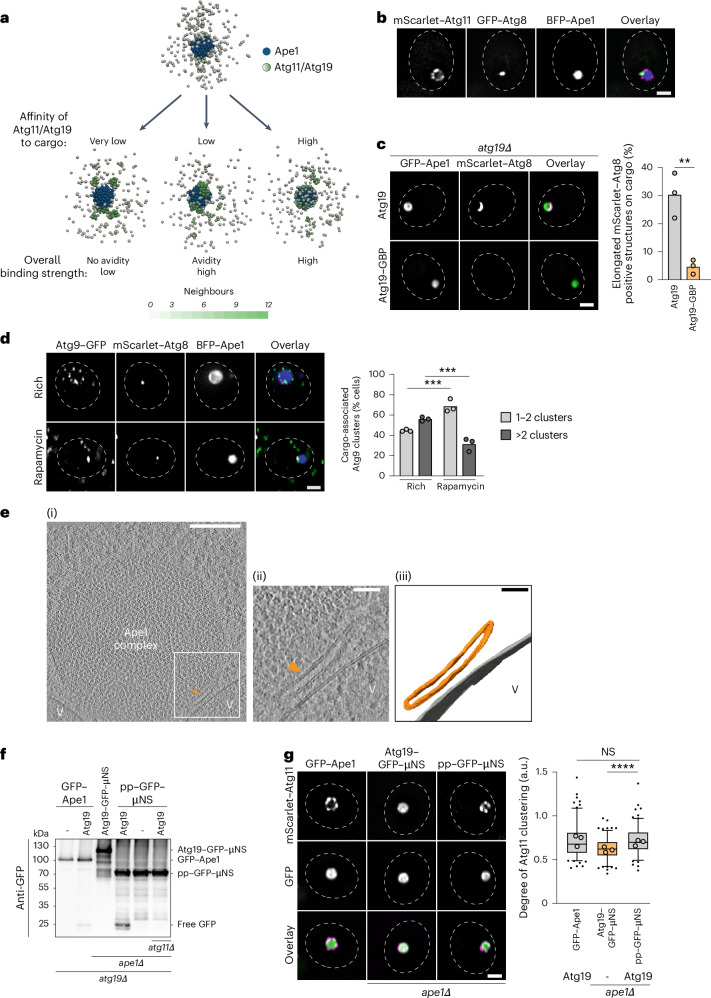
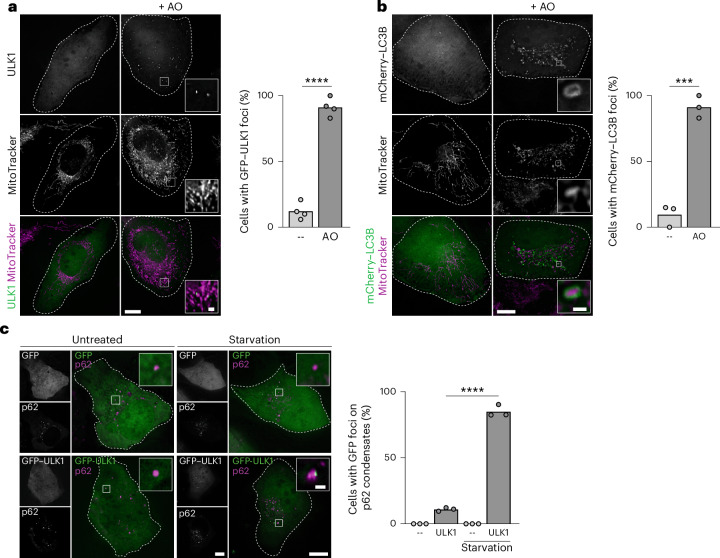
Autophagy is a key cellular quality control mechanism. Nutrient stress triggers bulk autophagy, which nonselectively degrades cytoplasmic material upon formation and liquid-liquid phase separation of the autophagy-related gene 1 (Atg1) complex. In contrast, selective autophagy eliminates protein aggregates, damaged organelles and other cargoes that are targeted by an autophagy receptor. Phase separation of cargo has been observed, but its regulation and impact on selective autophagy are poorly understood. Here, we find that key autophagy biogenesis factors phase separate into initiation hubs at cargo surfaces in yeast, subsequently maturing into sites that drive phagophore nucleation. This phase separation is dependent on multivalent, low-affinity interactions between autophagy receptors and cargo, creating a dynamic cargo surface. Notably, high-affinity interactions between autophagy receptors and cargo complexes block initiation hub formation and autophagy progression. Using these principles, we converted the mammalian reovirus nonstructural protein µNS, which accumulates as particles in the yeast cytoplasm that are not degraded, into a neo-cargo that is degraded by selective autophagy. We show that initiation hubs also form on the surface of different cargoes in human cells and are key to establish the connection to the endoplasmic reticulum, where the phagophore assembly site is formed to initiate phagophore biogenesis. Overall, our findings suggest that regulated phase separation underscores the initiation of both bulk and selective autophagy in evolutionarily diverse organisms.


Conflict of interest statement

Competing interests: The authors declare no competing interests.

Figures

Fig. 1
Fig. 1. High-affinity receptor–cargo interactions impair selective autophagy.
a, Schematic of END condensate solidification. Dashed grey arrows show low-affinity interactions. b, Cells expressing 2×GFP–Ede1 without (light grey) or with (orange) BFP–3×GBP or with BFP–3×GBPlow (dark grey) under the control of a copper-inducible promoter were grown to mid-log phase in the presence of 1 mM CuSO4 for 6 h. Autophagy was then induced by rapamycin addition. Quantification: cells with END condensates. Data are mean values (n > 150 cells per condition and replicate, three biological replicates). Circles show mean values of each replicate, bars show mean. Statistical analysis was carried out by two-tailed unpaired t-test. P values are as follows. Untreated: −3×GBP (--) versus +3×GBP, P = 0.0978; −3×GBP (--) versus +3×GBPlow, P = 0.5104; rapamycin: −3×GBP (--) versus +3×GBP, ****P < 0.0001; −3×GBP (--) versus +3×GBPlow, P = 0.1363. c, The −3×GBP (–), the +3×GBP and the +3×GBPlow strains were grown to mid-log phase as described in b. 2×GFP–Ede1 assemblies were photobleached and recovery of the signal was monitored. White arrowheads indicate the photobleached area. Scale bar, 1 µm. Quantification: recovery of the GFP signal. Data are mean values ± s.e.m. (n > 26 ENDs per condition across replicates, three biological replicates). d, A 2×GFP–Ede1 strain without (−) and with (+) 3×GBP and a 2×GFP–Ede1AIM (Atg8 binding mutant) strain with +3×GBP coexpressing mCherry–Atg8 were grown to mid-log phase in the presence of 1 mM CuSO4. GFP/mCherry-positive structures were quantified. Data are mean values (n > 100 ENDs per condition and replicate, three biological replicates). Circles show mean values of each replicate, bars show mean. Statistical analysis was conducted by a two-tailed unpaired t-test. P values are WT(−) versus WT(+), P = 0.525; WT(+) versus AIM(+) ****P < 0.0001. AIM, Atg8 binding mutant. e, GST–BFP, GST–BFP–GBP, GST–BFP–GBPlow and GST–BFP–Ape11–45 were expressed in Escherichiacoli and bound to GSH beads. Protein-bound beads were incubated with E.coli cell lysates containing 6×His–GFP or mCherry–Atg19, and bound GFP or mCherry–Atg19 was analysed before and after washing. Scale bar, 20 µm. Quantification: ratio of bead-bound protein to soluble protein in a box plot. Horizontal lines show the median, box shows the 25th to 75th percentiles, whiskers indicate the 5th and 95th percentiles, circles show mean value of each replicate, outliers show black dots (n > 25 beads per condition across replicates, three technical replicates). Statistical analysis was carried out by a one-way analysis of variance (ANOVA) followed by Dunnett’s post hoc test. P values: GBP versus GBPlow, ****P < 0.0001; GBP versus Ape11–45, ****P < 0.0001. f, GST, GST–Ape11–45 and GST–Atg11685-1178 were expressed in E.coli and bound to GSH beads, incubated with purified recombinant Atg193D and analysed by immunoblotting. One experiment out of three technical replicates is shown. g, atg19∆ cells expressing GFP–Ape1 and Atg19, an empty control vector (−), Atg19–GBP, Atg19–GBPlow or Atg19–GBPmed were grown to mid-log phase. Cell extracts were analysed by immunoblotting. One out of three biological replicates is shown. Source numerical data and unprocessed blots are available in Source data. Source data
Fig. 2
Fig. 2. Receptor mobility enables the formation of initiation hubs.
a, (i) atg19∆ cells expressing 2×GFP–Ede1 and mScarlet–Atg11 were grown to mid-log phase. (ii) GFP–Atg11 cells expressing endogenous BFP–Ape1 and copper-inducible untagged Ape1 were grown to mid-log phase in the presence of 50 μM CuSO4. (iii) atg19∆ cells expressing GFP–Atg11 were grown to mid-log phase. Mitochondria were stained with MitoTracker Red and mitophagy was induced by starvation. Images of one out of three biological replicates are shown. Scale bar, 2 μm. b, Nup170–GFP, Vph1–GFP vac8∆ atg19∆ and GFP–Atg11-expressing cells (as in a(ii)) were grown to mid-log phase. Scale bar, 2 µm. Quantification: GFP clustering as the coefficient of variance (s.d./mean GFP intensity) in a box plot. Horizontal lines show the median, box shows the 25th to 75th percentiles, whiskers show the 5th and 95th percentiles, circles show the mean value of each replicate, outliers are indicated by black dots (n = 50 structures per condition and replicate, three biological replicates). Statistical analysis was conducted by a one-way ANOVA followed by a Dunnett’s post hoc test. P values: GFP–Atg11 versus Vph1–GFP, ****P < 0.0001; GFP–Atg11 versus Nup170–GFP, *P = 0.0439. c, Atg9–3×GFP atg11∆ or Atg1–3×GFP cells expressing mScarlet–Atg11, endogenous BFP–Ape1 and copper-inducible untagged Ape1 were grown to mid-log phase in the presence of 50 µM CuSO4. Images of one out of three biological replicates are shown. Scale bar, 2 µm. d, Cells expressing Ede1–BFP, mScarlet–Atg11 and either Atg1–mNeon or Atg9–mNeon were grown to mid-log phase. Images of one out of three biological replicates are shown. Scale bar, 2 μm. e, mScarlet–Atg11 atg19∆ cells coexpressing either Atg19, an empty control vector (−) or Atg19–GBP and endogenous GFP–Ape1 and copper-inducible untagged Ape1 were grown to mid-log phase in the presence of 50 µM CuSO4. Scale bar, 2 µm. Quantification: mScarlet–Atg11 clustering as the coefficient of variance (s.d./mean mScarlet intensity) in a box plot. Horizontal lines show the median, box shows 25th to 75th percentiles, whiskers show the 5th and 95th percentiles, circles show the mean value of each replicate, outliers are indicated by black dots (n = 50 structures per condition and replicate, three biological replicates). Statistical analysis: two-tailed unpaired t-test. **P = 0.0012. f, atg19∆ cells expressing mScarlet–Atg11 and 2×GFP–Ede1 without (−) or with (+) 3×GBP under the control of a copper-inducible promoter were grown to mid-log phase. Scale bar, 5 µm. Data are mean values (n > 37 ENDs per condition and replicate, four biological replicates). Circles show mean values of each replicate, bars show the mean. Statistical analysis was carried out by two-tailed unpaired t-test. P value: 3×GBP(−) versus 3×GBP(+), ****P < 0.0001. Source numerical data are available in Source data.
Fig. 3
Fig. 3. Phase separation of Atg11 drives initiation hub formation.
a, GFP–Atg11 cells expressing endogenous BFP–Ape1 and copper-inducible untagged Ape1 or wild-type cells expressing GFP–Ape1 and copper-inducible untagged Ape1 were grown to mid-log phase in the presence of 50 µM CuSO4. GFP–Atg11 and GFP–Ape1 structures were photobleached and recovery of the signal was monitored. White arrowheads show the photobleached area. Scale bar, 1 µm. Quantification: recovery of the GFP signal. Data show mean ± s.e.m. (n > 32 foci per condition across replicates, three biological replicates). b, GFP–Atg11 cells expressing endogenous BFP–Ape1 and copper-inducible untagged Ape1 were grown to mid-log phase in the presence of 50 µM CuSO4. The dynamics of GFP–Atg11 foci were monitored and represented as kymographs. Images of one out of three biological replicates are shown. Scale bar, 2 µm. Kymograph scale bar, 1 µm. c, GFP–Atg11 was purified from Sf9 insect cells and droplet formation was monitored in vitro at different concentrations by fluorescence microscopy after 20 min incubation at room temperature in a buffer containing 150 mM NaCl. Images from one out of three biological replicates are shown. Scale bar, 5 µm. Quantification is shown in Extended Data Fig. 2e. d, In vitro formed GFP–Atg11 droplets were photobleached and recovery of the signal was measured. White arrowheads indicate the photobleached area. Scale bar, 1 µm. Quantification: recovery of the GFP signal. Data show mean ± s.e.m. (n = 30 structures per condition and replicate, three biological replicates). e, Coalescence of in vitro formed GFP–Atg11 droplets was monitored. Scale bar, 2 µm. Quantification: droplet size, represented in a scatter-plot. Statistical analysis was carried out by a two-tailed unpaired t-test. Circles show mean values of each replicate, horizontal lines show the median (n = 6 coalescence events, three biological replicates). *P = 0.026. Further examples are shown in Extended Data Fig. 3a. f, atg19∆, atg13∆ atg19∆ or atg13∆ atg19∆ vac8∆ cells were transformed with Atg11–GFP overexpressed under a GPD promoter. The formation of Atg11 condensates was monitored. Scale bar, 2 µm. The percentage of cells with Atg11–GFP foci was quantified, displayed in a bar graph. Data are mean values (n = 100 cells per condition and replicate, three biological replicates). Circles show mean values of each replicate, bars show mean. Statistical analysis was conducted by one-way ANOVA followed by a Dunnett’s post hoc test. P values: atg19∆ versus atg19∆ atg13∆, P = 0.9885; atg19∆ versus atg19∆ atg13∆ vac8∆, P = 0.688. g, Atg11–GFP was overexpressed in atg19∆ atg13∆ vac8∆ cells and cells were grown to the mid-log phase. GFP condensates were fully photobleached and their recovery was monitored. White arrowheads indicate the bleached area. Scale bar, 2 µm. Quantification: recovery of the GFP signal. Data show mean ± s.e.m. (n = 25 structures per condition across replicates, three biological replicates). Source numerical data are available in Source data.
Fig. 4
Fig. 4. Initiation hubs coalesce at the vacuolar contact site to trigger phagophore initiation.
a, Initial (top) and final (bottom) snapshots of a molecular simulation corresponding to a very-low-affinity, low-affinity and high-affinity interaction of Atg11–Atg19 subcomplexes (grey to green) with a cargo (blue). The clustering is shown by visualizing the number of neighbours of Atg11–Atg19 particles. Stronger colours indicate that more neighbours are in proximity and will result in a stronger coupling. b, GFP–Atg8 cells expressing mScarlet–Atg11, endogenous BFP–Ape1 and copper-inducible untagged Ape1 were grown to mid-log phase in the presence of 50 µM CuSO4. Images of one out of three biological replicates are shown. Scale bar, 2 µm. c, mScarlet–Atg8 atg19∆ cells expressing endogenous GFP–Ape1 and copper-inducible untagged Ape1 along with Atg19 or Atg19–GBP were grown to mid-log phase in medium containing CuSO4 and rapamycin to induce phagophore formation. Scale bar, 2 µm. Quantification: elongated mScarlet–Atg8-positive structures on cargo. Data show the mean (n = 100 structures per condition and replicate, three biological replicates). Circles show the mean of each replicate, bars show the mean. Statistical analysis was conducted by a two-tailed unpaired t-test, P = 0.0061. d, Atg9–3×GFP mScarlet–Atg8 cells expressing endogenous BFP–Ape1 and copper-inducible untagged Ape1 grown and treated as in c. Scale bar, 2 µm. Quantification: cargo-associated Atg9 clusters. Data are mean values (n = 100 cells per condition and replicate, three biological replicates). Circles show the mean of each replicate, bars show the mean. Statistical analysis was conducted by a two-tailed unpaired t-test. P values: rich versus rapa(for 1–2 clusters), ***P = 0.0002; rich versus rapa(for >2 clusters), ***P = 0.0002. e, GFP–Atg19 cells overexpressing copper-inducible untagged Ape1 were grown to mid-log in medium containing CuSO4 and rapamycin (one out of three identified examples shown). (i) In situ cryo-electron tomographic slice. Orange arrowhead indicates phagophore; V, vacuole. (ii) Different slice (+16.6 nm from i). (iii) Segmentation and 3D rendering of the tomographic volume. Orange, phagophore; grey, vacuole membrane. Scale bar, 200 nm (i), 50 nm (ii,iii). Correlative fluorescence images are shown in Extended Data Fig. 5e. f, Indicated strains expressing endogenous GFP–Ape1 and copper-inducible untagged Ape1, Atg19–GFP–µNS or pp–GFP–µNS were grown to mid-log phase in the presence of 50 µM CuSO4. GFP cleavage was monitored by immunoblotting. pp, Ape11–45. One out of three biological replicates is shown. g, Cells as in f coexpressing mScarlet–Atg11 were monitored by fluorescence microscopy. Scale bar, 2 µm. Quantification: GFP clustering as the coefficient of variance (s.d./mean GFP intensity) in a box plot. Horizontal lines show the median, box shows 25th to 75th percentiles, whiskers indicate the 5th and 95th percentiles, circles show the mean value of each replicate, outliers are shown as black dots (n = 50 structures per condition and replicate, three biological replicates). Statistical analysis was conducted by a one-way ANOVA followed by a Dunnett’s post hoc test. P values: pp–GFP–µNS versus Atg19–GFP–µNS, ****P < 0.0001; pp–GFP–µNS versus GFP–Ape1, P = 0.9826. Source numerical data and unprocessed blots are available in Source data. Source data.
Fig. 5
Fig. 5. Initiation hubs for selective autophagy are conserved in human cells.
a, U2OS cells transfected with FKBP–GFP–ULK1 and mCherry–Parkin were stained with MitoTracker DeepRed. Mitophagy was induced with antimycin A and oligomycin (AO). Live cells were visualized by fluorescence microscopy. Scale bar, 10 µm; Scale bar inset, 1 µm. Quantification: cells containing GFP–ULK1 foci. Data are mean values (n > 130 cells per condition across replicates, four biological replicates). Circles show mean values of each replicate, bars show the mean. Statistical analysis was conducted by a one-tailed unpaired t-test, ****P < 0.0001. b, U2OS cells transfected with mCherry–LC3B and YFP–Parkin were stained with MitoTracker DeepRed and treated with AO. Images of one out of three biological replicates are shown. Scale bar, 10 µm. Quantification: cells containing mCherry–LC3B foci. Data are mean values (n > 50 cells per condition across replicates, three biological replicates). Circles show mean values of each replicate, bars show mean. Statistical analysis was conducted by a one-tailed unpaired t-test, ****P = 0.0001. c, U2OS cells were transfected with FKBP–GFP or FKBP–GFP–ULK1 and mCherry–p62, and cultured in nutrient-rich medium or starvation medium (Earle’s balanced salt solution; EBSS) for 4 h to induce bulk autophagy. Live cells were visualized by fluorescence microscopy. Images of one out of three biological replicates are shown. Scale bar, 10 µm, scale bar inset, 1 µm. Quantification: co-localization events between GFP and p62. Data are mean values (n > 100 cells per condition across replicates, three biological replicates). Circles show mean values of each replicate, bars show mean. Statistical analysis was conducted by one-way ANOVA followed by Sidak’s multiple comparison test, ****P < 0.0001. Source numerical data are available in Source data.
Fig. 6
Fig. 6. FIP200 colocalizes with initiation hubs on mitochondria and p62 condensates.
a, Schematic of the synthetic tethering setup in U2OS cells. FRB is targeted to the outer mitochondrial membrane by its fusion with the tail anchor domain of the mitochondrial membrane protein FIS1 (FRB–FIS193–152, residues 93–152 of FIS1). Expression of an FKBP–GFP–ULK1 fusion construct allows its inducible tethering to mitochondrial FRB–FIS193–152 by rapalogue addition, resulting in mitophagy induction. b, U2OS cells stably expressing FRB–FIS193–152 and transfected with FKBP–GFP–ULK1 or FKBP–GFP were cultured in nutrient-rich medium and stained with MitoTracker DeepRed. Tethering was induced with rapalogue. Scale bar, 10 µm, scale bar inset, 1 µm. Quantification: GFP foci on mitochondria. Data are mean values (n > 80 cells per condition across replicates, three biological replicates). Circles show mean values of each replicate, bars show mean. Statistical analysis was carried out by a one-tailed unpaired t-test. ****P < 0.0001. c, U2OS cells stably expressing FRB–FIS193–152 and transfected with FKBP–GFP–ULK1 were cultured in nutrient-rich medium and stained with MitoTracker DeepRed. Tethering of FKBP–GFP–ULK1 to FRB–FIS93–152 was induced with rapalogue. Scale bar, 10 µm; scale bar inset, 1 µm. Quantification: GFP foci on mitochondria. Data are mean values (n > 100 cells per condition across replicates, three biological replicates). Circles show mean values of each replicate, bars show mean. Statistical analysis was carried out by a one-way ANOVA followed by Sidak’s multiple comparison test. P values: 0 h versus 1 h, ****P < 0.0001, 1 h versus 2 h, ****P < 0.0001. d, U2OS cells stably expressing FRB–FIS193–152, transfected with FKBP–GFP–ULK1 and mScarlet–FIP200 were cultured in nutrient-rich medium. Tethering of FKBP–GFP–ULK1 to FRB–FIS93–152 was induced by adding rapalogue for 1 h. Scale bar, 10 µm, scale bar inset, 1 µm. Quantification: mScarlet–FIP200 foci co-localizing with FKBP–GFP–ULK1 foci. Data are mean values (n > 100 cells per condition across replicates, three biological replicates). Circles show mean values of each replicate, bars show mean. Statistical analysis was carried out by a one-tailed unpaired t-test. ****P < 0.0001. e, U2OS cells transfected with FKBP–GFP or FKBP–GFP–FIP200 and mCherry–p62 were cultured in nutrient-rich medium. Scale bar, 10 µm; scale bar inset, 1 µm. Quantification: cells with GFP foci on p62 condensates. Data are mean values (n > 100 cells per condition across replicates, three biological replicates). Circles show mean values of each replicate, bars show the mean. Statistical analysis was conducted by a one-tailed unpaired t-test. ****P < 0.0001. Source numerical data are available in Source data.
Fig. 7
Fig. 7. Initiation hubs establish contact sites with the ER in mammalian cells.
a, Schematic representation of the proximity biotinylation setup. FKBP-APEX2-ULK1 is tethered to mitochondrial FIS1–FRB by rapalogue addition. FIP200 connects this mitochondrial assembly to the ER. Proximity biotinylation is induced by the addition of biotin–phenol and H2O2. Biotinylated proteins are isolated by affinity purification with streptavidin beads and analysed by mass spectrometry. FKBP–APEX2–ULK1 was compared with the unspecific control (FKBP–APEX) in each experiment. b, Mass spectrometry analysis of APEX2-based proximity labelling in HEK293 cells stably expressing 2×FKBP–APEX2–ULK1 or 2×FKBP–APEX2. Cells were grown under nutrient-rich conditions and rapalogue. Proximity labelling was induced by the addition of biotin–phenol and a short pulse of H2O2. The volcano plot shows the enrichment of biotinylated proteins in 2×FKBP–APEX2–ULK1 compared with 2×FKBP–APEX2. Dashed purple lines indicate the cutoffs used to identify ULK1-specific proteins (log2 ratio >1 and adjusted P < 0.01). Known autophagy proteins enriched in 2×FKBP–APEX2–ULK1 are highlighted in cyan. Ratios are calculated using mean values of three biological replicates. Statistical analyses carried out were moderated t-statistics using the limma-trend method and multiple testing correction with the Benjamini–Hochberg procedure. c, Mass spectrometry data from b. The kernel density estimate (KDE) plot compares all proteins against those listed under the Gene Ontology (GO) term ‘autophagy’ (GO:0006914) using the FKBP–APEX2–ULK1 versus FKBP–APEX2 ratio dataset. d, Heatmap displaying ULK1-specific ER membrane proteins with a significantly reduced signal upon knockdown of FIP200 (adjusted P value < 0.05). The enrichment of protein signal in FKBP–APEX2–ULK1 over FKBP-APEX2 is shown for three biological replicates of wild-type and FIP200 knockdown cells. Statistical analysis: two-tailed unpaired t-test, multiple testing correction with the Benjamini–Hochberg procedure. e, Mass spectrometry data from d. The KDE plot shows the comparison FKBP–APEX2–ULK1 WT versus FKBP–APEX2–ULK1 siFIP200 of all proteins that are positive for the GO term ‘ER membrane’ (GO:0005789). The samples were control-corrected before the analysis. f, U2OS cells transfected with FKBP–GFP–FIP200, mCherry–p62 and BFP–Sec61β, were cultured in nutrient-rich medium. Intensity profiles were calculated for the 405 nm, 488 nm and 561 nm channels along the indicated line. A representative image from one out of three biological replicates is shown. Scale bar, 1 µm. The KDE plot shows the difference in ER proximity between FIP200 and p62 structures, calculated from 47 structures. The 3D surfaces of BFP–Sec61β (cyan), FKBP–GFP–FIP200 (green) and mCherry–p62 (magenta) were rendered with the Imaris software using the machine-learning tool for surface segmentation. A z-stack of 0.125 µm was taken to define the borders in z. Further examples are shown in Extended Data Fig. 7c,d. Source numerical data are available in Source data.
Fig. 8
Fig. 8. Receptor mobility is also a required feature for selective autophagy in human cells.
a, U2OS cells stably expressing FRB–FIS193–152 and transfected with 2×FKBP–GFP–ULK1 were cultured in nutrient-rich medium. To induce the homo-oligomerization of 2×FKBP–GFP–ULK1 the cells were treated with the homodimerizer AP20187 for 24 h. Tethering of FKBP–GFP–ULK1 to FRB–FIS93-152 was induced by adding rapalogue for 2 h. Images of one out of three biological replicates are shown. Scale bar, 10 µm; scale bar inset, 1 µm. b, U2OS cells stably expressing FRB–FIS193–152 and transfected with 2×FKBP–GFP–ULK1 were cultured in nutrient-rich medium and stained with MitoTracker DeepRed. To induce the homo-oligomerization of 2×FKBP–GFP–ULK1 the cells were treated with AP20187 for 24 h. Tethering of 2×FKBP–GFP–ULK1 to FRB–FIS93–152 was induced by adding rapalogue for 2 h. 2×FKBP–GFP–ULK1 clusters were photobleached, recovery of the signal was monitored. White arrowheads indicate the bleached area. Scale bar, 1 µm. Quantification: recovery of the GFP signal. Data are mean values ± s.e.m. (n = 30 structures per condition across replicates, three biological replicates). c, U2OS wild-type cells stably expressing mito-mKeima and FRB–FIS93–152 and FKBP–GFP–ULK1 were grown in nutrient-rich medium and treated with Bafilomycin A1 (Baf), rapalogue and AP20187 (24 h) as indicated. Cytosolic and lysosomal mt-mKeima fluorescence signal was monitored using flow cytometry and gating for GFP-expressing cells was performed. Data are mean values (n > 50,000 cells per condition and replicate, three biological replicates). Circles show mean values of each replicate, bars show the mean. Statistical analysis was carried out by a one-way ANOVA followed by Sidak’s multiple comparison test. P values: 2 h, ****P = 0.0001; 4 h, ****P < 0.0001. d, U2OS WT cells were transfected with either GFP–p62–GFP alone or together with mCherry–3×GBP. GFP–p62–GFP clusters were photobleached and recovery of the signal was monitored. White arrowheads indicate the photobleached area. Scale bar, 1 µm. Quantification: recovery of the GFP signal. Data are mean values ± s.e.m. (n > 20 structures per condition across replicates, three biological replicates). e, WT and ATG13KO U2OS cells were transfected with either GFP–p62–GFP alone or together with mCherry–3×GBP. The cells were starved in EBSS medium. GFP cleavage was monitored by immunoblotting. RFP, red fluorescent protein. Quantification: ratio between free GFP and 2×GFP–p62. Data are mean values (n = 4 biological replicates). Circles show values of each replicate, bars show mean. Statistical analysis was carried out by a one-way ANOVA followed by Sidak’s multiple comparison test. P values: WT, ****P < 0.0001; ATG13KO, P = 0.9982. f, A universal model of selective autophagy (see text for details). Source numerical data and unprocessed blots are available in Source data. Source data
Extended Data Fig. 1
Extended Data Fig. 1. High-affinity receptor–cargo interactions impair selective autophagy.
a, Wild-type and atg1∆ cells were grown to mid-log phase and treated as indicated. Cell extracts were analysed by immunoblotting. One out of three biological replicates with similar results is shown. b, Strains expressing 2×GFP-Ede1 and either no 3×GBP (–), +3×GBP or +3×GBPlow were treated with rapamycin and TCA precipitated. GFP cleavage was monitored by immunoblotting. One out of three biological replicates with similar results is shown. c, Representative fluorescence microscopy images from Fig. 1b. Scale bar: 5 μm. Quantification: area of ENDs in a box plot. Horizontal lines: median bound protein, box: 25th to 75th percentiles, whiskers: expand to 5th and 95th percentiles, outliers: black dots (n > 761 ENDs per condition and replicate, three biological replicates). Statistical analysis: two-tailed unpaired t-test. P value: -3×GBP/+3×GBP P < 0.0001, Quantification: number of ENDs per cell. Data are mean values (n > 170 cells per condition and replicate, three biological replicates). Statistical analysis: Multiple unpaired t-tests. P values: -3×GBP:+3×GBP (1) P = 0.1425, -3×GBP:+3×GBP (2) P = 0.3669, -3×GBP/+3×GBP (3) P = 0.1243, -3×GBP/+3×GBP (4) P = 0.1087, -3×GBP/+3×GBP (5) P = 0.2158. d, Crystal structure of GFP (green) bound to GBP (grey) (PDB: 3OGO). Inset shows binding interface disrupted by mutations of residues Phe103 and Glu104 (orange) made in this study to create GBPmed and GBPlow. e, Representative images from Fig. 1b. Scale bar: 2 μm. f, Representative images from Fig. 1d. Scale bar: 2 μm. g, GFP–Atg19 cells expressing endogenous BFP–Ape1 and copper-inducible untagged Ape1 or GBP-BFP–Ape1 and copper-inducible untagged Ape1 were grown to mid-log phase in the presence of 50 µM CuSO4. GFP–Atg19 structures were photobleached, and recovery of the signal was monitored. Scale bar: 1 µm. White arrowheads: photobleached area. Scale bar 1 µm. Quantification: recovery of the GFP signal. Data are mean values ± SEM (n = 28 structures per condition across replicates, three biological replicates). h, mScarlet–Atg11 atg19∆ cells expressing endogenous GFP–Ape1 and copper-inducible untagged Ape1 together with an empty control vector (-), Atg19 or Atg19–GBP were grown to mid-log phase in the presence of 50 µM CuSO4. GFP–Ape1 structures were photobleached, and recovery of the signal was monitored Scale bar: 1 µm. White arrowheads: photobleached area. Scale bar 1 µm. Quantification: recovery of the GFP signal. Data are mean values ± SEM (n > 20 structures per condition across replicates, three biological replicates). For each panel, one example out of three biological replicates is shown. Source numerical data and unprocessed blots are available in source data, not significant (n.s.), arbitrary units (a.u.). Source data
Extended Data Fig. 2
Extended Data Fig. 2. Atg11 forms initiation hubs on selective cargo.
a, mScarlet–Atg11 atg19∆ cells coexpressing either Atg19 or Atg19–GBP and endogenous GFP–Ape1 and copper-inducible untagged Ape1 were grown to mid-log phase in the presence of 50 µM CuSO4. Quantification: mean mScarlet–Atg11 signal intensity in a box plot. Horizontal lines: median, box: 25th to 75th percentiles, whiskers: expand to 5th and 95th percentiles, circles: mean value of each replicate, outliers: black dots (n = 50 GFP–Ape1 positive particles per condition and replicate, three biological replicates). Statistical analysis: two-tailed unpaired t-test. b, Atg1-3xmCherry atg19∆ cells expressing endogenous GFP–Ape1 and copper-inducible untagged Ape1 together with an empty control vector (-), Atg19 or Atg19–GBP were grown to mid-log phase in the presence of 50 µM CuSO4. Scale bar: 2 µm. Quantification: Atg1-3xmCherry positive GFP–Ape1 structures. Data are mean values (n = 100 structures per condition and replicate, three biological replicates). Circles: mean values of each replicate, bars: mean. Statistical analysis: Dunnett post hoc test. P values: –:Atg19 P < 0.0001, Atg19:Atg19–GBP P < 0.0001. c, Indicated cells expressing GFP–Atg11, endogenous BFP–Ape1 and copper-inducible untagged Ape1 were grown to mid-log phase in the presence of 50 µM CuSO4.Scale bar: 2 µm. Quantification: GFP clustering as the coefficient of variance (SD/mean GFP intensity) in a box plot. Horizontal lines: median, box: 25th to 75th percentiles, whiskers: expand to 5th and 95th percentiles, circles: mean value of each replicate, outliers: black dots (n = 50 structures per condition and replicate, three biological replicates). Statistical analysis: one-way ANOVA followed by Dunnett post hoc test. P values: wild-type:atg9∆ P = 0.0498, wild-type:vac8∆ P = 0.9036, wild-type:atg9∆vac8∆ P = 0.9893. d, Vac8-mCherry and GFP–Atg11 cells expressing endogenous BFP–Ape1 and copper-inducible untagged Ape1 were grown to mid-log phase in the presence of 50 µM CuSO4. The dynamics of GFP–Atg11 foci were monitored and the fluorescence profile of GFP was measured along the Ape1 surface. Images of one out of three independent experiments are shown. Scale bar: 2 µm, scale bar inset: 1 µm. Time-lapse series are shown as Supplementary Videos 1–12. e, Quantification of GFP–Atg11 droplet size of Fig. 3c in a box plot. Horizontal lines: median, box: 25th to 75th percentiles, whiskers: expand to 5th and 95th percentiles, circles: mean value of each replicate, outliers: black dots (n = 30 structures per condition and replicate, three biological replicates). Statistical analysis: one-way ANOVA followed by a Dunnett post hoc test. P values: 0.005:2 P < 0.0001, 0.05:2 P < 0.0001, 0.25:2 P < 0.0001, 0.5:2 P < 0.0001, 1:2 P < 0.0001. Source numerical data are available in source data, not significant (n.s.), arbitrary units (a.u.).
Extended Data Fig. 3
Extended Data Fig. 3. Initiation hubs on selective cargo are dynamic.
a, Further examples of coalescence of in vitro formed GFP–Atg11 droplets as shown and quantified in Fig. 3e. Scale bar: 2 µm. b, Schematic illustration of Atg11 domains. c, atg19∆ vac8∆ or atg13∆ atg19∆ vac8∆ were transformed with Atg11–GFP (OE Atg11) or Atg111-454-GFP (OE Atg111-454) overexpressed under a GPD promoter or Atg11–GFP expressed under its native promoter (End. Atg11) and grown to mid-log phase. Quantification: cells with GFP puncta. Data are mean values (n = 100 cells per condition and replicate, three biological replicates). Circles: mean values of each replicate, bars: mean. Statistical analysis: two-way ANOVA followed by a Tukey post hoc test. P values: atg19∆vac8∆: OE Atg11:End. Atg11 P < 0.0001, OE Atg11:OE Atg111-454 P < 0.0001; atg13∆ atg19∆ vac8∆: OE Atg11:End. Atg11 P < 0.0001, OE Atg11:OE Atg111-454 P < 0.0001. d, atg11∆ atg19∆ cells expressing endogenous BFP–Ape1 and copper-inducible untagged Ape1 along with Atg111-873-GFP–Atg19, Atg111-607-GFP–Atg19, or Atg111-454-GFP–Atg19 were grown to mid-log phase in the presence of 50 µM CuSO4. Statistical analysis: one-way ANOVA followed by a Dunnett post hoc test. Scale bar: 2 µm. (n = 50 structures per condition and replicate, three biological replicates). P value: Atg111-873-GFP–Atg19:Atg111-454-GFP–Atg19 P < 0.0001, Atg111-873-GFP–Atg19: Atg111-607-GFP-Atg1 P = 0.451. e, Cells overexpressing Atg11–GFP under a GPD promoter and expressing Atg9-3xmCherry or 3xmCherry in atg19∆ or atg19∆ vac8∆ strains were grown to mid-log phase. Scale bar: 2 µm. Quantification: co-localization of Atg9-3xmCherry and Atg11–GFP puncta. Data are mean values (n > 148 punctae per condition and replicate, three biological replicates). Circles: mean values of each replicate, bars: mean. Statistical analysis: two-tailed unpaired t-tests. P values: WT P < 0.0001, vac8∆ P < 0.0001. f, GST–BFP or GST–BFP–Atg193D (a hosphor-mimetic mutant of Atg19 known to stably interact with Atg11, S390D, S391D, and S396D) were expressed in E. coli and bound to Glutathione Sepharose (GSH) beads, incubated with Sf9 insect cell lysates containing overexpressed GFP–Atg11, and bound GFP–Atg11 was analysed. Scale bar: 20 µm. Quantification: ratio of bead-bound protein to soluble protein in a box plot. Horizontal lines: median, box: 25th to 75th percentiles, whiskers: expand to 5th and 95th percentiles, circles: mean value of each replicate, outliers: black dots (n > 18 beads per condition across replicates, three technical replicates). Statistical analysis: two-tailed unpaired t-test. P values: P = 0.2102. g, In vitro formed GFP–Atg11 droplets coupled to Atg193D containing beads were photobleached, and recovery of the signal was measured. Quantification: recovery of the GFP signal. Data are mean ± SEM (n = 10 structures across replicates, three technical replicates). Source numerical data are available in source data, not significant (n.s.), arbitrary units (a.u.).
Extended Data Fig. 4
Extended Data Fig. 4. Initiation hubs coalesce at the vacuolar contact site to trigger phagophore initiation.
a, Vac8-mCherry GFP–Atg11 cells expressing endogenous BFP–Ape1 and copper-inducible untagged Ape1 were grown to mid-log phase in the presence of 50 µM CuSO4. The dynamics of GFP–Atg11 foci were monitored. Scale bar: 2 µm. b, Kymograph corresponding to Extended Data Fig. 3a (i) and additional representative examples of kymographs (ii,iii). Scale bar: 2 µm. c, GST–BFP or GST–BFP–Vac8 were expressed in E. coli and bound to Glutathione Sepharose (GSH) beads. Protein-bound beads were incubated with Sf9 insect cell lysates containing overexpressed GFP–Atg11, and bound GFP–Atg11 was analysed before and after eight washing steps. Scale bar: 20 µm. Data are mean values (n > 65 condensates per condition and replicate, three technical replicates). Circles: mean values of each replicate, bars: mean. Statistical analysis: two-tailed unpaired t-test. P values: P = 0.7. d, Purified vacuoles were incubated with recombinant GFP–Atg11 droplets. Scale bar: 1 µm. Quantification: Atg11 condensates bound to vacuoles in a box plot. Horizontal lines: median, box: 25th to 75th percentiles, whiskers: expand to 5th and 95th percentiles, circles: mean value of each replicate, outliers: black dots (n > 599 condensates per condition and replicate, three technical replicates). Statistical analysis: two-tailed unpaired t-test. P value: vac8∆:WT P < 0.0001. Source numerical data are available in source data, not significant (n.s.), arbitrary units (a.u.).
Extended Data Fig. 5
Extended Data Fig. 5. Autophagy initiation hubs are conserved in human cells.
a, GFP–Atg11 Vac8-mCherry cells expressing endogenous BFP–Ape1 and copper-inducible untagged Ape1 were grown to mid-log phase in the presence of 50 µM CuSO4. The fluorescence profile of GFP (green) and mCherry (magenta) was measured along the Ape1 condensate surface. Images of one out of three independent experiments are shown. Scale bar: 2 µm. b, Cells expressing Ede1–BFP, mScarlet–Atg11, and Vac8-mNeon were grown to mid-log phase. The fluorescence profile of mNeon (green) and mScarlet (magenta) was measured along the Ede1 condensate surface. Images of one out of three independent experiments are shown. Scale bar: 2 µm. c, GFP–Atg11 or GFP–Atg11 vac8∆ cells expressing endogenous BFP–Ape1 and copper-inducible untagged Ape1 were grown to mid-log phase in the presence of 50 µM CuSO4. The fluorescence profile of GFP (green) was measured along the Ape1 condensate surface. Images of one out of three independent experiments are shown. Scale bar: 2 µm. d, GFP–Atg11 cells expressing endogenous BFP–Ape1 and copper-inducible untagged Ape1 were grown to mid-log phase in the presence of 50 µM CuSO4. Atg11 rearrangement was monitored after rapamycin treatment. Quantification: BFP–Ape1 structures with rearranged Atg11 clusters. Scale bar: 2 µm. Data are mean values (n = 50 structures per condition and replicate, three biological replicates). Circles: mean values of each replicate, bars: mean. Statistical analysis: two-way ANOVA followed by Sidak’s multiple comparison test. P values: rich P < 0.0001, rapa P = 0.0005, rich(1-2):rapa(1-2) P < 0.0001, rich(>2):rapa(>2) P < 0.0001. e, Overlays of maximum intensity projection of a GFP–Atg19 cryo-fluorescence stack on 470x (left) and 6500x (right) magnification TEM images used to select acquisition region for tomogram shown in Fig. 4e. Scale bars: 10 µm (left) and 2 µm (right). One out of three identified examples is shown. Source numerical data are available in source data, arbitrary units (a.u.).
Extended Data Fig. 6
Extended Data Fig. 6. Degradation of a neo-cargo by selective autophagy.
a, Indicated cells expressing Atg19 or Cnb1–Atg19, and GFP–Ape1 and copper-inducible untagged Ape1 or FKBP–GFP-µNS were grown to mid-log phase in the presence of 50 µM CuSO4 and treated with FK506. GFP cleavage was monitored by TCA precipitation and immunoblotting. One out of three biological replicates with similar results is shown. b, atg19∆ cells expressing Atg19, an empty vector control (–), Cnb1–Atg19 or Atg19–GBP were grown to mid-log phase. Cell extracts were analysed by immunoblotting. One out of three biological replicates with similar results is shown. c, GFP–Atg11 atg19∆ cells expressing endogenous BFP–Ape1 and copper-inducible untagged Ape1 and GFP–Atg11 atg19∆ ape1∆ cells expressing pp-BFP–µNS or Atg19-BFP–µNS were grown to mid-log phase. GFP–Atg11 structures were photobleached, and recovery of the signal was monitored. Scale bar: 1 µm. Quantification: recovery of the GFP signal. Data are mean values ± SEM (n > 26 structures per condition across replicates, three biological replicates). d, Cells from Extended Data Fig. 6a coexpressing mScarlet–Atg11 were analysed and quantified as in Fig. 2b. Scale bar: 2 µm. Quantification: GFP clustering as the coefficient of variance (SD/mean GFP intensity) in a box plot. Horizontal lines: median, box: 25th to 75th percentiles, whiskers: expand to 5th and 95th percentiles, circles: mean value of each replicate, outliers: black dots (n = 50 structures per condition and replicate, three biological replicates). One-tailed unpaired t-test. P value: P < 0.0001. For each panel, one out of three biological replicates is shown. Source numerical data and unprocessed blots are available in source data, arbitrary units (a.u.). Source data
Extended Data Fig. 7
Extended Data Fig. 7. Autophagy initiation hubs are conserved in human cells.
a, U2OS cells were grown in nutrient-rich medium. mCherry–p62 condensates were photobleached and recovery of the signal was followed. A representative image is shown from one out of three biological replicates. The white arrowhead indicates the photobleached area. Scale bar: 1 µm. Quantification: recovery of the mCherry signal. Data are mean values ± SEM (n = 28 structures across three biological replicates). b, U2OS wild-type cells stably expressing mito-mKeima and FRB-FIS93-152 and FKBP–GFP-ULK1 were grown in nutrient-rich medium and treated with Bafilomycin A1 (Baf) and rapalog as indicated. Gating for GFP-expressing cells was performed. The mito-mKeima ratio of lysosomal mitochondria (561 nm) to cytosolic mitochondria (488 nm) was analysed by flow cytometry and is shown as a ratio normalized to the Baf treatment. Data are mean values (n > 50,000 cells per condition and replicate, two biological replicates). Circles: mean values of each replicate, bars: mean. c, Further examples of Fig. 7f. Quantification: peak-to-peak signal distance in a box plot. Horizontal lines: median, box: 25th to 75th percentiles, whiskers: expand to 5th and 95th percentiles, outliers: black dots (n = 47 plot profiles across three biological replicates). Statistical analysis: one-way ANOVA followed by Sidak’s multiple comparison test. P values: p62-FIP200:p62-ER P < 0.0001, FIP200-ER:p62-ER P < 0.0001. d, Zoomed in 3D reconstruction of Fig. 7f. The 3D surface of BFP–Sec61β (blue), FKBP–GFP-FIP200 (green) and mCherry–p62 (magenta) was rendered with the IMARIS software using the machine learning tool for surface segmentation. A z-stack of 0.125 µm was taken to define the borders in z. e, U2OS cells stably expressing FRB-FIS193-152 and transfected with 2xFKBP-GFP-ULK1 were cultured in nutrient-rich medium and stained with MitoTracker DeepRed. Tethering of 2xFKBP-GFP-ULK1 to FRB-FIS93-152 was induced by adding rapalog for 2 h. Mitochondria-associated 2xFKBP-GFP-ULK1 clusters were photobleached, and the recovery of the signal was monitored. Scale bar: 1 µm. Quantification: recovery of the GFP signal. Data are mean ± SEM (n = 28 structures across three biological replicates). White arrowheads indicate the photobleached cluster. The quantification and the representative image are the same as shown in Fig. 8b. Source numerical data are available in source data, not significant (n.s.), arbitrary units (a.u.).
Extended Data Fig. 8
Extended Data Fig. 8. Gating strategy for flow cytometry.
Cell populations were gated through a series of steps to ensure data specificity and accuracy. First, live cells were selected using FlowJo software by plotting side scatter area (SSC-A) against forward scatter area (FSC-A), which allowed for the selection of a homogenous population based on cell granularity and size. Single cells were then gated by plotting forward scatter height (FSC-H) against forward scatter width (FSC-W) to eliminate doublets and aggregates. After gating, the data were exported as scale values and analysed using an in-house Python library mKeima (https://pypi.org/project/mkeima). GFP-positive cells were selected based on their signal in the B545-H channel. The analysis was then continued using the custom mKeima package.

References

    1. Takeshige, K., Baba, M., Tsuboi, S., Noda, T. & Ohsumi, Y. Autophagy in yeast demonstrated with proteinase-deficient mutants and conditions for its induction. J. Cell Biol.119, 301–311 (1992). - PMC - PubMed
    1. Noda, N. N. & Fujioka, Y. Atg1 family kinases in autophagy initiation. Cell. Mol. Life Sci.72, 3083–3096 (2015). - PMC - PubMed
    1. Kamada, Y. et al. Tor directly controls the Atg1 kinase complex to regulate autophagy. Mol. Cell. Biol.30, 1049–1058 (2010). - PMC - PubMed
    1. Kamada, Y. et al. Tor-mediated induction of autophagy via an Apg1 protein kinase complex. J. Cell Biol.150, 1507–1513 (2000). - PMC - PubMed
    1. Fujioka, Y. et al. Structural basis of starvation-induced assembly of the autophagy initiation complex. Nat. Struct. Mol. Biol.21, 513–521 (2014). - PubMed

MeSH terms

Substances