. 2025 Jan;57(1):140-153.
doi: 10.1038/s41588-024-02039-4. Epub 2025 Jan 7.

Deep CRISPR mutagenesis characterizes the functional diversity of TP53 mutations

Affiliations

Deep CRISPR mutagenesis characterizes the functional diversity of TP53 mutations

Julianne S Funk et al. Nat Genet. 2025 Jan.

Abstract

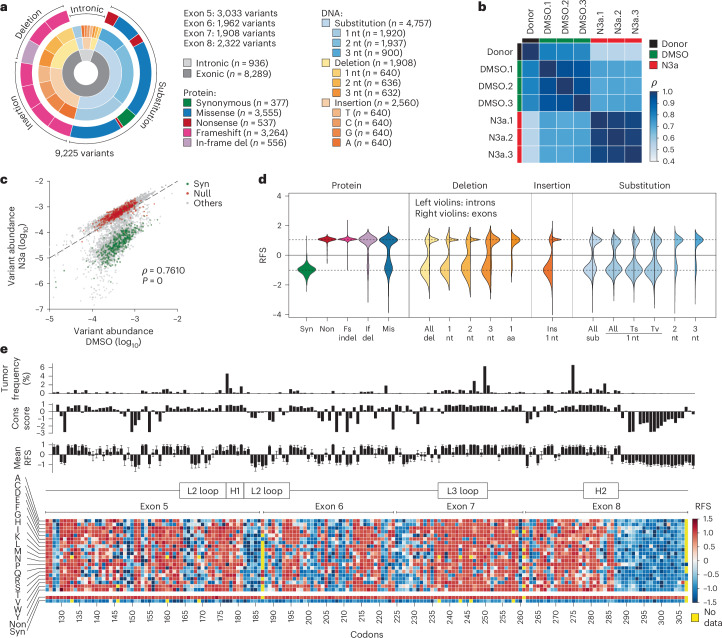
The mutational landscape of TP53, a tumor suppressor mutated in about half of all cancers, includes over 2,000 known missense mutations. To fully leverage TP53 mutation status for personalized medicine, a thorough understanding of the functional diversity of these mutations is essential. We conducted a deep mutational scan using saturation genome editing with CRISPR-mediated homology-directed repair to engineer 9,225 TP53 variants in cancer cells. This high-resolution approach, covering 94.5% of all cancer-associated TP53 missense mutations, precisely mapped the impact of individual mutations on tumor cell fitness, surpassing previous deep mutational scan studies in distinguishing benign from pathogenic variants. Our results revealed even subtle loss-of-function phenotypes and identified promising mutants for pharmacological reactivation. Moreover, we uncovered the roles of splicing alterations and nonsense-mediated messenger RNA decay in mutation-driven TP53 dysfunction. These findings underscore the power of saturation genome editing in advancing clinical TP53 variant interpretation for genetic counseling and personalized cancer therapy.


Conflict of interest statement

Competing interests: The authors declare no competing interests.

Figures

Fig. 1
Fig. 1. Panel of single TP53 mutations in HCT116 cell lines.
a, Scheme for CRISPR–Cas9-mediated TP53 mutagenesis via homology-directed repair (HDR) in HCT116 LSL/Δ cell line. b, Editing efficiency as percentage of single-cell clones that contain a targeted integration of the donor and the desired mutation analyzed by PCR and sequencing, respectively. Shown are results for single mutations and the mean across the panel. c, Western blot demonstrating mutant p53 and p21 protein expression in HCT116 clones after Cre-mediated excision of the LSL cassette in absence and presence of 10 µM N3a. d, Principal component analysis based on RNA-seq data of indicated cell clones ±N3a. e, Gene set enrichment analysis for p53-related gene expression signatures comparing indicated N3a- and DMSO-treated cell clones. f,g, Proliferation of TP53-mutant cell clones in presence of increasing concentrations of N3a analyzed by real-time live-cell imaging. f, Area under the proliferation curve relative to untreated. g, 50% inhibitory concentration (IC50, with 95% CI) for N3a with p53-null (LSL, red) and WT (green) as reference. 95% CI, 95% confidence interval; AUC, area under the curve; FDRq, false discovery rate q-value; LSL, LoxP-Stop-LoxP; Puro, puromycin. Source data
Fig. 2
Fig. 2. Saturating mutagenesis scan of TP53 codon R175.
a, Scheme for CRISPR–Cas9-mediated saturating mutagenesis scan via HDR in HCT116 LSL/Δ cell line and analysis of p53-mediated stress responses by NGS. b, Quality control plots illustrating correlation of variant abundance between donor (plasmid) library and variant cell libraries before and after Cre recombination (−Cre and +Cre) and following 8 d of N3a treatment (+N3a). Shown is the mean ± s.d. abundance (n = 3 biological replicates) for synonymous (syn, green), null (red) and missense (mis, blue) variants. Missense variants that are depleted by N3a are individually labeled. Dashed line, line of identity. c, Heatmap showing pair-wise correlation coefficients (ρ, Spearman). Dendrogram shows hierarchical clustering of samples using average linkage and Euclidean distance. d, Quality control plots illustrating correlation of variant abundance between variant cell libraries after Cre recombination (+Cre) and following 8 d of N3a treatment (+N3a). Shown is the mean ± s.d. abundance (n = 3 biological replicates) for synonymous (syn, green), null (red) and missense (mis, blue) variants. Missense variants that are depleted by N3a are individually labeled. Kernel density estimation plots illustrate separation of variant classes following N3a treatment. Dashed line, line of identity. e, Heatmaps showing the temporal changes of variant abundance in the absence or presence of N3a (n = 3 biological replicates per condition). Enrichment or depletion is shown as the −log2 fold change relative to control conditions: the mean of the 2-week untreated samples (left panel) and the 25-d DMSO-treated samples (right panel). f, Response to Mdm2/Mdmx inhibitors. Heatmap of variant enrichment/depletion after 8 d of treatment relative to the mean of the DMSO-treated control replicates (n = 3 biological replicates per condition). del, deletion; ins, insertion; IR, ionizing radiation; 5-FU, 5-fluorouracil; FC, fold change; non, nonsense; wks, weeks. Source data
Fig. 3
Fig. 3. Differential impact of R175 variants on stress responses and effector mechanisms.
a,b, Comparison of different stress factors. a, Heatmap showing changes in variant abundance in response to DNA damage (IR, ionizing radiation; 5-FU, 5-fluorouracil) or nutrient starvation (−Glc, glucose starvation; −Gln, glutamine starvation) compared with control treatment with DMSO and N3a. Shown is the enrichment as the −log2 fold abundance change relative to the mean of the controls: unirradiated cells for IR samples, untreated cells for 5-FU samples and unstarved cells in regular growth medium for starvation samples (n = 3 biological replicates per condition). b, Scatter plots illustrating the correlation between enrichment under DNA damage or nutrient deprivation and specific p53 activation with N3a. Shown is the mean ± s.d. enrichment (n = 3 biological replicates). Dashed line, line of identity. ce, Proapoptotic activity of R175 variants. c, Experimental scheme and a representative FACS scatter plot demonstrating the sorting strategy based on annexin V staining. GFP-negative (neg) cells were gated to selectively analyze cells expressing the p53 variant, that is, cells with successful deletion of the GFP-expressing LSL cassette after AV-Cre infection. d, Heatmap illustrating N3a-induced changes in variant abundance in the annexin V-positive (pos) fraction (left) compared with the entire cell pool (right). Shown is the −log2 fold change (n = 3 biological replicates) relative to the annexin V-negative fraction (left) or DMSO-treated control cells (right). Lanes labeled as ‘16 d–4 d’ represent the difference between the 4 d and 16 d timepoint, reflecting late N3a-induced changes in variant abundance. e, Scatter plot showing the correlation between the early (4 d) and late (between 4 and 16 d) occurring N3a-induced changes in variant abundance versus their enrichment in the apoptotic cell fraction. Shown is the mean ± s.d. enrichment (n = 3 biological replicates) relative to the DMSO-treated control. All scatter plots show the Pearson correlation coefficient ρ with P value approximated using a two-tailed t-distribution and kernel density estimation plots on the side to illustrate the separation of variant classes. Dashed line, line of identity. FACS, fluorescence-activated cell sorting. Source data
Fig. 4
Fig. 4. TP53 DBD variant screen.
a, Composition of the TP53 DBD mutagenesis library. b,c, Quality control plots. b, Heatmap showing pair-wise correlation coefficients (ρ, Spearman) between sample replicates. c, Scatter plot illustrating separation of variants under p53-activating N3a treatment. Shown is the median abundance of all variants under N3a versus DMSO treatment (n = 3 biological replicates). Synonymous (syn) and nonsense (non) variants highlighted in green and red, respectively. ρ, Spearman correlation coefficient with P value approximated using a two-tailed t-distribution. Dashed line, line of identity. d, Distribution of RFSs for different variant classes. Left violin half shows distribution for intronic, right violin half for exonic variants. e, Heatmap showing the RFS for all mis, syn and non variants. Bar plots show for each codon the mutation frequency in the UMD TP53 mutation database, the evolutionary conservation score and the RFS (mean ± s.d.) of all missense substitutions at this position. Fs, frameshift; if, in-frame; indel, insertion or deletion; nt, nucleotide; sub, substitution; Ts, transition; Tv, transversion. Source data
Fig. 5
Fig. 5. RFS correlates with protein structure, mutation frequency and evolutionary conservation.
a, Structure of a DNA-bound p53 DBD dimer colored by RFS (PDB 3KZ8 (ref. )). The DBD-DNA and intra-dimer interaction interface within a distance of 10 Å is shown as a sphere model and superimposed on the cartoon model to highlight its sensitivity (red color, positive RFS values) to mutation. b,c, Scatter plots showing the correlation between RFS and aggregated variant count in patients with cancer listed in the UMD, IARC/NCI, TCGA and GENIE databases. Variants are colored by the indicated mutation types (b) or evolutionary conservation (c). Source data
Fig. 6
Fig. 6. CRISPR screen reveals pLOF variants.
a, Kernel density estimation plots showing the distribution of RFS scores for the indicated groups of variants in the CRISPR versus cDNA-based variant screens,. All results from previously reported cDNA screens were transformed to RFS by scaling the median of nonsense mutations to +1 and the median of synonymous mutations to −1. Z′ factors, a measure of statistical effect size, are stated as a quality parameter for the assay’s ability to separate positive (LOF nonsense) and negative (synonymous) controls. bd, Scatter plots illustrating correlation between RFS values obtained by CRISPR mutagenesis and cDNA overexpression. Variants are categorized into four quadrants (LL, lower left; LR, lower right; UL, upper left; UR, upper right). Percentage of variants in each quadrant is given in b. ρ, Spearman correlation coefficient with P value approximated using a two-tailed t-distribution. Variants are colored by mutation type (b), average mutational probability (SBSmean) (c) or frequency in patients with cancer (d). Inserted violin plots illustrate the value distribution in the three main quadrants. e, Structure of a DNA-bound p53 DBD dimer (PDB 2AHI (ref. )) colored by the difference in RFS between the CRISPR and cDNA screen. Selected areas of high discrepancy are labeled. f, Scatter plot of the difference between CRISPR and cDNA screen versus the mean transcriptional activity of variants relative to WT p53 as measured in a yeast-based reporter system. The area of 20–60% transcriptional activity (pLOF) is shaded in gray; red line, cubic spline curve. gi, Scatter plots showing the correlation between RFS values obtained by CRISPR mutagenesis and cDNA overexpression. Variants are colored by transcriptional activity (g), classification as pLOF (h) or thermal stability as predicted by HoTMuSiC (i). V157L and T256A are highlighted in i with red outline and increased dot size. Inserted violin plots illustrate the value distribution in the three main quadrants. All violin plots show P values from one-way ANOVA and a post hoc multiple comparisons test by Tukey. Source data
Fig. 7
Fig. 7. Splicing and NMD.
a, Bar plot demonstrating large differences between CRISPR and cDNA screening results at exon borders (residues G187, E224, V225 and S261). Shown is the mean difference (±s.d.) of all missense variants at each codon. b,d, Scatter plots comparing the abundance of variants in the cell libraries at the level of genomic DNA and mRNA. Each dot represents the median abundance of a variant from n = 3 biological replicates. Variants are colored by mutation type (b) and by RFS (d). Dashed line, line of identity. c, Violin plot showing NMD as the log2 fold change in abundance at mRNA and DNA level by mutation type. One-way ANOVA with multiple comparison by Tukey. e, Distribution of RFS values in variants (all or missense) according to NMD status. Variants with a log2 fold change in abundance between mRNA and DNA <−2 were classified as NMD+. Two-sided Mann–Whitney test. fi, LOF and NMD caused by g.7674859C>T (p.E224=) and g.7674859C>G (p.E224D) variants. f, Aberrant mRNA splicing revealed by Sanger sequencing of cDNA. g, Quantitative PCR with reverse transcription (RT–PCR) of indicated HCT116 mut/Δ cells. Shown is the TP53 mRNA expression relative to WT as mean ± s.d. (n = 6 replicates). One-way ANOVA with Dunnett’s multiple comparisons test. h, Western blot demonstrating lack of p53 protein expression in multiple HCT116 cell clones with g.7674859C>T/G variants. i, Resistance of g.7674859C>T/G clones to N3a. Proliferation was analyzed by real-time live-cell imaging. Shown is the area under the proliferation curve relative to untreated. p53-null (LSL, red) and WT (green) are shown as reference. Source data
Fig. 8
Fig. 8. Aberrant splicing due to exonic SNVs causes LOF.
ac, Impact of codon 199 (NC_000017.11:g.7674934T>A/C/G) and codon 137 (NC_000017.11:g.7675202A>T) variants on the anti-proliferative activity of N3a in HCT116 cells. WT, missense (R175H) and nonsense (R175X) variants are shown for comparison. a, Proliferation in the presence of 10 µM N3a analyzed by real-time live-cell imaging. For the g.7674934T>A and g.7675202A>T genotypes, plots show the mean ± s.d. of n = 3 independent clones. b, Dose–response curves. Shown is the area under the proliferation curve (AUC) relative to untreated. c, IC50 (with 95% CI). d, Western blot demonstrating mutant p53 and p21 protein expression in independent HCT116 clones in the absence and presence of N3a. e,f, cDNA analysis of g.7674934T>A/C/G clones. e, Agarose gel electrophoresis of RT–PCR products. f, Scheme of mRNA transcripts detected by Sanger sequencing of RT–PCR amplicons. g, Western blot demonstrating reduced size of p53 protein in HCT116 clones with the g.7675202A>T genotype. h,i, cDNA analysis of g.7675202A>T clones. h, Agarose gel electrophoresis of RT–PCR products. i, Sequencing analysis of RT–PCR amplicons showing an in-frame deletion of 12 amino acids. j, Quantitative RT–PCR specific for the regularly spliced p53 and CDKN1A/p21 mRNA in HCT116 g.7675202A>T cells transfected with SSO and treated with N3a as indicated. Shown is the mRNA expression relative to untreated as mean ± s.d. (n = 3 replicates); two-way ANOVA with Tukey’s multiple comparisons test. M, DNA size marker; NTC, no template control. Source data
Extended Data Fig. 1
Extended Data Fig. 1. Generation and functional characterization of single TP53-mutant HCT116 cell clones.
a, CRISPR/Cas9-targeting of TP53 in HCT116 cells. Shown are the two TP53 alleles and their modifications. The Δ allele contains inactivating intronic deletions (b and c). The second allele contains a loxP-flanked transcriptional stop (LSL) cassette, expressing GFP and a non-functional puromycin N-acetyltransferase (Puromut) resistance gene, and harbors an SNV for allele-specific Cas9-targeting. Donor vectors contain an intact puromycin resistance gene allowing selection of HDR-edited cells. To prevent re-cutting and enable selective amplification of edited alleles (LSL-mut), exon 5/6 donors contained a PAM-inactivating mutation. An intron-7 deletion on the LSL allele eliminated the need for an additional exon 7/8 donor mutation. Adenoviral Cre was used to excise the LSL-cassette and activate expression, yielding HCT116 mut/Δ cells. Selective NGS of the edited and Cre-recombined allele was ensured by nested PCR using the indicated primer pairs. d and e, Western blot of p53 and p21 expression in the indicated cell lines treated with Cre and N3a as indicated. f and g, Proliferation of TP53-mutant cell clones in the presence of N3a analyzed by real-time live-cell imaging. Shown is the area under the proliferation curve (AUC) relative to untreated. p53-null (LSL, red) and wild type (WT, green) are shown for reference. h-j, p53 protein expression in edited HCT116 and H460 cells, normal human diploid fibroblasts (NHDF, two donors), mammary epithelial cells (MCF10A), normal human epidermal keratinocytes (NHEK), and patient-derived p53-mutant cell lines. j, Quantification of p53 normalized to β-actin in (i). Mean±SD (n=5 cell lines per group); one-way ANOVA with Holm-Šídák's multiple comparisons test. Source data
Extended Data Fig. 2
Extended Data Fig. 2. Clonal variance analysis by single-cell RNA sequencing.
Dimensionality reduction analysis (Uniform Manifold Approximation and Projection, UMAP) was used to visualize the overall distribution of a DMSO- and a second N3a-treated cell pool, each containing 12 different TP53 variants, including 8 missense, 3 nonsense, and wild type (WT), with each variant represented by 10 independent single-cell clones. a, UMAP plot colored by treatment (cell pool) with two main cell clusters highlighted. b, Expression of p53-related genes/signatures (top) and cell cycle-related genes/signatures (bottom). c, Cells colored by variant class or variant genotype. d, Cells with indicated variant genotypes colored by clone ID and treatment. Source data
Extended Data Fig. 3
Extended Data Fig. 3. R175H enables development of pro-metastatic properties.
a-c, Transwell migration assays of indicated HCT116 R175H/Δ and R175X/Δ cells treated with N3a or DMSO (D). a, Western blot. b, Images of migration assays stained with crystal violet. c, Quantification of migration. Mean ±SD (n=3 biological replicates) relative to DMSO-treated R175X cells; one-way ANOVA with Dunnett’s multiple comparisons test. d-e, In vivo tumor progression model. d, HCT116 R175H/Δ and R175X/Δ cells were grown in mice after intravenous injection. Tumors from lungs and metastatic sites were explanted, expanded in cell culture and re-injected for up to 3 mouse passages (p0-3). e, Western blot. f, Transwell assays for migration and invasion after mouse passaging. Mean ±SD (n=3 biological replicates) relative to original LSL/Δ cells; two-way ANOVA with Dunnett’s multiple comparisons test. g, Proliferation curves of R175H p0 and p3-met cells measured by real-time live-cell imaging. Shown is the mean confluence of n=3 experiments. h-k, Transwell migration and invasion. nsi, non-silencing siRNA; p53si, p53-targeting siRNA. Mean ±SD (n=3 biological replicates); one-way ANOVA with Šídák's multiple comparisons test. h and j, p53 Western blots of cells in (i) and (k). l-r, HCT116 R175H/Δ p3-met cells with CRISPR-knockout of p53R175H. l, Western blot. m, Proliferation after transduction with p53-targeting or control Cas9-nucleases. n-o, Quantification of migration (n) and invasion (o). Mean ±SD (n=3 biological replicates) relative to sgCtrl-cells; one-way ANOVA with Dunnett’s multiple comparisons test. p-r, In vivo metastasis assay. p, HCT116 R175H/Δ p3-met cells were dual-labelled with firefly and secreted Gaussia luciferase, transfected with CRISPR nucleases, and subcutaneously injected into immunodeficient mice. q, Primary tumor growth based on secreted Gaussia luciferase levels. Mean ±SD (n=7 mice per group). p-value of group factor from two-way ANOVA. r, Liver metastasis based on firefly luciferase activity in whole liver homogenate. Mean ±SD relative to control-sgRNA (n=7 mice per group); two-sided unpaired t-test. RLU, relative light units. Source data
Extended Data Fig. 4
Extended Data Fig. 4. R175 mutagenesis screen in H460 cells.
a, Scheme depicting the generation of the H460 LSL/Δ/Δ cell line. b, Sanger sequencing results of the three TP53 alleles in H460 LSL/Δ/Δ cells. c, Sanger sequencing results of the LSL allele at codon 175 for R175-edited/mutated H460 cell clones. d, Western blot of mutated H460 cell clones ± Cre and N3a. e, Heatmap depicting changes in variant abundance following 8 days of 10 µM N3a treatment. Shown is the -log2 fold change versus the mean of the DMSO-treated controls (HCT116 n=3; H460 n=6 biological replicates). f, Scatter plot illustrating the correlation between N3a-induced variant enrichment in HCT116 and H460 cells. Shown is the mean ±SD enrichment (-log2 FC, n=3 biological replicates) and Pearson correlation coefficient ρ with p-value approximated using a two-tailed t-distribution. Dashed line, line of identity. Source data
Extended Data Fig. 5
Extended Data Fig. 5. TP53 DBD variant screen.
a, Quality control plots illustrating the correlation of variant abundance between donor and DMSO- or N3a-treated cell libraries. Shown is the median abundance (n=3 biological replicates). Syn, synonymous; non, nonsense. ρ, Spearman correlation coefficient with p-value approximated using a two-tailed t-distribution. Dashed line, line of identity. b-d, Kernel density estimation (KDE) plots of (b) variant abundance in indicated donor and cell libraries, (c) enrichment (log2 fold change) under treatment, and (d) RFS. e, Bar plot showing the median RFS values of all perturbations at exemplary codons (blue, negative RFS indicative of WTp53-like activity; red, positive RFS indicative of loss of WTp53 function). Black bars indicate the patient counts in the UMD TP53 mutation database. f, Hierarchically clustered heatmap showing the RFS for all missense variants. Bar plots show for each codon the mutation frequency in the UMD TP53 mutation database, the evolutionary conservation score, and the median±SD RFS at this position. g, Scatter plots showing the correlation between RFS and distance of the altered residue from the TOP (DNA-binding surface), BOTTOM (protein pole opposite from the DNA-binding surface) and CENTER of the p53 DBD. h-j, Scatter plots showing the correlation between RFS and (h) solvent accessibility of the altered residue, (i) thermal destabilization of the variant, and (j) the conservation score of the altered residue. In h, solvent-accessible residues with nevertheless high RFS values are indicated. R248 is a DNA-contact residue, E224 and S261 are located at exon borders and affect splicing, G199 is located at the inter-dimer interface and also critical for splicing. g-j, All plots show variants as individual datapoints, kernel density estimates, and regression lines with 95% confidence intervals. ρ, Spearman correlation coefficient with p-value approximated using a two-tailed t-distribution. Source data
Extended Data Fig. 6
Extended Data Fig. 6. RFS and mutational probability.
a-d, Scatter plots of RFS versus patient count (sum of all records in the UMD, IARC/NCI, TCGA, and GENIE databases). a, Variants are colored by mutation class. Labelled in red are functionally neutral genetic variants (polymorphisms, poly; Doffe et al.). b, Missense variants colored by number of substituted nucleotides. c, Single-nucleotide missense variants colored as transition Ts (A-G, C-T) or transversion Tv (A-C, A-T, C-A, C-G) mutations. d, Single-nucleotide missense variants colored as CpG or non-CpG mutations. e-h, Violin plots showing the distribution of patient counts for the mutation types depicted in a-d stratified by RFS as RFS+ (RFS>0) or RFS- (RFS<0). n.o., not observed. Tables report the two-way ANOVA p-value and effect size (ω2) for each factor and their interaction. Selected post-hoc multiple comparison test results (Tukey) are shown directly in the plot. i-j, Scatter plots of RFS versus patient count (sum of all records in the UMD, IARC/NCI, TCGA, and GENIE databases) colored by mutational probability according to the indicated COSMIC mutational signatures (v3.3 - June 2022). SBSmean (j) denotes an averaged mutational signature calculated by weighting the most common mutational signatures based on their occurrence in the TCGA pan-cancer cohort. k and l, Violin plots comparing the distribution of patient counts for single-nucleotide substitutions stratified by RFS. k, All single-nucleotide substitutions and p-value from a two-sided Mann-Whitney test. Lines show the median and the 25% and 50% quartiles. l, Single-nucleotide substitutions binned by increasing mutational probability using the ‘SBSmean’ signature. Two-way ANOVA p-value and effect size (ω2) for each factor (‘RFS’ and ‘SBSmean bin’) and their interaction are reported in the table, indicating a strong effect of RFS on patient count mostly independent of mutational probability. Source data
Extended Data Fig. 7
Extended Data Fig. 7. Clinical variant interpretation.
a-c, Distribution of RFS values for ClinVar variants colored by pathogenicity classification. Left, stacked histograms; right, kernel density estimation plots. a, ClinVar variants with ≥1* review status. b, Missense ClinVar variants with ≥1* review status. c, ClinVar variants classified by the TP53 variant curation expert panel (VCEP). d and e, Precision-Recall (left) and Receiver-Operating Characteristic curves (right) for (d) ClinVar variants with ≥1* review status and (e) missense ClinVar variants with ≥1* review status. AUPRC and AUROC, area under the Precision-Recall and Receiver Operating Characteristic curves, respectively. Source data
Extended Data Fig. 8
Extended Data Fig. 8. Mutational probability and tumor frequency.
a, Scatter plots illustrating correlation between RFS values obtained by CRISPR mutagenesis and cDNA overexpression (Kotler et al.). Variants are colored based on their mutational probability according to the indicated COSMIC mutational signatures (v3.3 - June 2022). b, Violin plots depict the distribution of mutational probabilities among the variants located in the three main quadrants LL, LR and UR. Reported are p-values from Tukey’s post-hoc multiple comparisons tests performed after one-way ANOVA. c, Scatter plots illustrate the correlation between RFS values obtained by CRISPR mutagenesis and cDNA overexpression (Kotler et al.). Variants are colored by their frequency in patients based on the indicated mutation databases (UMD, IARC/NCI, TCGA, GENIE). Violin plots depict the distribution of variant patient counts in the three main quadrants LL, LR, and UR (p-values from one-way ANOVA and Tukey’s post-hoc multiple comparisons tests). All violin plots show the median and the 25% and 50% quartiles. Source data
Extended Data Fig. 9
Extended Data Fig. 9. Missense and synonymous mutations resulting in splice alterations.
Scatter plots comparing the abundance of missense (left panels) and synonymous (right panels) variants in the cell libraries at the level of genomic DNA and mRNA. Each dot represents the median abundance of a variant from n=3 biological replicates. Variants are colored by RFS in a, by distance from the exon border in b, substitution type in c, and patient count in d. LOF variants underrepresented at the mRNA level are individually labeled (black font for variants at the exon border, red font for variants inside the exon). Dashed line, line of identity. e-f, Intronic variant NC_000017.11: g.7673847A>C. e, Schematic depiction of splicing alterations. f, Abundance of the g.7673847A>C variant at the genomic DNA level is similar to the abundance of the aberrantly spliced mRNA. Shown is the mean ±SD of n=3 biological replicates. Source data
Extended Data Fig. 10
Extended Data Fig. 10. Aberrant splicing due to exonic SNVs causes LOF.
a-c, Impact of codon 199 variants NC_000017.11:g.7674934T>A/C/G and codon 137 variant NC_000017.11: g.7675202A>T on the anti-proliferative activity of N3a in H460 cells. Wild-type (WT), missense (R175H), and nonsense (R175X) variants are shown for comparison. a, Proliferation curves under treatment with 10 µM N3a. For the g.7674934T>A and g.7675202A>T genotypes, plots show the mean +SD of independent clones. b, Dose-response curves of N3a calculated from proliferation curves by non-linear regression of area under the curve (AUC) values. c, IC50 values with 95% confidence interval for N3a calculated from dose-response curves in b. d, Western blot demonstrating mutant p53 and p21 protein expression in independent H460 clones in the absence and presence of N3a. e and f, cDNA analysis of g.7674934T>A/C/G clones. e, Agarose gel electrophoresis of reverse transcription (RT)-PCR products. f, mRNA transcripts detected by Sanger sequencing of RT-PCR amplicons. g, Western blot demonstrating reduced size of the p53 protein in H460 clones with the g.7675202A>T genotype. h and i, cDNA analysis of g.7675202A>T clones. h, Agarose gel electrophoresis of RT-PCR products. i, Sequencing analysis of RT-PCR amplicons showing an in-frame deletion of 12 amino acids. j, Quantitative RT-PCR specific for the regularly spliced p53 and CDKN1A/p21 mRNA in H460 g.7675202A>T cells transfected with splice-switching oligonucleotide (SSO) and treated with N3a as indicated. Shown is the mRNA expression relative to untreated as mean±SD (n=3 biological replicates); two-way ANOVA with Tukey’s multiple comparisons test. Source data

References

    1. Kaiser, A. M. & Attardi, L. D. Deconstructing networks of p53-mediated tumor suppression in vivo. Cell Death Differ.25, 93–103 (2018). - PMC - PubMed
    1. Donehower, L. A. et al. Integrated analysis of TP53 gene and pathway alterations in the cancer genome atlas. Cell Rep.28, 1370–1384.e1375 (2019). - PMC - PubMed
    1. Joerger, A. C., Stiewe, T. & Soussi, T. TP53: the unluckiest of genes? Cell Death Differ.10.1038/s41418-024-01391-6 (2024). - PMC - PubMed
    1. Sabapathy, K. & Lane, D. P. Therapeutic targeting of p53: all mutants are equal, but some mutants are more equal than others. Nat. Rev. Clin. Oncol.15, 13–30 (2018). - PubMed
    1. Stiewe, T. & Haran, T. E. How mutations shape p53 interactions with the genome to promote tumorigenesis and drug resistance. Drug Resist. Updat.38, 27–43 (2018). - PubMed

MeSH terms

Substances