. 2025 Jan 7;21(1):e1012725.
doi: 10.1371/journal.pcbi.1012725. eCollection 2025 Jan.

Prioritization of causal genes from genome-wide association studies by Bayesian data integration across loci

Affiliations

Prioritization of causal genes from genome-wide association studies by Bayesian data integration across loci

Zeinab Mousavi et al. PLoS Comput Biol. .

Abstract

Motivation: Genome-wide association studies (GWAS) have identified genetic variants, usually single-nucleotide polymorphisms (SNPs), associated with human traits, including disease and disease risk. These variants (or causal variants in linkage disequilibrium with them) usually affect the regulation or function of a nearby gene. A GWAS locus can span many genes, however, and prioritizing which gene or genes in a locus are most likely to be causal remains a challenge. Better prioritization and prediction of causal genes could reveal disease mechanisms and suggest interventions.

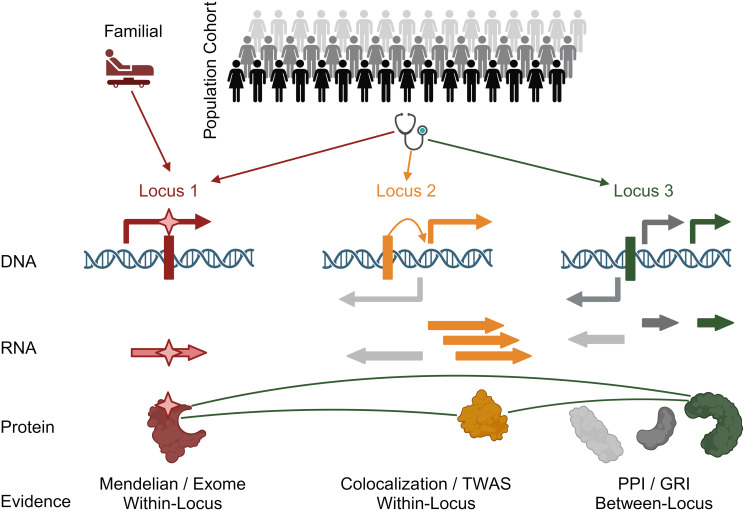
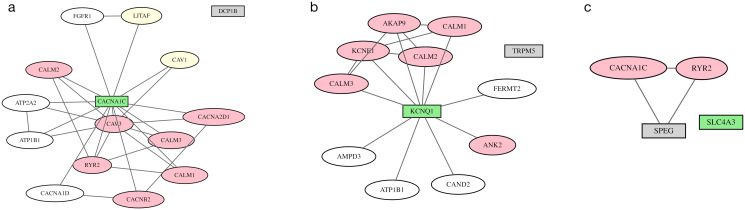
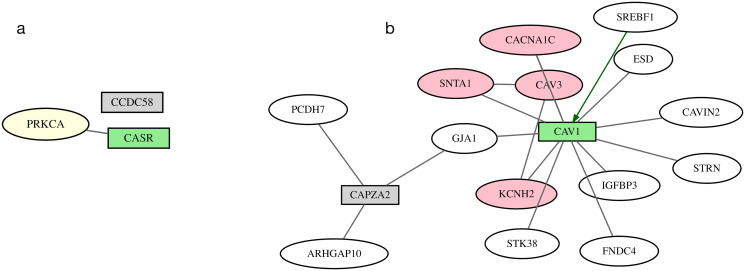
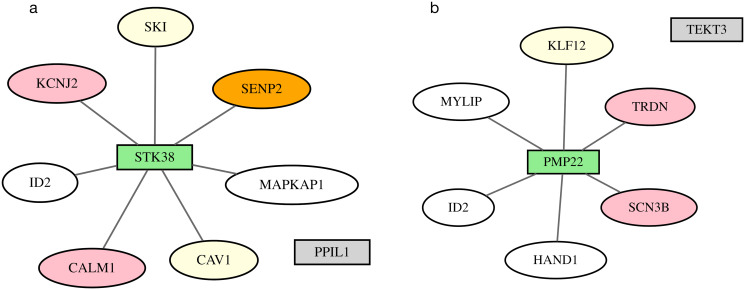
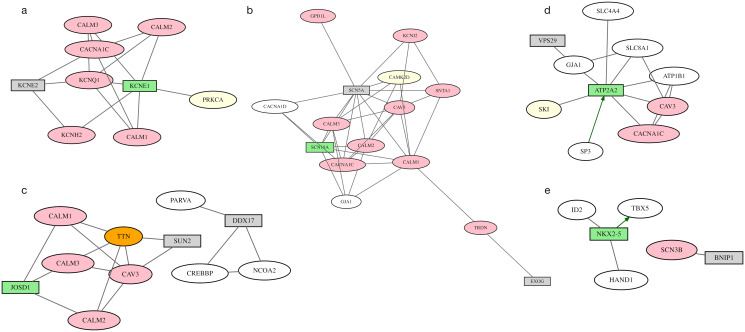
Results: We describe a new Bayesian method, termed SigNet for significance networks, that combines information both within and across loci to identify the most likely causal gene at each locus. The SigNet method builds on existing methods that focus on individual loci with evidence from gene distance and expression quantitative trait loci (eQTL) by sharing information across loci using protein-protein and gene regulatory interaction network data. In an application to cardiac electrophysiology with 226 GWAS loci, only 46 (20%) have within-locus evidence from Mendelian genes, protein-coding changes, or colocalization with eQTL signals. At the remaining 180 loci lacking functional information, SigNet selects 56 genes other than the minimum distance gene, equal to 31% of the information-poor loci and 25% of the GWAS loci overall. Assessment by pathway enrichment demonstrates improved performance by SigNet. Review of individual loci shows literature evidence for genes selected by SigNet, including PMP22 as a novel causal gene candidate.


Conflict of interest statement

◦ I have read the journal’s policy and the authors of this manuscript have the following competing interests: JSB is a founder of and advisor to Neochromosome, Inc., and its parent company Opentrons Labworks, Inc. JSB is an advisor to Dextera Biosciences, Inc, has equity in Opentrons and equity and vested options in Dextera.

Figures

Fig 1
Fig 1. SigNet overview.
Population cohorts (top) are genotyped and phenotyped in a genome-wide association study (GWAS). The study identifies genetic variants, usually single-nucleotide polymorphisms (SNPs, indicated by vertical bars overlayed on double-stranded DNA), that are associated with the phenotype at genome-wide significance. These SNPs occur throughout the genome, and each SNP defines a genomic region, or locus, that likely contains a gene with a causal relationship with the phenotype. Each locus may contain several genes (arrows above and below the double helix indicate genes on the positive and negative strand), and three loci are depicted. The SigNet method integrates within-locus and between-locus information from DNA-based, RNA-based, and protein-based evidence to select the most likely causal gene at each locus. Locus 1 (red): a SNP in a protein-coding region may change the amino acid sequence of the encoded protein, indicated by the star overlaying the gene symbol and protein. Similarly, a gene in the region may be known to cause a Mendelian disease related to the GWAS phenotype, indicated as a familial case. At this locus, the red gene is selected as most likely. Locus 2 (orange): a SNP may affect the transcriptional regulation of a nearby gene, indicated by the orange arrow from the SNP to the gene transcription start site. The corresponding mRNA transcript may have altered abundance, indicated by the multiple transcripts. These SNPs are expression quantitative trait loci (eQTL), and colocalization of a GWAS association with an eQTL association provides evidence for the most likely causal gene. Methods such as transcriptome-wide association studies (TWAS) provide a similar type of evidence. Locus 3 (green): Many loci are information-poor, with no within-locus evidence and a default approach of selecting the gene closest to the SNP. The SigNet method adds between-locus information using a probability model for the network formed by protein-protein interactions and gene-regulatory interaction of the genes selected at each locus. The green gene product interacts with proteins encoded by genes selected at the other loci, and its causal likelihood is calculated to be higher than the other genes in the locus, including the gene closest to the GWAS SNP.
Fig 2
Fig 2. Selection frequency: Fraction of SigNet runs where a gene was selected as the active gene within its locus, averaged over 100 runs.
Gene weight: Bayesian scores expressed as gene weights, as defined by Eq (41), averaged over final values from the same 100 runs.
Fig 3
Fig 3. Distribution of the signed distance from a GWAS SNP to the transcription start site of the active gene selected at each locus.
Distributions are shown for genes selected by a minimum distance criterion, by best guess initialization, and by SigNet. Learned distribution: exponential distribution with converged distance parameter 161.3 kb used by SigNet.
Fig 4
Fig 4. Density plot of gene scores from SigNet compared with PoPS for the PoPS phenotypes AFib (left) and Cardio (right).
More saturated colors indicate higher density, with contour lines from kernel density estimation.
Fig 5
Fig 5. GWAS loci with Mendelian evidence.
SigNet selects the gene with Mendelian evidence (green rectangle) over the closest gene in the locus to a GWAS SNP (gray rectangle). Pink ovals represent genes with Mendelian evidence; yellow ovals represent colocalized genes; white ovals represent information-poor genes; and gray lines represent protein-protein interactions. Networks are shown for three individual loci, highlighting the gene selected by SigNet: (a) CACNA1C, (b) KCNQ1, (c) SLC4A3.
Fig 6
Fig 6. GWAS loci with exome-chip or colocalization evidence.
SigNet selects the gene with exome-chip or colocalization evidence (green rectangle) over the closest gene in the locus to a GWAS SNP (gray rectangle). Pink ovals represent genes with Mendelian evidence; white ovals represent information-poor genes; gray lines represent protein-protein interactions; and green arrow represents gene-regulatory interaction. Networks are shown for two individual loci, highlighting the gene selected by SigNet: (a) CASR, (b) CAV1.
Fig 7
Fig 7. GWAS loci with no functional evidence.
SigNet selects the gene (green rectangle) based on network connectivity with genes selected at other loci, over the closest gene in the locus to a GWAS SNP (gray rectangle). Pink ovals represent genes with Mendelian evidence; orange ovals represent exome-chip evidence; yellow ovals represent colocalized genes; white ovals represent information-poor genes; and gray lines represent protein-protein interactions. Networks are shown for loci containing (a) STK38, (b) PMP22.
Fig 8
Fig 8. GWAS loci where multiple genes may be causal.
SigNet selects the gene (green rectangle) based on within locus and across loci evidence. SigNet+ augments the selection with other genes in the locus that have functional evidence (gray rectangle). Pink ovals represent genes with Mendelian evidence; orange ovals represent exome-chip evidence; yellow ovals represent colocalized genes; white ovals represent information-poor genes; gray lines represent protein-protein interactions; and green arrows represent gene-regulatory interactions. Networks are shown for loci containing (a) KCNE1, (b) SCN10A, (c) JOSD1, (d) ATP2A2, (e) NKX2–5.

Similar articles

References

    1. Lappalainen T, MacArthur DG. From variant to function in human disease genetics. Science. 2021;373(6562):1464–1468. doi: 10.1126/science.abi8207 - DOI - PubMed
    1. Li X, Yung G, Zhou H, Sun R, Li Z, Hou K, et al.. A multi-dimensional integrative scoring framework for predicting functional variants in the human genome. The American Journal of Human Genetics. 2022;109(3):446–456. doi: 10.1016/j.ajhg.2022.01.017 - DOI - PMC - PubMed
    1. McKusick V. Online Mendelian Inheritance in Man, OMIM. McKusick-Nathans Institute for Genetic Medicine, Johns Hopkins University (Baltimore, MD) and National Center for Biotechnology Information, National Library of Medicine (Bethesda, MD), 2000. World Wide Web URL: https://omim.org. 2009;.
    1. Consortium GTE, et al.. The GTEx Consortium atlas of genetic regulatory effects across human tissues The Genotype Tissue Expression Consortium. Science. 2019;369(6509):1318–30. doi: 10.1126/science.aaz1776 - DOI - PMC - PubMed
    1. Hormozdiari F, Van De Bunt M, Segre AV, Li X, Joo JWJ, Bilow M, et al.. Colocalization of GWAS and eQTL signals detects target genes. The American Journal of Human Genetics. 2016;99(6):1245–1260. doi: 10.1016/j.ajhg.2016.10.003 - DOI - PMC - PubMed

MeSH terms

LinkOut - more resources