. 2025 Jan 7;135(5):e180893.
doi: 10.1172/JCI180893.

Tumor-initiating cells escape tumor immunity via CCL8 from tumor-associated macrophages in mice

Affiliations

Tumor-initiating cells escape tumor immunity via CCL8 from tumor-associated macrophages in mice

Shuang Chen et al. J Clin Invest. .

Abstract

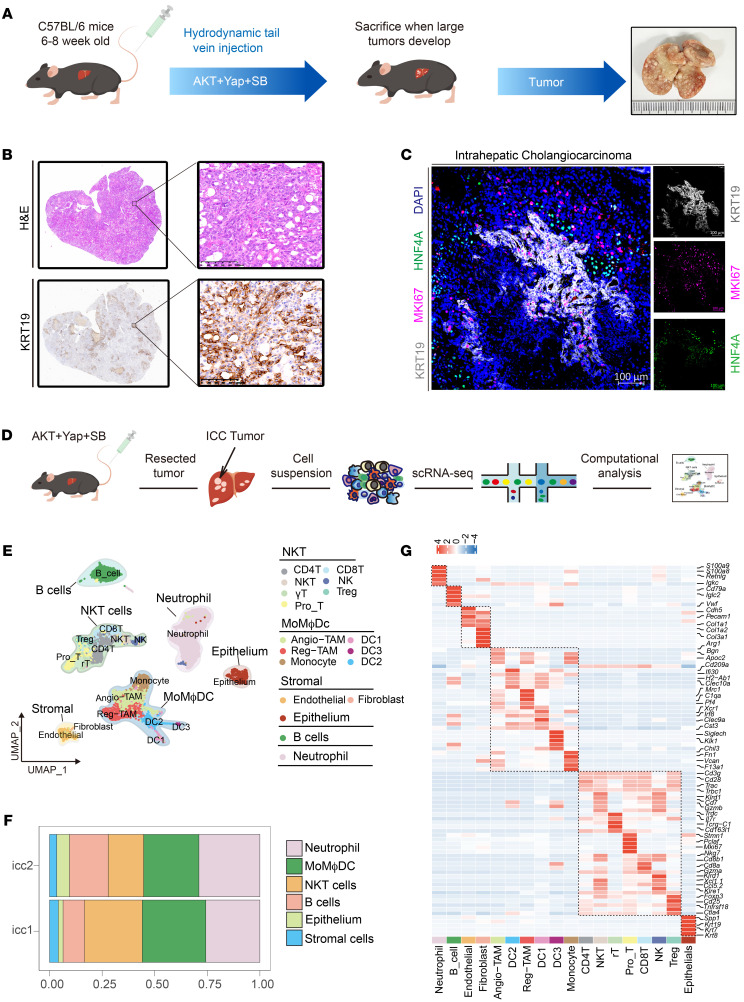
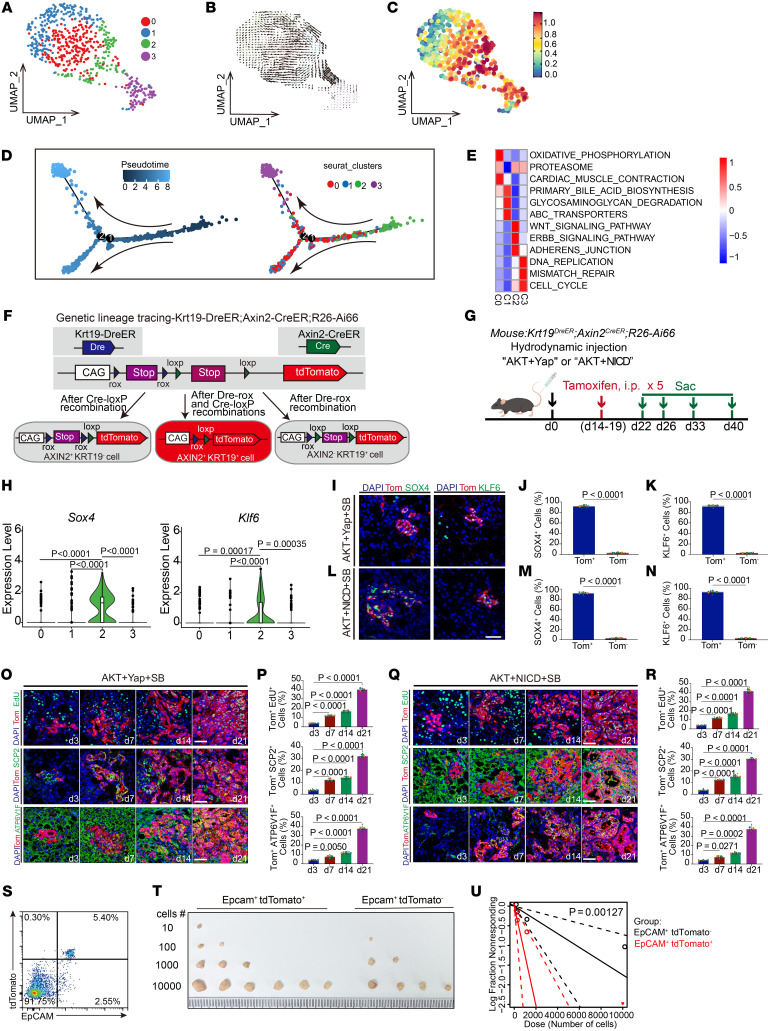
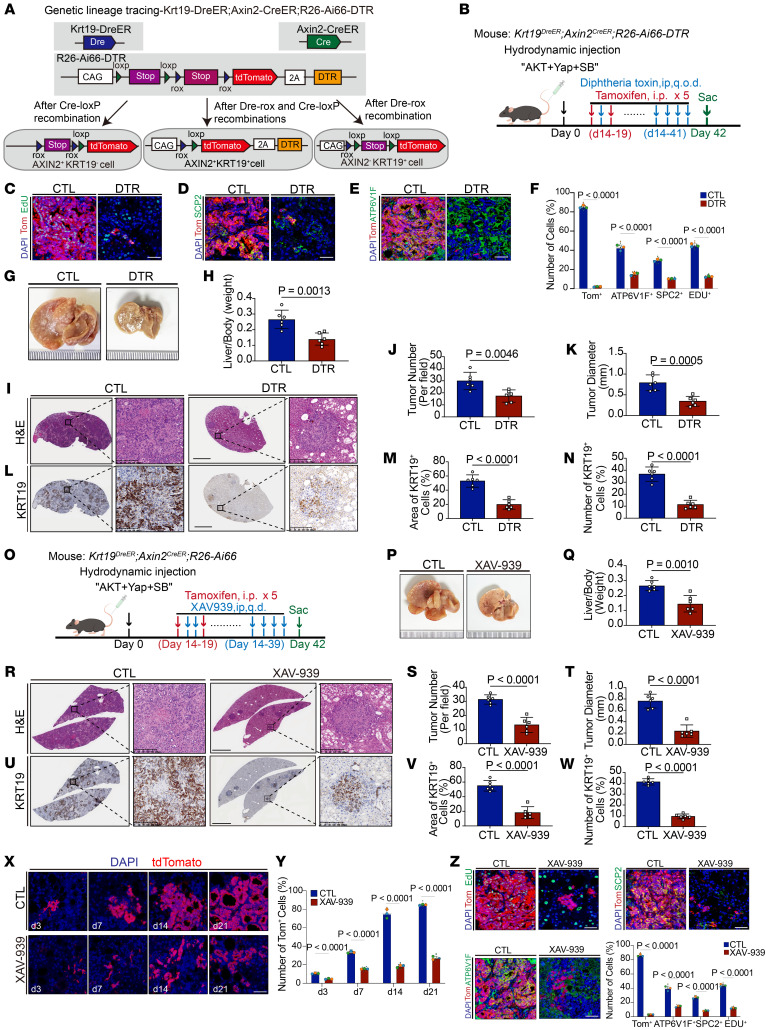
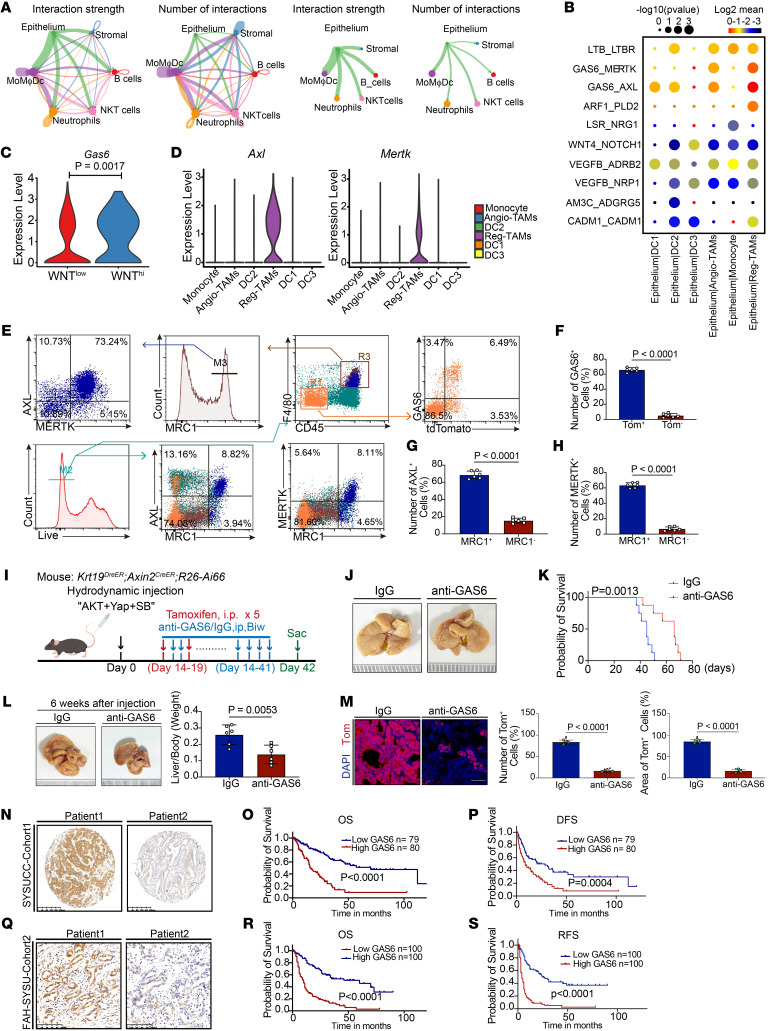
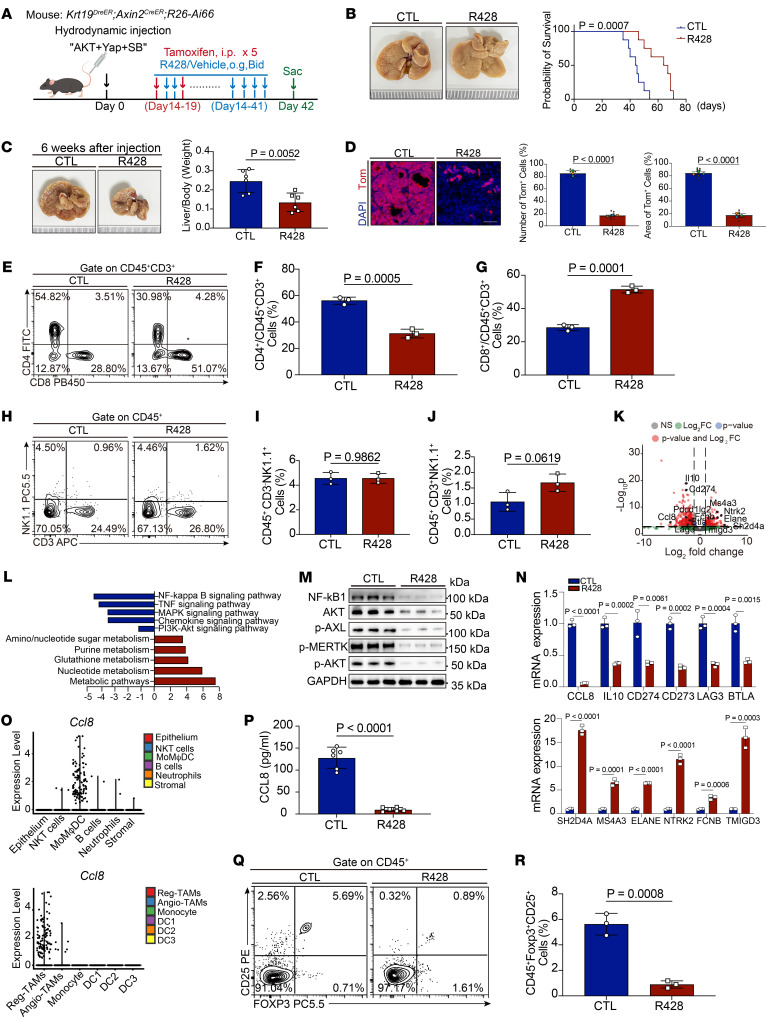
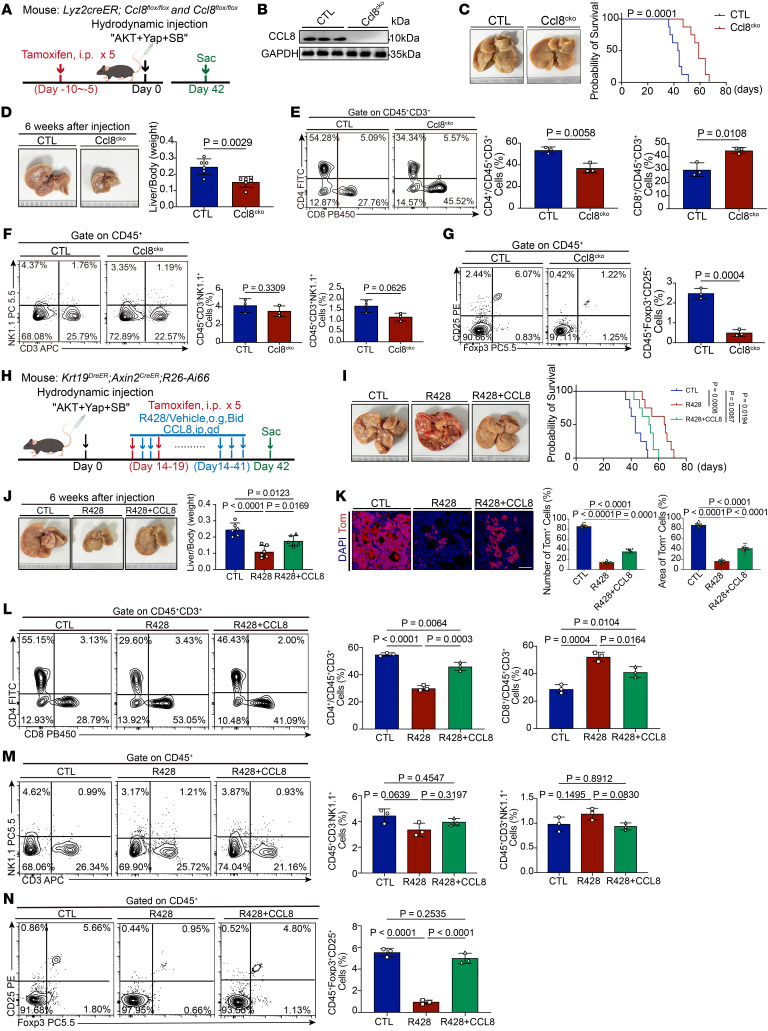
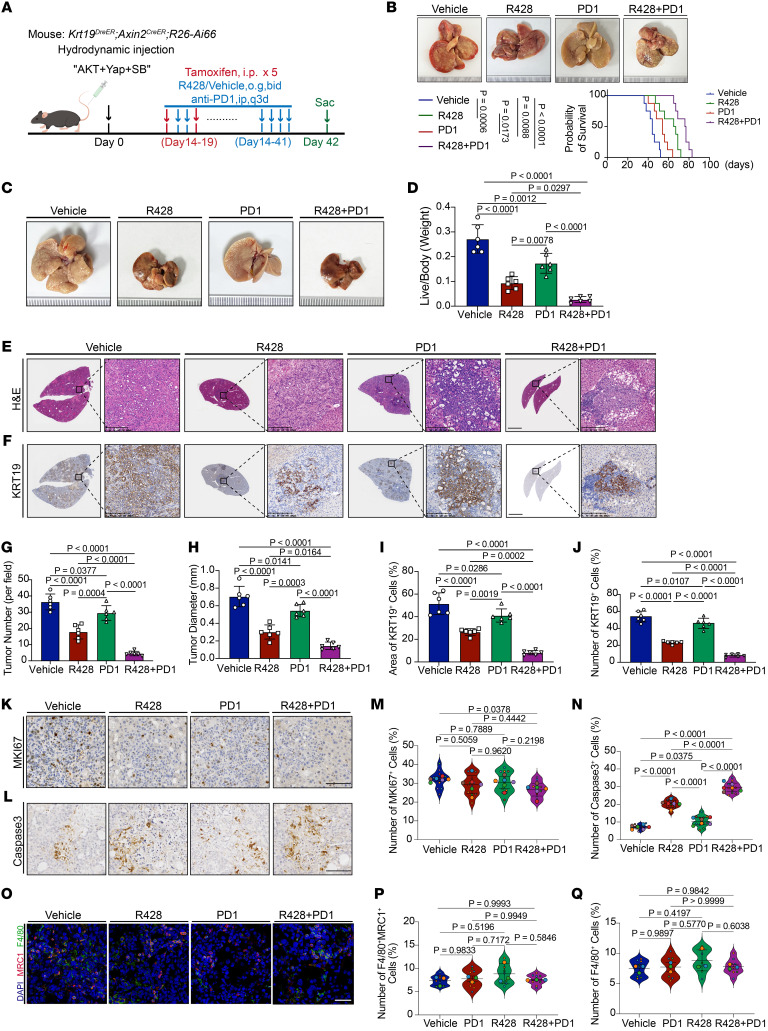
Tumor-initiating cells (TICs) play a key role in cancer progression and immune escape. However, how TICs evade immune elimination remains poorly characterized. Combining single-cell RNA-Seq (scRNA-Seq), dual-recombinase-based lineage tracing, and other approaches, we identified a WNT-activated subpopulation of malignant cells that act as TICs in vivo. We found intensive reciprocal interactions between TICs and immune-regulatory tumor-associated macrophages (Reg-TAMs) via growth arrest-specific 6/AXL receptor tyrosine kinase/MER proto-oncogene, tyrosine kinase (GAS6/AXL/MERTK) signaling pathways, which facilitated the immune escape of TICs. In this study, we used chemical inhibitors and Axl/Mertk conditional double-KO (cDKO) mice to demonstrate that inhibiting the interaction between TIC-derived GAS6 and AXL/MERTK in Reg-TAMs reactivated antitumor immune responses. We identified CCL8 as a critical mediator of the GAS6/AXL/MERTK pathway, primarily by inhibiting Treg infiltration into the tumor. Furthermore, the AXL/MERTK signaling blockade sensitized tumor cells to anti-programmed cell death 1 (anti-PD-1) treatment. Thus, we elucidated a detailed mechanism by which TICs evade tumor immunity, providing insights into strategies to eradicate TICs that escape conventional immunotherapy.

Keywords: Cancer immunotherapy; Oncology.


Figures

Figure 1
Figure 1. Heterogeneity of cells in mouse ICC sample.
(A) Schematic of mouse ICC induction workflow. Mice were injected with AKT/YAP/SB plasmid via the tail vein, and tumor-bearing mice were sacrificed when large tumors developed (n = 3). (B) Representative images of H&E and KRT19 IHC staining of liver sections from ICC mice (n = 3 mice). Scale bars: 100 μm. (C) Opal/TSA multicolor IF staining for anti-KRT19, anti-MKI67, and anti-HNF4A antibodies; nuclei are stained with DAPI (blue) (n = 3 mice). Scale bar: 100 μm. (D) Scheme of the workflow for ICC cell isolation and single-cell RNA-Seq. (E) UMAP of single-cell clusters from mouse ICC tumor tissues (n = 2), colored by cluster. (F) Proportions of single-cell clusters in each sample. (G) Heatmap of signature genes for 18 cell clusters.
Figure 2
Figure 2. WNT-activated cells constitute a TIC population in mouse ICC.
(A) UMAP plot showing 4 epithelial cell subclusters. (B) RNA velocity–inferred developmental trajectory of epithelial cells. (C) UMAP plots showing the distribution of CytoTRACE scores for epithelial cells. Higher scores indicate higher stemness. (D) Monocle pseudotime trajectory showing cell differentiation of 4 epithelial cell subclusters. (E) Heatmap of GSVA-enriched pathways in epithelial cell clusters. (F) Schematic of lineage tracing. (G) Experimental strategies for lineage tracing of AXIN2+KRT19+ epithelial cells in ICC mice. d0, day 0. (H) Violin plots showing Sox4 and Klf6 expression among epithelial cell subclusters. (I and L) Representative fluorescence images of SOX4 (green) and KLF6 (green) staining and Tom+ cells (red) in ICC tumors. Nuclei are stained with DAPI (blue). Scale bar: 50 μm. (J, K, M, and N) Statistical analysis of SOX4+ and KLF6+ expression in Tom+/– mouse ICC cells. (O and Q) Representative fluorescence images showing EdU+ (green), SCP2+ (green), ATP6V1F+ (green), and Tom+ (red) cells in ICC after tamoxifen treatment. Nuclei are stained with DAPI (blue). Scale bars: 50 μm. (P and R) Comparison of the percentage of Tom+EdU+, Tom+SCP2+, and Tom+ATP6V1F+ cells in ICC induced for 3 days, with results shown at 7, 14, and 21 days. (S) Flow cytometry plots of EpCAM+Tom+ tumor cells that were isolated and from ICC tissues and sorted. (T and U) Tumor formation frequency of EpCAM+Tom+ and EpCAM+Tom ICC cells in vivo (T), analyzed by the single-hit model likelihood ratio test (U). Data represent the mean ± SD J, K, P and R). P values were calculated by 2-tailed, unpaired Student’s t test (H, J, K, M, and N) and 1-way ANOVA with Tukey’s multiple-comparison test (P and R).
Figure 3
Figure 3. WNT-activated cells and WNT/β-catenin signaling are responsible for murine ICC progression.
(A) Schematic of DTR-mediated ablation of KRT19+AXIN2+ cells. (B) Experimental strategy for lineage ablation of KRT19+AXIN2+ cells. Sac, sacrifice. (CE) Fluorescence staining for EdU (green, C), SCP2+ (green, D), ATP6V1F+ (green, E), and Tom+ (red) cells in ICC mice after DT treatment. Scale bars: 50 μm. (F) Quantification of Tom+, Tom+EdU+, Tom+SCP2+, and Tom+ATP6V1F+ cells in ICC mice after DT treatment. (G) Representative images of liver morphology after DT treatment. (H) Statistical analysis of liver-to-body weight ratio after DT treatment. (IN) Representative images of H&E (I) and KRT19 (L) staining of liver sections after tamoxifen and DT treatment. Scale bars: 200 μm. Statistical analyses: ICC number (J), ICC diameter (K), KRT19+ cell area (M), and KRT19+ cell number (N). (O) Experimental strategy for XAV-939 treatment in ICC mice. (P) Representative image of liver morphology after XAV-939 treatment. (Q) Statistical analysis of liver to body weight ratio after XAV-939 treatment. (RW) Representative images of H&E (R) and KRT19 (U) staining of liver sections after XAV-939 treatment. Scale bars: 200 μm. Statistical analyses: ICC number (S), ICC diameter (T), KRT19+ cell area (V), and KRT19+ cell number. (X and Y) Fluorescence images of lineage tracing at days 3, 7, 14, and 21 in ICC tumors after XAV-939 treatment, with nuclei stained with DAPI (blue). Scale bar: 50 μm (X). Quantification of Tom+ cells at these time points (Y). (Z) Fluorescence staining of EdU+, SCP2+, and ATP6V1F+ (green) and Tom+ (red) cells in ICC mice after XAV-939 treatment. Scale bars: 50 μm. Quantification of Tom+, EdU+, SCP2+, and ATP6V1F+ cells in ICC tumors (bottom right). Data represent the mean ± SD (F, H, J, K, M, N, Q, S, T, V, W, Y, and Z). P values were calculated by 2-tailed, unpaired Student’s t test for F, H, J, K, M, N, Q, S, T, V, W, Y, and Z.
Figure 4
Figure 4. GAS6 is highly expressed and plays an important role in TIC maintenance in ICC.
(A) Circle plots show interaction strength and number of interactions in cell-cell communication among 6 major clusters (left) using CellChat and between epithelial and other cells (right). Line width correlates with communication probability. (B) Dot plots depict the significance (–log10 P value) and strength (log2 mean value) of detailed ligand-receptor pairs between epithelial and other cell types analyzed by CellphoneDB. (C) Violin plot displays the Gas6 expression differences between WNThi and WNTlo epithelial cell subclusters. (D) Violin plots show Axl and Mertk expression in MoMϕDC subclusters. (EH) Flow plots (E) show Tom+GAS6+ tumor-infiltrating cells and the levels of MRC1, MERTK, and AXL expression in infiltrating Reg-TAMs. Graphs depict statistical analysis of GAS6+ in Tom+/– cells in mouse ICC (F) as well as AXL+ (G) and MERTK+ (H) expression in MRC1+/– cells in ICC. (I) Treatment strategy with anti-GAS6/IgG in ICC mice. (J) Representative liver morphology image for survival outcome analysis after anti-GAS6 treatment. (K) Kaplan-Meier OS curve for ICC mice after anti-GAS6 treatment. (L) Representative liver morphology image after 6 weeks of anti-GAS6 treatment (left) and statistical analysis of liver-to-body weight ratio (right). (M) Fluorescence images of lineage tracing (left) (scale bar: 50 μm). Statistical analysis of Tom+ cell numbers (middle), and Tom+ cell area (right) after treatment. (NS) Representative images of GAS6 staining in human ICC tissue from SYSUCC cohort 1 (N) (scale bar: 200 μm) and FAHSYSU cohort 2 (Q) (scale bar: 100 μm). Kaplan-Meier curves based on GAS6 expression in ICC: OS and DFS for SYSUCC cohort 1 (O and P), and OS and RFS for FAHSYSU cohort 2 (R and S). Data represent the mean ± SD (FH, L, and M). P value were calculated by 2-tailed,, unpaired Student’s t test (C, FH, L, and M), log-rank test (K, O, P, R, and S).
Figure 5
Figure 5. Inhibition of AXL/MERTK suppresses ICC progression and Treg numbers.
(A) Experimental strategies for R428/Vehicle treatment in ICC mice. (B) Representative liver morphology image of different treatment groups for survival outcome analysis (left). Kaplan-Meier survival curve for ICC mice after R428 treatment (right). (C) Representative image of liver morphology after R428 treatment for 6 weeks (left). Statistical analysis of liver to body weight ratio after R428 treatment (right). (D) Fluorescence images of lineage tracing after R428 treatment (left). Scale bar: 50 μm. Statistical analysis of Tom+ cell number (middle) and area (right) after treatment. (EG) Flow plots (E) and graphs of tumor-infiltrating CD4+ (F) and CD8+ (G) T cell frequency after R428 treatment. (HJ) Flow plots (H) and graphs of tumor-infiltrating NK (I) and NKT (J) cell frequency after R428 treatment. (K) Volcano plot of differentially expressed genes between R428- and vehicle-treated murine ICC Reg-TAMs, with genes meeting P < 0.01 and fold change ≥2 or ≤–2 shown in red. (L) KEGG pathway analysis of the up- and downregulated differentially expressed genes in ICC tumor cells after R428 treatment. (M) Western blot analysis of NF-κB1, AKT, p-AXL, p-MERTK, p-AKT, and GAPDH in ICC Reg-TAMs after R428 treatment. (N) qRT-PCR analysis of differentially expressed genes in ICC tumor cells after R428 treatment. (O) Dot plots showing specific expression of Ccl8 in MoMϕDC cluster (top) and Reg-TAMs (bottom). (P) ELISA showed CCL8 protein levels in ICC Reg-TAMs between R428 and vehicle treatment groups. (Q and R) Representative flow plots (Q) and Treg frequency graph (R) after R428 treatment. Data represent the mean ± SD (C, D, F, G, I, J, N, P, and R). P values were calculated by 2-tailed, unpaired Student’s t test (C, D, F, G, I, J, N, P, and R) and log-rank test (B). CTL, control.
Figure 6
Figure 6. CCL8 is the downstream mediator of AXL/MERTK signaling in Reg-TAMs.
(A) Experimental design for induction of ICC in Lyz2-CreER (Control, CTL) and Lyz2-CreER Ccl8fl/fl (Ccl8cko) mice. (B) The KO efficiency of CCL8 in Lyz2+cells was validated by Western blotting. (C) Representative liver morphology images of control and Ccl8cko mice for survival outcome analysis (left). Kaplan-Meier OS curve for control and Ccl8cko mice is shown (right). (D) Representative liver morphology images of control and Ccl8cko mice after 6 weeks of plasmid injection (left) and statistical analysis of liver-to-body weight ratio (right). (EG) Flow plots show immune cell frequencies and counts in control and Ccl8cko mice: CD4+ and CD8+ T cells (E), NK and NKT cells (F), and Tregs (G). Each plot displays cell frequencies (left) and quantitative analysis (right). (H) Experimental strategy for ICC mice using R428 alone or R428 with CCL8 (R428+CCL8). (I) Representative liver morphology image of different treatment groups for survival outcome analysis (left). Kaplan-Meier OS curve for mice with ICC in different treatment groups (right). (J) Liver morphology (left) in different treatment groups after 6 weeks of treatment and statistical analysis of liver-to-body weight ratios (right). (K) Fluorescence images (left) of lineage tracing in different treatment groups, statistical analysis of Tom+ cell number and areas (right); Scale bar: 50 μm. (LN) Flow plots (left) and graphs (right) showing frequencies of tumor-infiltrating CD4+ and CD8+ T cells (L), NK and NKT cells (M), and Tregs (N) in different treatment groups. Data represent the mean ± SD (DG and JN). P values were calculated by 2-tailed, unpaired Student’s t test (DG), 1-way ANOVA with Tukey’s multiple-comparison test (JN), and log-rank test (C and I).
Figure 7
Figure 7. R428 treatment sensitizes murine ICC cells to anti–PD-1 treatment.
(A) Experimental strategies for ICC mice with the indicated treatment. The mice were sacrificed when large tumors developed. (B) Representative liver morphology images from ICC mice under the indicated treatment for survival outcome analysis (left). The time point at which mice developed lethal tumor burden is shown. Kaplan-Meier OS curve for mice with ICC subjected to the indicated treatment. P values were calculated by log-rank test. (C and D) Representative images of whole liver morphology from ICC mice subjected to the indicated treatment. Statistical analysis of liver-to-body weight ratio from ICC mice with the indicated treatment. Values represent the mean ± SD from 6 independent biological replicates (n = 6 mice). P values were calculated by 1-way ANOVA with Tukey’s multiple-comparison test. (EJ) Representative images of H&E (E) and KRT19 (F) staining of liver sections from ICC mice under different treatments. Scale bars: 200 μm. Statistical analyses of ICC tumor number (G), ICC tumor diameter (H), KRT19+ area (I), and KRT19+ cells (J) in different treatment groups. Values represent the mean ± SD from 6 independent biological replicates (n = 6 mice). P values were calculated by 1-way ANOVA with Tukey’s multiple-comparison test. (KN) Representative images of MKI67 (K) and active caspase 3 (L) staining of liver sections from ICC mice under the indicated treatments. Scale bars:100 μm. Statistical analyses of MKI67+ cells (M) and active caspase 3+ cells (N). Values represent the mean ± SD from 6 independent biological replicates (n = 12 fields from 6 mice). P values were calculated by 1-way ANOVA with Tukey’s multiple-comparison test. (OQ) Fluorescence staining for F4/80 (green) and MRC1 (red) expression in liver sections from ICC mice under the indicated treatments. Scale bar: 50 μm (O). (P and Q) Statistical analyses of F4/80+MRC1+ cells and F4/80+ cells. Data represent the represent the mean ± SD from 3 independent experiments (n = 9 fields from 3 mice). P values were calculated by 1-way ANOVA with Tukey’s multiple-comparison test.

Similar articles

Cited by

References

    1. Rizvi S, et al. Cholangiocarcinoma – evolving concepts and therapeutic strategies. Nat Rev Clin Oncol. 2018;15(2):95–111. doi: 10.1038/nrclinonc.2017.157. - DOI - PMC - PubMed
    1. Banales JM, et al. Cholangiocarcinoma 2020: the next horizon in mechanisms and management. Nat Rev Gastroenterol Hepatol. 2020;17(9):557–588. doi: 10.1038/s41575-020-0310-z. - DOI - PMC - PubMed
    1. Gimple RC, et al. Brain cancer stem cells: resilience through adaptive plasticity and hierarchical heterogeneity. Nat Rev Cancer. 2022;22(9):497–514. doi: 10.1038/s41568-022-00486-x. - DOI - PubMed
    1. Wu HJ, Chu PY. Role of cancer stem cells in cholangiocarcinoma and therapeutic implications. Int J Mol Sci. 2019;20(17):4154. doi: 10.3390/ijms20174154. - DOI - PMC - PubMed
    1. Quintana E, et al. Efficient tumour formation by single human melanoma cells. Nature. 2008;456(7222):593–598. doi: 10.1038/nature07567. - DOI - PMC - PubMed

MeSH terms

Substances