. 2024 Dec 30;19(12):e0315951.
doi: 10.1371/journal.pone.0315951. eCollection 2024.

The effects of plant density and duration of vegetative growth phase on agronomic traits of medicinal cannabis (Cannabis sativa L.): A regression analysis

Affiliations

The effects of plant density and duration of vegetative growth phase on agronomic traits of medicinal cannabis (Cannabis sativa L.): A regression analysis

Torsten Schober et al. PLoS One. .

Abstract

Empirical data on the effect of plant density (PD) and length of the vegetative phase (DVP) on plant growth, yield, and cannabinoid concentration of medicinal cannabis (Cannabis sativa L.) are still scarce, leading to a lack of specific cultivation recommendations. We conducted two greenhouse experiments to investigate the effect of PD in the range of 12-36 plants m-2 (D-trial) and DVP in the range of 1-4 weeks (V-trial) on plant morphology, biomass growth of individual plant organs, and CBD concentration of individual inflorescence fractions. Empirical models for the relationships between the investigated plant traits and PD/DVP were created using linear regression analysis preceded by a lack-of-fit test. An increase in PD led to a linear decrease in inflorescence yield per plant (p = 0.02), whereas a positive linear relationship was found for inflorescence yield (p = 0.0001) and CBD yield (p = 0.0002) per m2. Total area yields in the D-trial ranged from 119 to 247 g m-2 from lowest to highest PD. DVP showed a positive linear relationship with inflorescence yield on an individual plant (p = 0.0001) and area basis (p < 0.0001) along with most other relevant agronomic traits such as CBD production, plant size and lateral shoot length. Total area yields in the V-trial ranged from 295 to 571 g m-2 from lowest to highest DVP. The yield increase could be linked to the increased inflorescence number per plant rather than inflorescence size. In contrast to expectations, neither PD nor DVP had significant effects on the cannabinoid concentration gradient from upper to lower canopy layers. CBD concentrations in inflorescences from lower canopy layers were reduced by 23% in the V-trial and 46% in the D-trial. However, with increasing PD, the proportion of higher-concentrated inflorescence fractions from upper canopy layers increased from 46% to 68%, while an extension of DVP shifted this proportion only marginally from 45% to 50%. In the context of standardized production, we therefore advocate high-density production systems that increase the proportion of desired inflorescence fractions from upper canopy layers.


Conflict of interest statement

The authors have declared that no competing interests exist.

Figures

Fig 1
Fig 1. Setup on a greenhouse table for the four densities tested in the density trial, exemplary for replicate 1.
The black rectangle represents the table. The colored circles show the positions of the plants. Black circles show the center plants that were used for measurements.
Fig 2
Fig 2. Experimental design for the trial to test the effects of the duration of the vegetative phase (V-trial).
Fig 3
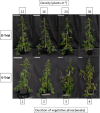
Fig 3. Exemplary plants at final harvest for the density trial (D-trial) trial of increasing duration of vegetative growth phase (V-trial).
Scale = 15 cm.
Fig 4
Fig 4
Scatter plots of the linear regression for the relationship between plant density and A) dry leaf matter, B) dry stem matter, C) dry yield, and D) CBD yield in dependence on the position at the upper and lower plant half. Point symbols indicate the mean values for the respective plant halves. Error bars indicate the estimated standard error of the mean (n = 3). Dashed lines show the fitted linear regression models for each plant half. p-values indicate wether the estimated slope term was significantly different from zero.
Fig 5
Fig 5
Scatter plots of the linear regression for the relationship between duration of vegetative phase and A) dry leaf matter, B) dry stem matter, C) dry yield, and D) CBD yield in dependence on the position at upper and lower plant half. Point symbols indicate the mean values for the respective plant halves. Error bars indicate the estimated standard error of the mean (n = 3). Dashed lines show the fitted linear regression models for each plant half. p-values indicate wether the estimated slope term was significantly different from zero.
Fig 6
Fig 6
Scatter plots of the linear regression for the relationship between the proportion of individual plant organs in the total biomass with A) plant density and B) duration of the vegetative phase. Point symbols indicate the mean values for the respective plant organs. Error bars indicate the estimated standard error of the mean (n = 3). Dashed lines show the fitted linear regression models for each plant organ based on the separate regression analyses. For A): p-values result from the global F-test for the fixed effect of plant density. For B): The p-values indicate whether the estimated slope terms of the final harvest are significantly different from zero.
Fig 7
Fig 7. Scatter plots of the linear regression for the relationship between the duration of the vegetative phase and the average mass of single inflorescences.
Point symbols indicate the mean values for the respective plant organs. Error bars indicate the estimated standard error of the mean (n = 3). Dashed lines show the fitted linear regression models for the inflorescence fractions of the main apical inflorescence (MAI) and axillary inflorescences of the upper and lower plant half. The p-values indicate whether the estimated slope terms of the final harvest are significantly different from zero.
Fig 8
Fig 8
Scatter plots of the relationship between plant density and A) maximum photosynthetic rate (Amax), B) specific leaf area (SLA), C) red/far-red ratio, and D) fraction intercepted light. Point symbols show the estimated means for the respective plants, grown under densities of 12, 16, 24, and 36 plants m-2. Error bars indicate the estimated standard error of the mean (n = 3). For A), B), C): Dashed lines show the fitted linear regression models in dependence on A) the uppermost fully developed leaf (upper) and uppermost leaf of the lower plant half (lower), B) leaves of upper and lower plant half, and C) measurements at medium canopy height (middle) and pot height (bottom). The p-values indicate whether the estimated slope terms are significantly different from zero. For D): Dashed lines show the fitted logistic functions for the tested plant densities.
Fig 9
Fig 9
Scatter plots of the linear regression for the relationship between duration of the vegetative growth phase and A) total plant biomass per square meter at final harvest B) leaf area index (LAI) at third harvest, C) dry yield per square meter at final harvest, and D) CBD yield per square meter at final harvest. Point symbols show the estimated means for the respective plants, grown in the vegetative phase for 1,2,3, and 4 weeks. Error bars indicate the estimated standard error of the mean (n = 3). The solid line shows the fitted linear regression model. The p-values indicate whether the estimated slope terms of the final harvest are significantly different from zero.
Fig 10
Fig 10
Scatter plots of the linear regression for the relationship between plant density and A) total plant biomass per square meter B) leaf area index (LAI), C) dry yield per square meter, and D) CBD yield per square meter. Point symbols show the estimated means for the respective plants, grown under densities of 12, 16, 24, and 36 plants m-2. Error bars indicate the estimated standard error of the mean (n = 3). The solid line shows the fitted linear regression model. p-values result from the global F-test for the fixed effect of plant density.

Similar articles

References

    1. Flores-Sanchez IJ, Verpoorte R. Secondary metabolism in cannabis. Phytochem Rev. 2008; 7:615–39. doi: 10.1007/s11101-008-9094-4 - DOI
    1. Potter DJ. A review of the cultivation and processing of cannabis (Cannabis sativa L.) for production of prescription medicines in the UK. Drug Test Anal. 2014; 6:31–8. Epub 2013/09/30. doi: 10.1002/dta.1531 . - DOI - PubMed
    1. Bolchi C, Pallavicini M, Casagni E, Vieira de Manincor E, Gambaro V, Dei Cas M, et al.. Development and Early Identification of Cannabis Chemotypes during the Plant Growth: Current Analytical and Chemometric Approaches. Anal Sci. 2021; 37:1665–73. Epub 2021/07/23. doi: 10.2116/analsci.21R004 . - DOI - PubMed
    1. Burgel L, Hartung J, Schibano D, Graeff-Hönninger S. Impact of Different Phytohormones on Morphology, Yield and Cannabinoid Content of Cannabis sativa L. Plants (Basel). 2020; 9. Epub 2020/06/08. doi: 10.3390/plants9060725 . - DOI - PMC - PubMed
    1. Chandra S, Lata H, ElSohly MA, Walker LA, Potter D. Cannabis cultivation: Methodological issues for obtaining medical-grade product. Epilepsy Behav. 2017; 70:302–12. Epub 2017/02/13. doi: 10.1016/j.yebeh.2016.11.029 . - DOI - PubMed

LinkOut - more resources