. 2024 Dec 30;20(12):e1012802.
doi: 10.1371/journal.ppat.1012802. eCollection 2024 Dec.

The proteomic content of Varroa destructor gut varies according to the developmental stage of its host

Affiliations

The proteomic content of Varroa destructor gut varies according to the developmental stage of its host

Vincent Piou et al. PLoS Pathog. .

Abstract

The nutritional physiology of parasites is often overlooked although it is at the basis of host-parasite interactions. In the case of Varroa destructor, one of the major pests of the Western honey bee Apis mellifera, the nature of molecules and tissues ingested by the parasite is still not completely understood. Here, the V. destructor feeding biology was explored through artificial feeding, dissection of the mite's gut and proteomic analyses. More specifically, the proteome of guts extracted from starved mites and honey bee-fed mites was compared to highlight both the parasite proteins likely involved in food processing and the honey bee proteins actually ingested by the mite. We could identify 25 V. destructor candidate proteins likely involved in the parasite digestion. As the host developmental stages infested by the mite are diverse, we also focused on the identity and on the origin of honey bee proteins ingested by the mite when it feeds on larvae, pupae or adults. We highlighted profiles of consumed honey bee proteins and their variations throughout the V. destructor life cycle. These variations matched the ones observed in the honey bee hemolymph, showing that this tissue is an important part of the mite's diet. Based on the variations of abundance of the most consumed honey bee proteins and on their functions, the potential implication of these key candidate nutrients in V. destructor reproduction is also discussed.


Conflict of interest statement

The authors have declared that no competing interests exist.

Figures

Fig 1
Fig 1. Exploration of the Varroa destructor gut proteomic profiles between fed and starved mites.
(A) Experimental groups compared in the gut proteomic analysis of Acari proteins. Mites naturally fed on larvae, pupae or adults for 24h were compared to control starved mites that only had ingested PBS. PBS had to be added in the starved condition as V. destructor dies from desiccation under 24h if deprived of a water source [44], (B) Venn diagram showing the common number of differentially regulated Acari proteins between larva-fed and starved mites (in blue), between pupa-fed and starved mites (in violet) and between adult-fed and starved mites (in orange). The green and red arrows represent up- and down-regulation, respectively. (C) Amounts of up- and down-regulated proteins in larvae, pupae, adults or in total. For each group, analyses were run on three replicates of 4 mites’ gut pooled together (N = 3 pools of four mite’s gut per condition). Larva (https://doi.org/10.7875/togopic.2022.304) and pupa pictures (https://doi.org/10.7875/togopic.2022.305) were retrieved from the DataBase Center for Life Science and were conceived by Haru Sakai and Hiromasa Ono.
Fig 2
Fig 2. Venn diagrams of Apis spp. proteins found in both V. destructor guts and honey bee hemolymph or fat body.
(A) Venn diagram of Apis spp. proteins shared between mites that fed on spinning larvae for 24h and spinning larvae fat body or hemolymph; (B) Venn diagram of Apis spp. proteins shared between mites that fed on pink eyed pupae for 24h and pink eyed pupae fat body or hemolymph.; (C) Venn diagram of Apis spp. proteins shared between mites fed on one day old adult honey bees for 24 hours and one day old adult fat body or hemolymph. (N = 3 pools of four mite’s gut per condition and three pools of three honey bee hemolymph or fat body per condition).
Fig 3
Fig 3. Comparison of protein abundances between starved controls and honey bee-fed mites.
(A) Venn diagram of Apis spp. proteins differentially represented in the gut of honey bee-fed mites compared to starved controls that ingested PBS. (B) Barplots representing the log10 ratios of 6 of the most frequently over-represented proteins compared to the same proteins in the starved group of mites. Namely, the log10 ratios of Apolipophorin (XP_026298285.1), Hexamerin 70b precursor (NP_001011600.1), Transferrin (AAO39761.1), Vitellogenin precursor (NP_001011578.1), Larval-specific very high-density lipoprotein precursor (NP_001318046.1) and Odorant binding protein 14 precursor (NP_001035313.1) taken as an example for OBPs, are represented here. The grey dashed line represents the threshold between over- and under-representation (N = 3 pools of four mite’s gut per condition).
Fig 4
Fig 4. Venn diagrams showing the numbers of differentially represented Apis spp. proteins in guts of mites from the three honey bee-fed groups.
Abundance ratios were compared to mites that fed on (A) honey bee larvae, (B) honey bee pupa or (C) one day old adult workers (N = 3 pools of four mite’s gut per condition).
Fig 5
Fig 5. Correlations between the Apis spp. protein ratios of abundance in honey bee tissues and in V. destructor guts.
(A) Abundance ratios of larva- vs pupa-fed mites; (B) Abundance ratios of adult- vs pupa-fed mites; (C) Abundance ratios of larva- vs adult-fed mites. Ratios between honey bee stages were calculated for honey bee hemolymph, honey bee fat body and V. destructor guts. The colour scale and the numbers inside the circles indicate Kendall τ and the asterisks show the level of significance from a general Kendall correlation after Benjamini-Hochberg correction (*** = <0.001;** = <0.01; * = <0.05; 0.05<•<0.10; N = 3 pools of four mite’s gut per condition and three pools of three honey bee hemolymph or fat body per condition).
Fig 6
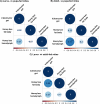
Fig 6. Workflow for the proteomic analyses data collection of mite gut contents.
Foundresses Varroa destructor were collected from brood frames and transferred in gelatine capsules and starved for 24h on a PBS solution. Four mites from the control conditions were then dissected and their gut was isolated in microcentrifuge tubes. The rest of the mites were transferred onto spinning larvae, pink-eyed pupae or one day old adult bees for 24 additional hours. Four mites per condition (fed on larvae, pupae or adults) were then dissected and their guts pooled in a loBind microcentrifuge tube. Fat body and hemolymph of honey bees of the same developmental stages were also collected and pooled by three (3) in similar tubes. The procedure was repeated three times and all tubes were stored at -40°C until further proteomic analyses. Larva (https://doi.org/10.7875/togopic.2022.304) and pupa pictures (https://doi.org/10.7875/togopic.2022.305) were retrieved from the DataBase Center for Life Science and were conceived by Haru Sakai and Hiromasa Ono.

Similar articles

Cited by

References

    1. Hite JL, Pfenning AC, Cressler CE. Starving the enemy? Feeding behavior shapes host-parasite interactions. Trends Ecol Evol. 2020;35: 68–80. doi: 10.1016/j.tree.2019.08.004 - DOI - PubMed
    1. Ferguson HM, Rivero A, Read AF. The influence of malaria parasite genetic diversity and anaemia on mosquito feeding and fecundity. Parasitology. 2003;127: 9–19. doi: 10.1017/s0031182003003287 - DOI - PubMed
    1. Krasnov BR, Sarfati M, Arakelyan MS, Khokhlova IS, Burdelova NV, Degen AA. Host specificity and foraging efficiency in blood-sucking parasite: Feeding patterns of the flea Parapulex chephrenis on two species of desert rodents. Parasitol Res. 2003;90: 393–399. doi: 10.1007/s00436-003-0873-y - DOI - PubMed
    1. Zhou S, Lu Y, Chen J, Pan Z, Pang L, Wang Y, et al.. Parasite reliance on its host gut microbiota for nutrition and survival. ISME J. 2022;16: 2574–2586. doi: 10.1038/s41396-022-01301-z - DOI - PMC - PubMed
    1. Gómez-Díaz E, González-Solís J. Trophic structure in a seabird host-parasite food web: Insights from stable isotope analyses. PLoS ONE. 2010;5. doi: 10.1371/journal.pone.0010454 - DOI - PMC - PubMed

LinkOut - more resources