. 2024 Dec 30;20(12):e1012810.
doi: 10.1371/journal.ppat.1012810. eCollection 2024 Dec.

Cascading expression of ApiAP2 transcription factors controls daughter cell assembly in Toxoplasma gondii

Affiliations

Cascading expression of ApiAP2 transcription factors controls daughter cell assembly in Toxoplasma gondii

Maanasa Bhaskaran et al. PLoS Pathog. .

Abstract

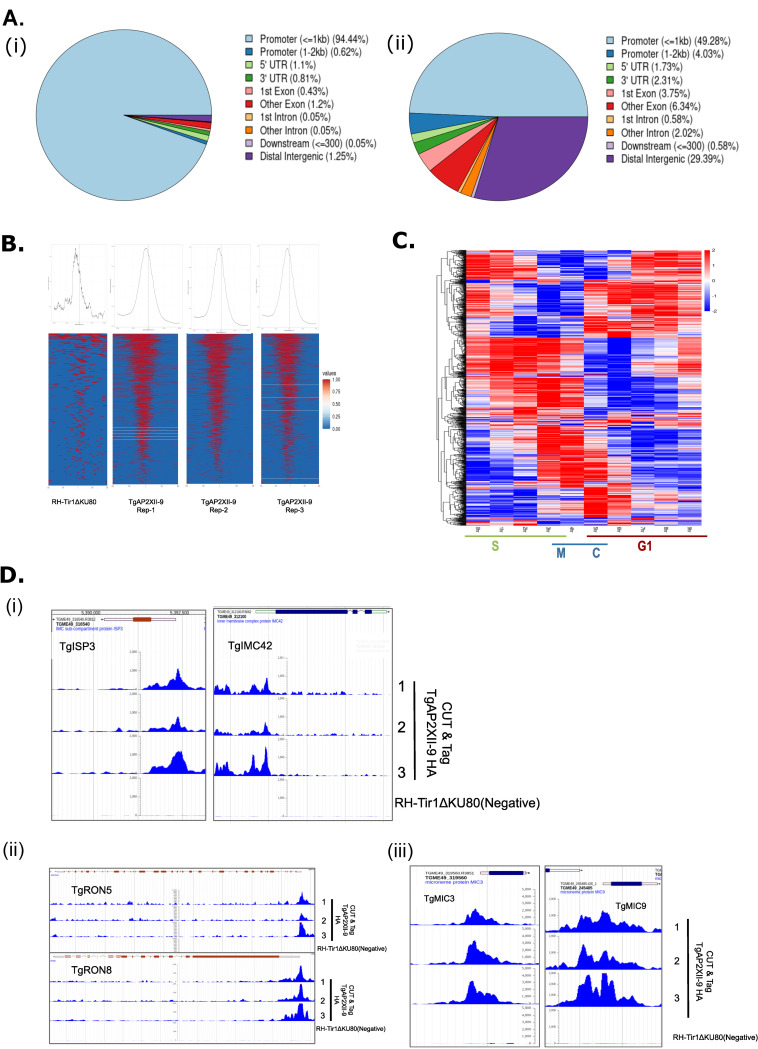
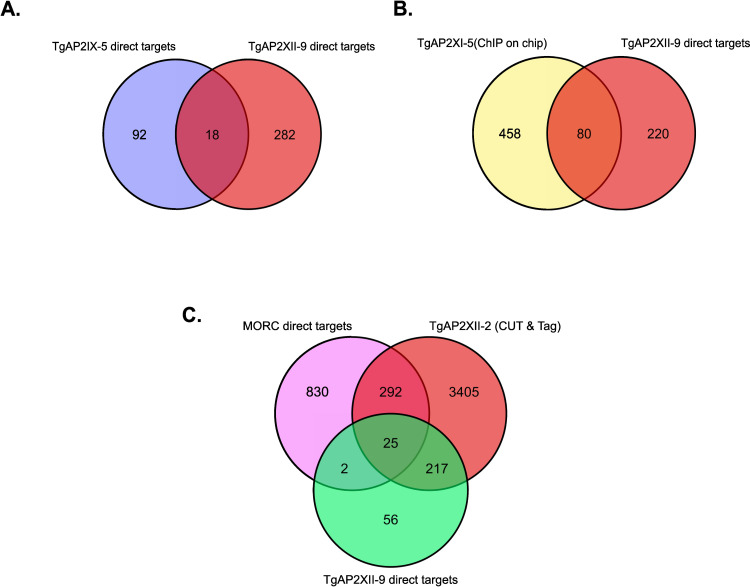
Pathogenesis of Toxoplasma gondii in the intermediate host is based on the tachyzoite ability to divide rapidly to produce significant amount of daughter cells in a reduce time frame. The regulation of the cell-cycle specific expression program is therefore key to their proliferation. Transcriptional regulation has a crucial role in establishing this expression program and transcription factors regulates many aspects of tachyzoite cell cycle. We explored the role of two ApiAP2 transcription factors, TgAP2XII-9 and TgAP2III-2, during the cell cycle of the tachyzoite form. While TgAP2III-2 has only a minor impact on the tachyzoite proliferation, we show that TgAP2XII-9 regulates many aspects of the cell cycle including the proper assembly of the daughter cells inner membrane complex and temporal expression of many virulence genes. Creation of a double mutant strain for TgAP2XII-9 and TgAP2III-2 shows that TgAP2XII-9 had a prominent role during daughter cell assembly. Using transcriptomics and Cut&Tag, we demonstrate that TgAP2XII-9 mainly acts through the transcriptional control of at least 300 genes promoters. Interestingly, TgAP2XII-9 plays a crucial role repressing the expression of genes necessary for budding initiation and activating genes necessary for microneme de novo formation. We also explored the importance of the AP2 domain of TgAP2XII-9 demonstrating its critical role to exert its function. Therefore, we showed that TgAP2XII-9 is a crucial transcription factor which is key to daughter cell assembly post budding initiation.


Conflict of interest statement

The authors have declared that no competing interests exist.

Figures

Fig 1
Fig 1. TgAP2XII-9 and TgAP2III-2 are cell-cycle regulated and expressed during the S/M phase.
TgAP2XII-9 is essential for growth and proliferation in vitro (A, B) Western blot analysis of total protein extracts from parental and iKD TgAP2XII-9 and TgAP2III-2 strains treated with Auxin for varying durations. The blots were probed with anti-HA to detect TgAP2XII-9 and TgAP2III-2 protein levels (upper panel) and with anti-TgSortilin as a normalization control (lower panel), validating the AID system. (C, D) Cell cycle expression of TgAP2III-2 and AP2XII-9 as realized by IFA using anti-HA antibody and cell cycle markers TgCentrin1 and TgIMC1. Scale bar = 3 μm (E) Growth assay for parental and iKD TgAP2XII-9 strains with and without 24-hour auxin treatment. Statistical analysis was performed using a two-tailed Student’s t-test, with significance indicated by ***p < 0.001, *p<0.05, Data are presented as mean ± s.d. (n  =  3). (F) Plaque assay depicting proliferation and growth of Parental and iKD AP2XII-9 strains with and without auxin for 7 days. (G) Quantification of the no.of lysis plaques for parental and iKD TgAP2XII-9 strains. Statistical analysis was performed using a two-tailed Student’s t-test, with significance indicated by **p < 0.01, *p<0.05, Data are presented as mean ± s.d. (n  =  3).
Fig 2
Fig 2. TgAP2XII-9 is crucial for the proper formation of daughter parasites.
(A) Defects in the IMC formation or organization observed after 6 hours Auxin treatment as realized by IFA and confocal imaging with TgIMC1 and TgENO2; Scale bar = 5μm (B) Quantification of the IMC defect phenotype between the parental and iKD TgAP2XII-9 strains on 6hrs of auxin treatment. Statistical analysis was performed using a two-tailed Student’s t-test, with significance indicated by ***p < 0.001, data are presented as mean ± s.d. (n  =  3) (C) IFA and confocal imaging depicting the budding of iKD TgAP2XII-9 parasites and accumulation of multiple nuclei after the addition of Auxin using anti-TgIMC1 and anti-TgENO2 antibodies; scale bar = 2μm (D)(i) Quantification of percentage of vacuoles undergoing budding after 6hrs auxin treatment. Statistical analysis was performed using a two-tailed Student’s t-test, with significance indicated by **p < 0.01, data are presented as mean ± s.d. (n  =  3). (D)(ii) Quantification of percentage of vacuoles having multiple nuclei. Statistical analysis was performed using a two-tailed Student’s t-test, with significance indicated by **p < 0.01, data are presented as mean ± s.d. (n  =  3), N represents nuclei and P is parasites. (E) IFA and confocal imaging depicting the budding of parasites labelled by TgIMC3 and TgISP1; scale bar = 3 μm. (F) (i) Quantification of budding vacuoles using anti-TgISP1 after 6hrs of Auxin treatment, a two tailed Student’s Statistical analysis was performed using a two-tailed Student’s T-test, with significance indicated by ns>0.05, data are presented as mean ± s.d. (n  =  3). (F) (ii) Quantification of budding vacuoles using anti-TgISP1 after 18hrs of Auxin treatment, a two tailed Student’s Statistical analysis was performed using a two-tailed Student’s t-test, with significance indicated by ns>0.05, **p < 0.01 data are presented as mean ± s.d. (n  =  3). (F) (iii) Quantification of budding vacuoles using anti-TgIMC3 after 6hrs of Auxin treatment, Statistical analysis was performed using a two-tailed Student’s t-test, with significance indicated by **p < 0.01, *p<0.05, data are presented as mean ± s.d. (n  =  3). (G) Expansion microscopy depicting defects in the IMC (circled) and deformations in the cytoskeleton (panel (iv)). The parasite IMC (IMC3, red) and cytoskeleton (acetylated tubulin, green) were labelled as well as the nucleus by DAPI (blue). Parasite without nucleus(panel(iii)) and a parasite bearing multiple nuclei(panel(iii)) are indicated by white arrows. Scale bar = 5 μm.
Fig 3
Fig 3. TgAP2XII-9 regulates the expression of various cell cycle-regulated genes.
(A) Volcano plot of differentially expressed genes from RNA-sequencing analysis of TgAP2XII-9 parasites treated with auxin for 2 hours. (B) Volcano plot of differentially expressed genes from RNA-sequencing analysis of TgAP2XII-9 parasites treated with auxin for 6 hours. (C) Venn diagram showing the overlap of upregulated genes from 2h and 6h RNA-Seq data. (D) Venn diagram showing the overlap of downregulated genes from 2h and 6h RNA-Seq data. (E) Pie chart showing the percentage and localisation of upregulated transcripts from RNA-Seq data. (F) Heatmap showing the cell cycle expression of Rhoptry, IMC and Apical complex proteins encoding upregulated transcripts peaking simultaneously with TgAP2XII-9 expression (denoted in a box). The phases of the cell cycle are depicted at the bottom. (G) Pie chart showing the percentage and localisation of downregulated transcripts from RNA-Seq data. (H) Heatmap showing the cell cycle expression of micronemes and Dense granule proteins encoding downregulated transcripts. Expression of TgAP2XII-9 is denoted. The phases of the cell cycle are depicted at the bottom.
Fig 4
Fig 4. TgAP2XII-9 is enriched at the promoters of T. gondii genes.
(A) (i) Pie chart showing the percentage of peaks (from 3 replicates) annotated in the different regions in the iKD TgAP2XII-9-HA strain. (A) (ii) Pie chart showing the percentage of peaks annotated in the different regions in the Parental Tir1 strain. (B) Density graphs and Heatmaps of the parental and TgAP2XII-9-HA (3 replicates) peaks located -2kb and +2kb from TSS. (C) Heatmap of cell cycle expression of all the genes that are bound by TgAP2XII-9 at their promoter. (D) CUT & Tag representing the direct targeting of TgAP2XII-9 to the promoters of TgISP3, TgIMC42 (i), TgRON5, TgRON8(ii), TgMIC3, TgMIC9(iii). Peak tracks for the 3 replicates of TgAP2XII-9-HA along with parental Tir1 are shown.
Fig 5
Fig 5. TgAP2XII-9 acts as a dual regulator regulating subset of MIC, ROP,GRA and IMC genes.
(A) Venn diagram showing the overlap of genes from 2h RNA-Seq, 6h RNA-Seq and CUT & Tag data. (B) Heatmap of cell cycle expression of genes directly regulated and targeted by TgAP2XII-9. (C) Defects in the MIC organization observed after 24 hours Auxin treatment while ROPs remain unaffected as realized by IFA and confocal imaging with TgMIC8 and TgROP17; Scale bar indicated at the bottom right corner of each image (D) Quantification of the MIC abnormal phenotype between the parental and iKD TgAP2XII-9 strains on 24hrs of auxin treatment. Statistical analysis was performed using a two-tailed Student’s t-test, with significance indicated by ***p < 0.001, data are presented as mean ± s.d. (n  =  3) (E) Western blot analysis of total protein extracts from iKD TgAP2XII-9-IMC42-Ty1 strain treated with Auxin for 24hrs. The blots were probed with anti-Ty1 to detect TgIMC42 protein levels (upper panel) and with anti-TgSortilin as a normalization control (lower panel). (F) Defects in the IMC42 organization observed after 24 hours Auxin treatment as realized by IFA and confocal imaging with Ty1 and TgIMC3; Scale bar indicated at the bottom right corner of each image.
Fig 6
Fig 6. TgAP2XII-9 directly regulates key genes involved in the daughter parasite formation.
(A) Venn diagram indicating that majority of genes targeted by TgAP2XII-9 are different to that targeted by TgAP2IX-5. (B) Venn diagram indicating that majority of genes targeted by TgAP2XII-9 are different to that targeted by TgAP2XI-5. (C) Venn diagram indicating the overlap of genes bound by both TgAP2XII-9 and TgAP2XII-2 and direct targets of MORC.
Fig 7
Fig 7. TgAP2XII-9 directly regulates other AP2 transcription factors and might provide a conducive environment for the expression of genes preferentially expressed in bradyzoites.
(A) Heatmap of cell cycle expression of the AP2 TFs directly regulated by TgAP2XII-9. (B) Heatmap of expression of upregulated transcripts through the tachyzoite, bradyzoite and sexual stages. Most of the overexpressed transcripts upon TgAP2XII-9 depletion are preferentially expressed at the tachyzoite stage of the parasite (C) Heatmap of expression of downregulated transcripts through the tachyzoite, bradyzoite and sexual stages. Many of the downregulated transcripts upon TgAP2XII-9 depletion are preferentially expressed at bradyzoite and throughout the sexual stages especially during EES5. EES stands for enteroepithelial developmental stages. Source data for B&C–Ramakrishnan et al.,2019 [35].
Fig 8
Fig 8. TgAP2XII-9 is responsible for the phenotypes observed and the AP2 domain is crucial for its function.
(A) Schematic representation of the iKD TgAP2XII-9 complementation strategy. The UPRT locus was targeted for the insertion of exogenous myc-tagged TgAP2XII-9/TgAP2XII-9ΔAP2, driven by its native promoter, to generate the complemented TgAP2XII-9 iKD strain. (B) Plaque assay showing the proliferation of the iKD-C TgAP2XII-9 and iKD-C TgAP2XII-9ΔAP2 strains in the presence and the absence of Auxin. (C) Quantification of the number of plaques in the iKD-C TgAP2XII-9 and iKD-C TgAP2XII-9ΔAP2 strains. Statistical analysis was performed using a two-tailed Student’s t-test, with significance indicated by ****p<0.0001, ***p < 0.001, *p<0.05. Data are presented as mean ± s.d. (n  =  3). (D) IFA and confocal imaging illustrate the IMC defect phenotype seen by using TgIMC3 and TgISP1 in the iKD TgAP2XII-9 and iKD-C TgAP2XII-9ΔAP2 in presence of Auxin but not in the iKD-C TgAP2XII-9, scale bar = 3 μm. (E) Quantification of the IMC defect phenotype using TgIMC3 between iKD TgAP2XII-9, iKD-C TgAP2XII-9 and iKD-C TgAP2XII-9ΔAP2 strains. Statistical analysis was performed using a two-tailed Student’s t-test, with significance indicated by *p<0.05, **p<0.01, ***p < 0.001, Data are presented as mean ± s.d. (n  =  3).

Similar articles

Cited by

References

    1. Kim K, Weiss LM. Toxoplasma: the next 100 years. Microbes Infect. 2008;10: 978–984. doi: 10.1016/j.micinf.2008.07.015 - DOI - PMC - PubMed
    1. Alday PH, Doggett JS. Drugs in development for toxoplasmosis: advances, challenges, and current status. Drug Des Devel Ther. 2017;11: 273. doi: 10.2147/DDDT.S60973 - DOI - PMC - PubMed
    1. Gubbels MJ, Coppens I, Zarringhalam K, Duraisingh MT, Engelberg K. The Modular Circuitry of Apicomplexan Cell Division Plasticity. Front Cell Infect Microbiol. 2021;11: 283. doi: 10.3389/fcimb.2021.670049 - DOI - PMC - PubMed
    1. Hawkins LM, Wang C, Chaput D, Batra M, Marsilia C, Awshah D, et al.. The Crk4-Cyc4 complex regulates G2/M transition in Toxoplasma gondii. EMBO Journal. 2024;43: 2094–2126. doi: 10.1038/s44318-024-00095-4 - DOI - PMC - PubMed
    1. Arias Padilla LF, Murray JM, Hu K. The initiation and early development of the tubulin-containing cytoskeleton in the human parasite Toxoplasma gondii. Mol Biol Cell. 2024;35. doi: 10.1091/MBC.E23-11-0418 - DOI - PMC - PubMed

LinkOut - more resources