In Vivo Quantification of Anterior and Posterior Chamber Volumes in Mice: Implications for Aqueous Humor Dynamics
- PMID: 39774626
- PMCID: PMC11724372
- DOI: 10.1167/iovs.66.1.18
In Vivo Quantification of Anterior and Posterior Chamber Volumes in Mice: Implications for Aqueous Humor Dynamics
Abstract
Purpose: Aqueous humor inflow rate, a key parameter influencing aqueous humor dynamics, is typically measured by fluorophotometry. Analyzing fluorophotometric data depends, inter alia, on the volume of aqueous humor in the anterior chamber but not the posterior chamber. Previous fluorophotometric studies of the aqueous inflow rate in mice have assumed the ratio of anterior:posterior volumes in mice to be similar to those in humans. Our goal was to measure anterior and posterior chamber volumes in mice to facilitate better estimates of aqueous inflow rates.
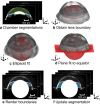
Methods: We used standard near-infrared (NIR) optical coherence tomography (OCT) and robotic visible-light OCT (vis-OCT) to visualize, reconstruct, and quantify the volumes of the anterior and posterior chambers of the mouse eye in vivo. We used histology and micro-computed tomography (CT) scans to validate relevant landmarks from ex vivo tissues and facilitate in vivo measurement.
Results: Posterior chamber volume is 1.1 times the anterior chamber volume in BALB/cAnNCrl mice, that is, the anterior chamber constitutes about 47% of the total aqueous humor volume, which is very dissimilar to the situation in humans. Anterior chamber volumes in 2-month-old BALB/cAnNCrl and C57BL6/J mice were 1.55 ± 0.36 µL (n = 10) and 2.05 ± 0.25 µL (n = 10), respectively. This implies that previous studies likely overestimated the aqueous inflow rate by approximately twofold.
Conclusions: It is necessary to reassess previously reported estimates of aqueous inflow rates and, thus, aqueous humor dynamics in the mouse. For example, we now estimate that only 0% to 15% of aqueous humor drains via the pressure-independent (unconventional) route, similar to that seen in humans and monkeys.
Conflict of interest statement
Disclosure:
Figures


Update of
-
In vivo quantification of anterior and posterior chamber volumes in mice: implications for aqueous humor dynamics.bioRxiv [Preprint]. 2024 Jul 25:2024.07.24.604989. doi: 10.1101/2024.07.24.604989. bioRxiv. 2024. Update in: Invest Ophthalmol Vis Sci. 2025 Jan 2;66(1):18. doi: 10.1167/iovs.66.1.18. PMID: 39091756 Free PMC article. Updated. Preprint.
Similar articles
-
In vivo quantification of anterior and posterior chamber volumes in mice: implications for aqueous humor dynamics.bioRxiv [Preprint]. 2024 Jul 25:2024.07.24.604989. doi: 10.1101/2024.07.24.604989. bioRxiv. 2024. Update in: Invest Ophthalmol Vis Sci. 2025 Jan 2;66(1):18. doi: 10.1167/iovs.66.1.18. PMID: 39091756 Free PMC article. Updated. Preprint.
-
Anterior chamber perfusion versus posterior chamber perfusion does not influence measurement of aqueous outflow facility in living mice by constant flow infusion.Exp Eye Res. 2017 Nov;164:95-108. doi: 10.1016/j.exer.2017.08.011. Epub 2017 Aug 16. Exp Eye Res. 2017. PMID: 28822760
-
Enhanced inflow and outflow rates despite lower IOP in bestrophin-2-deficient mice.Invest Ophthalmol Vis Sci. 2009 Feb;50(2):765-70. doi: 10.1167/iovs.08-2501. Epub 2008 Oct 20. Invest Ophthalmol Vis Sci. 2009. PMID: 18936135 Free PMC article.
-
The source of protein in the aqueous humor of the normal monkey eye.Invest Ophthalmol Vis Sci. 1992 Mar;33(3):581-95. Invest Ophthalmol Vis Sci. 1992. PMID: 1544784
-
Gadolinium-enhanced 7.0 T magnetic resonance imaging assessment of the aqueous inflow in rat eyes in vivo.Exp Eye Res. 2017 Sep;162:18-26. doi: 10.1016/j.exer.2017.06.019. Epub 2017 Jun 24. Exp Eye Res. 2017. PMID: 28655605
References
MeSH terms
Grants and funding
- R01 EY032507/EY/NEI NIH HHS/United States
- F30 EY034033/EY/NEI NIH HHS/United States
- R01 EY030124/EY/NEI NIH HHS/United States
- P30 EY019007/EY/NEI NIH HHS/United States
- R44 EY026466/EY/NEI NIH HHS/United States
- R01 EY033813/EY/NEI NIH HHS/United States
- R01 EY034740/EY/NEI NIH HHS/United States
- U01 EY033001/EY/NEI NIH HHS/United States
- R01 EY031710/EY/NEI NIH HHS/United States
- R01 EY034353/EY/NEI NIH HHS/United States
- P30 EY005722/EY/NEI NIH HHS/United States
- R01 EY032062/EY/NEI NIH HHS/United States
- R01 EY029121/EY/NEI NIH HHS/United States
LinkOut - more resources
Full Text Sources
Miscellaneous

