. 2025 Jan 7;15(1):1180.
doi: 10.1038/s41598-024-75015-x.

Pre-stack seismic inversion for reservoir characterization in Pleistocene to Pliocene channels, Baltim gas field, Nile Delta, Egypt

Affiliations

Pre-stack seismic inversion for reservoir characterization in Pleistocene to Pliocene channels, Baltim gas field, Nile Delta, Egypt

Ali S El-Sayed et al. Sci Rep. .

Abstract

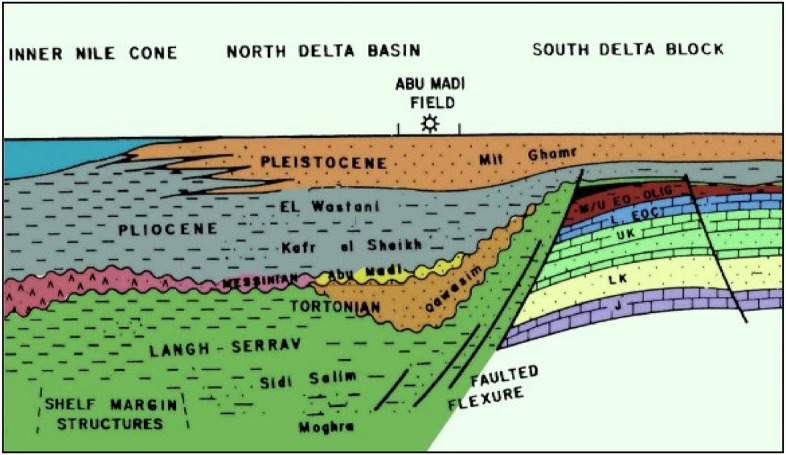
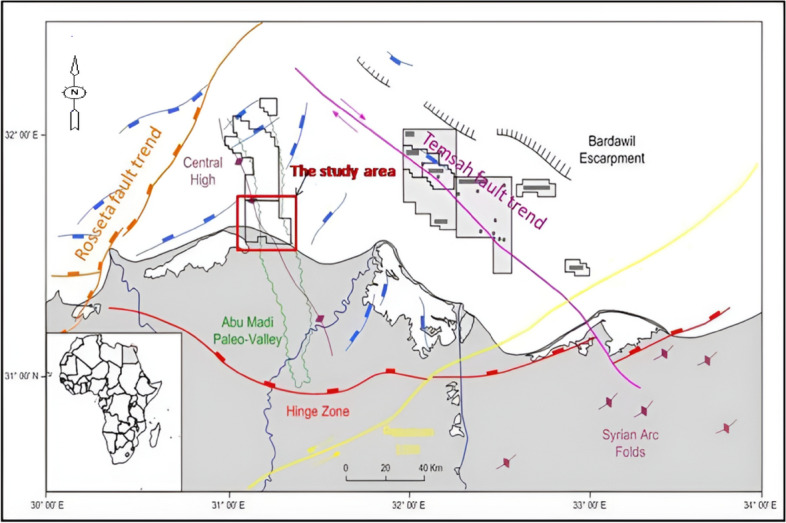
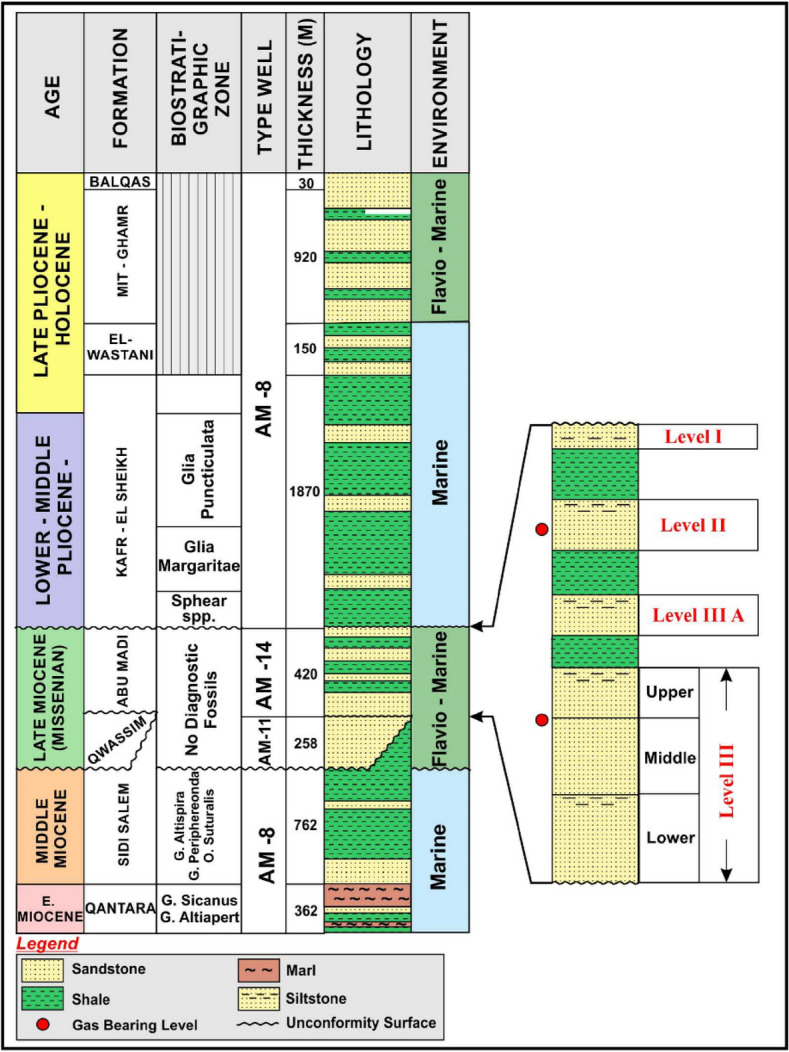
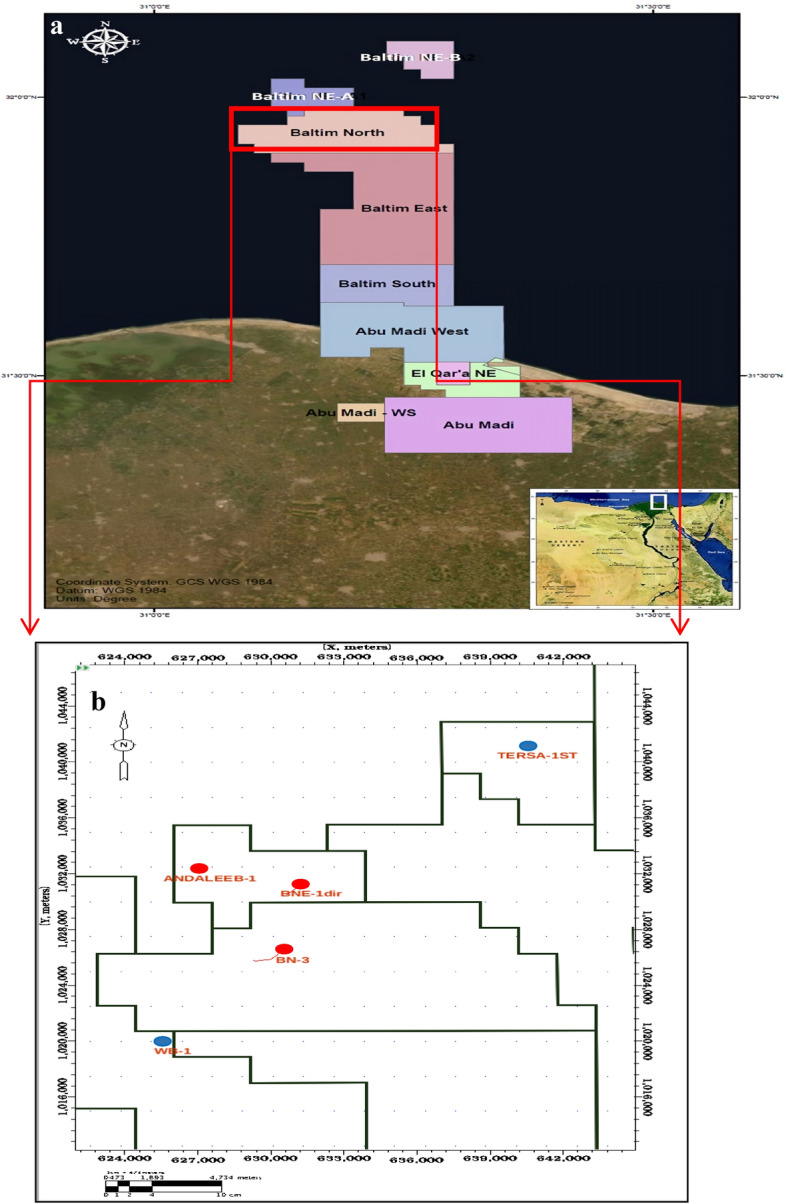
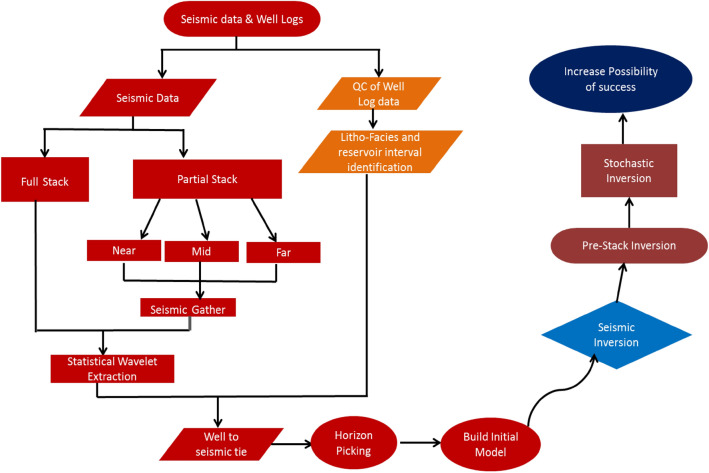
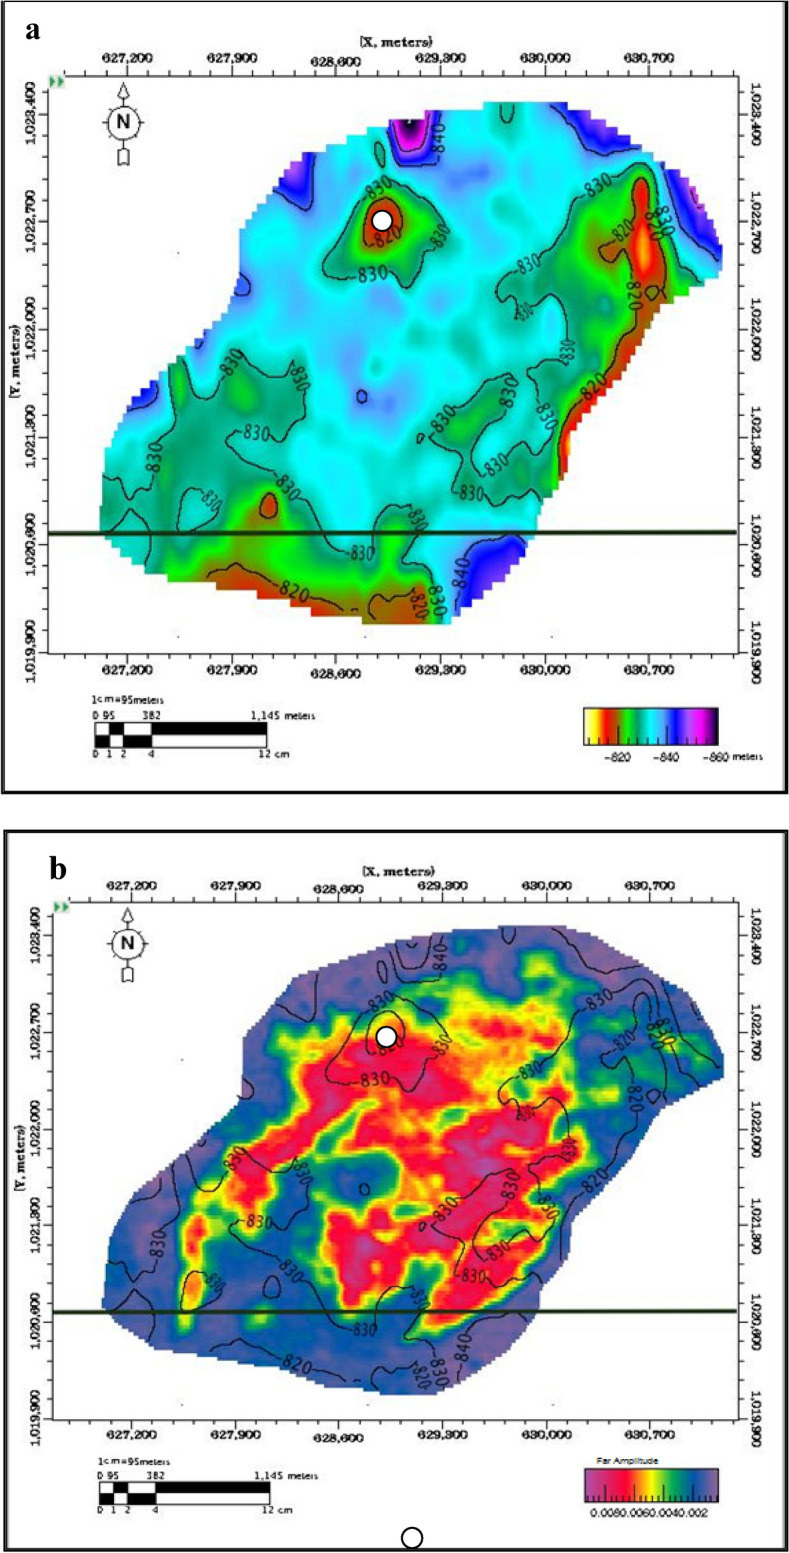
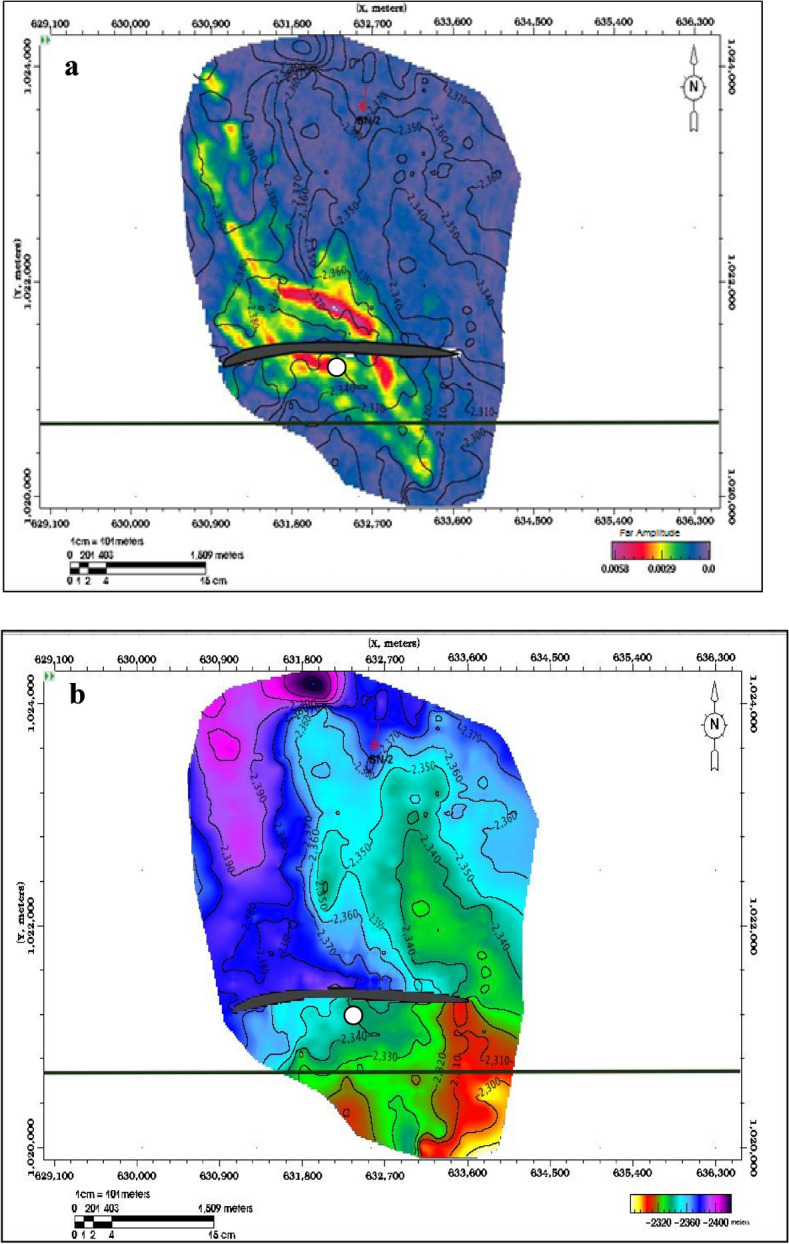
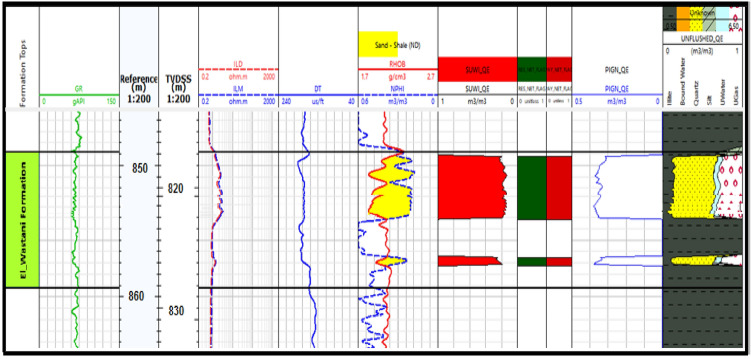
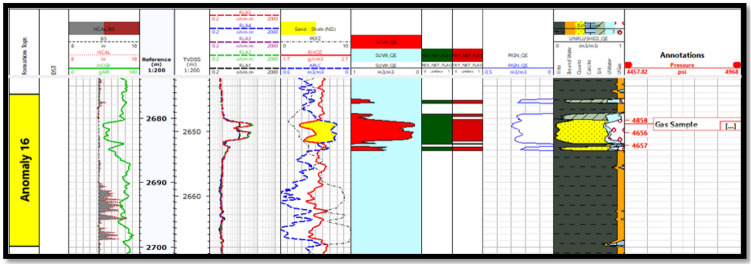
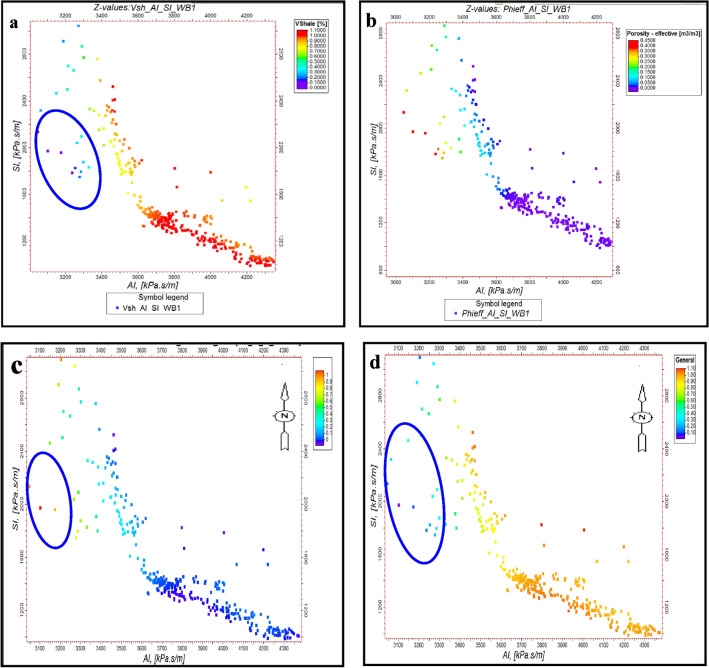
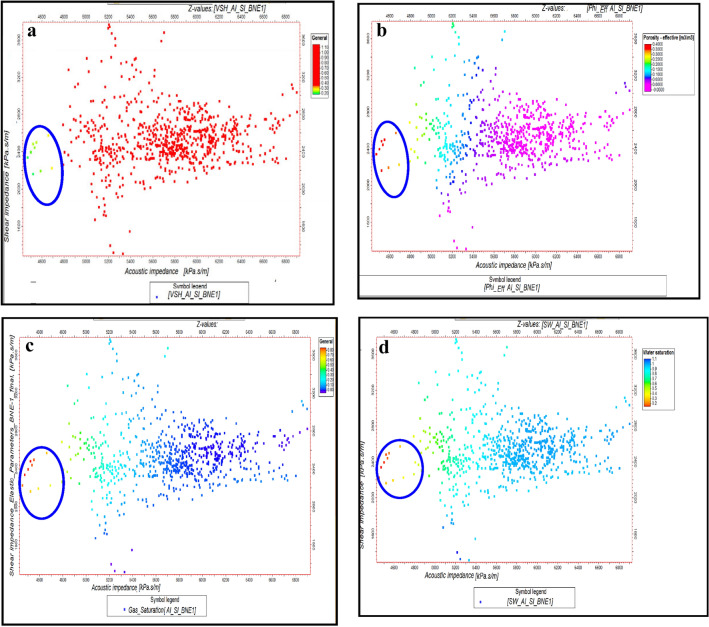
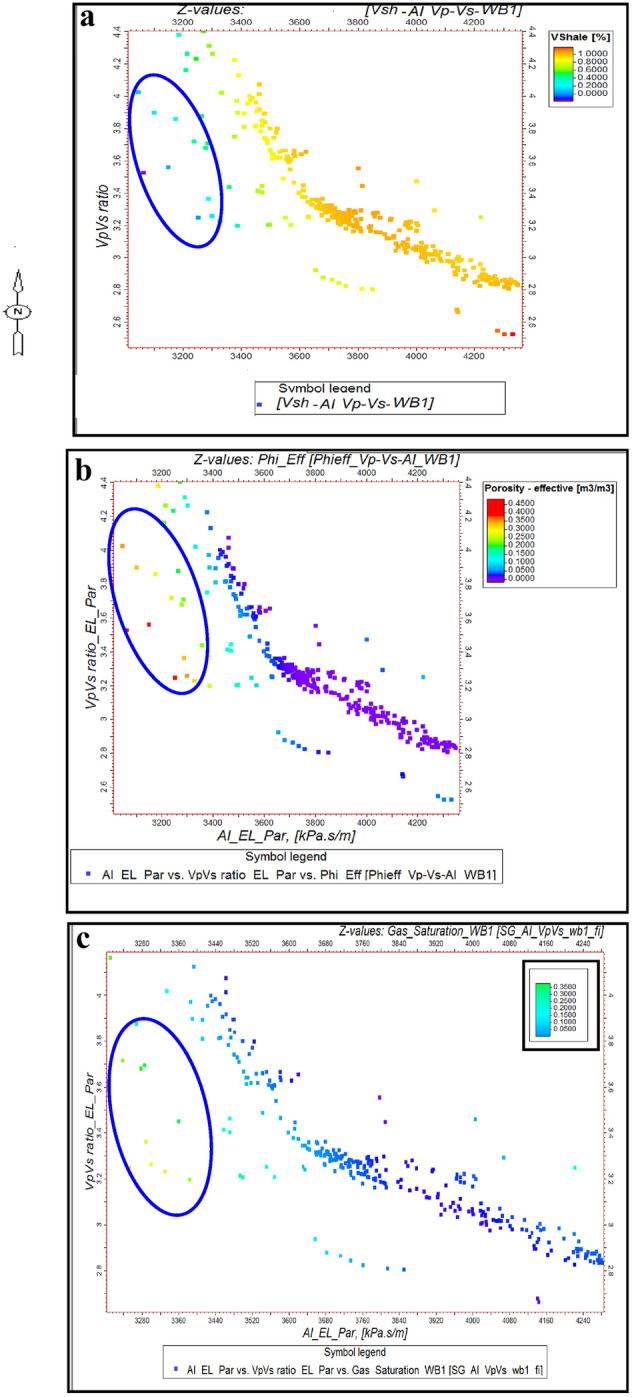
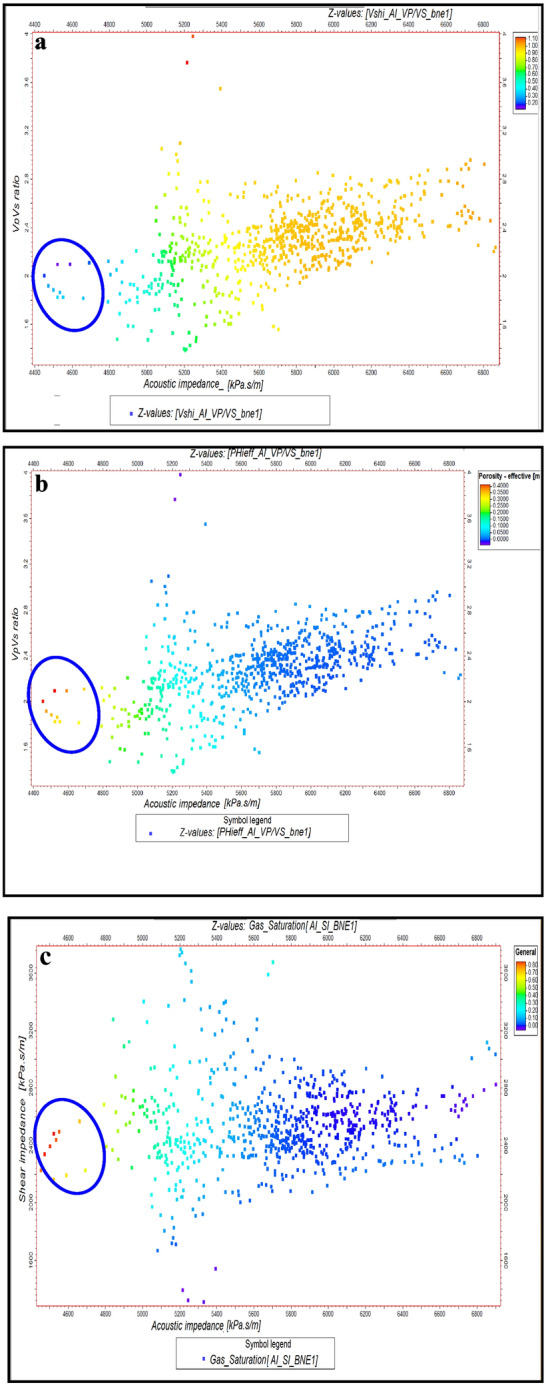
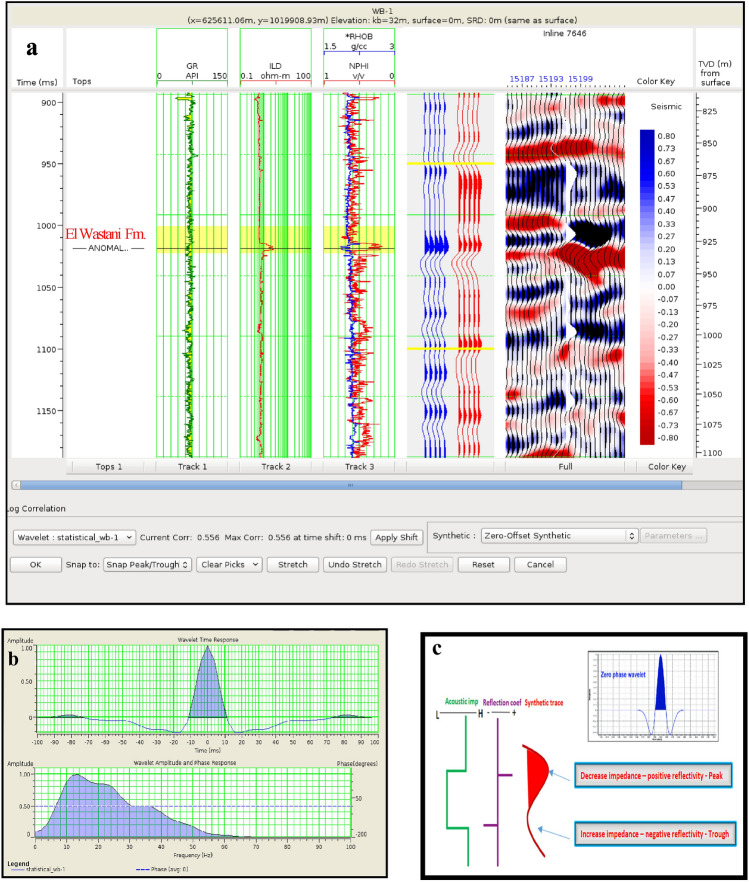
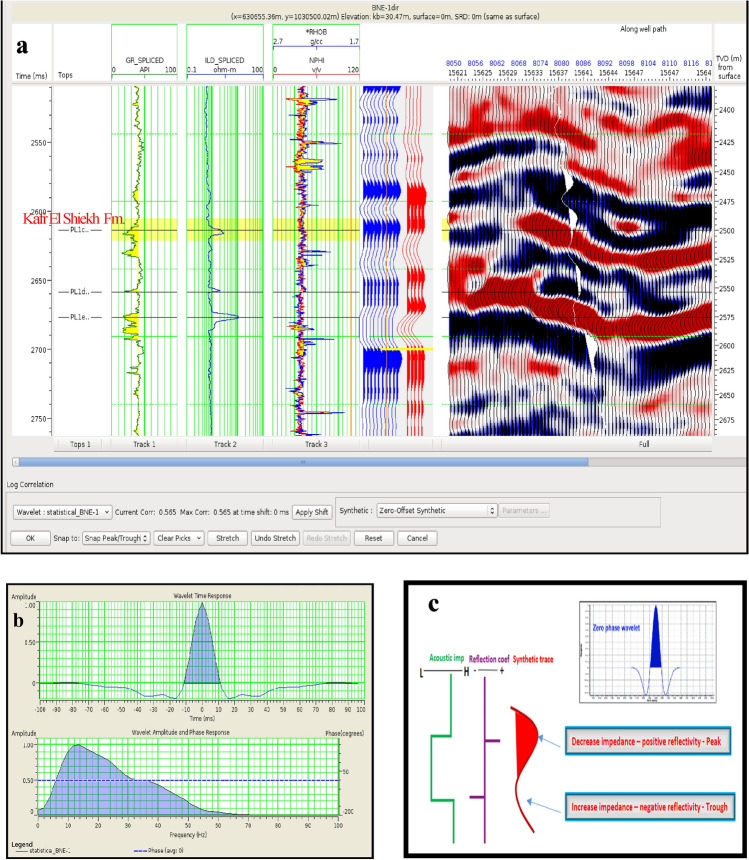
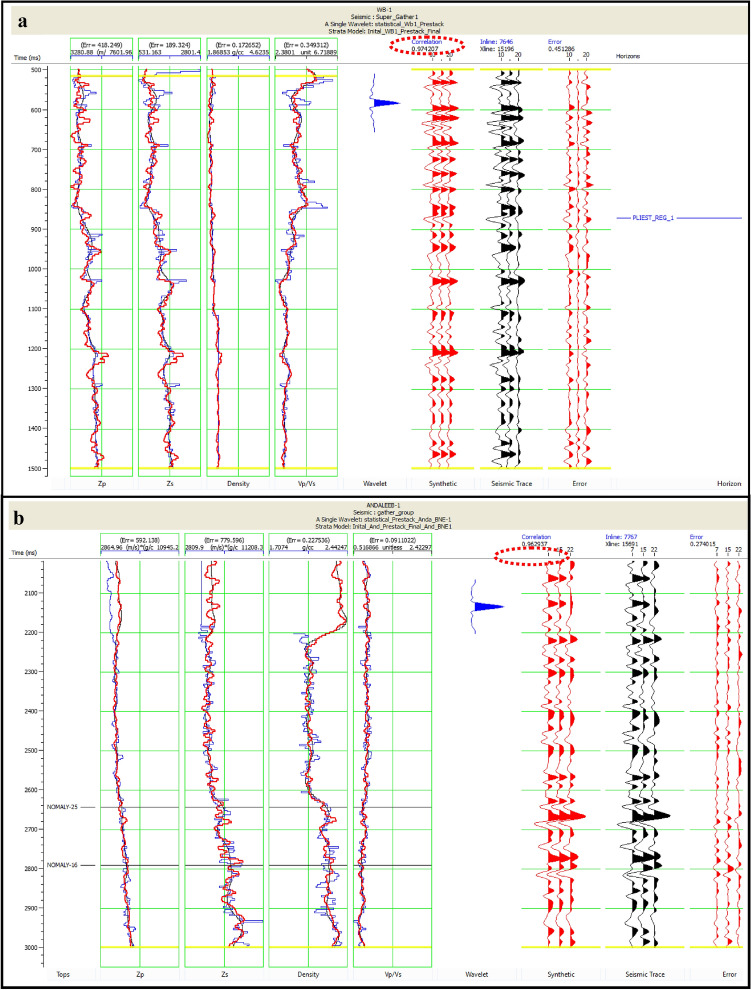
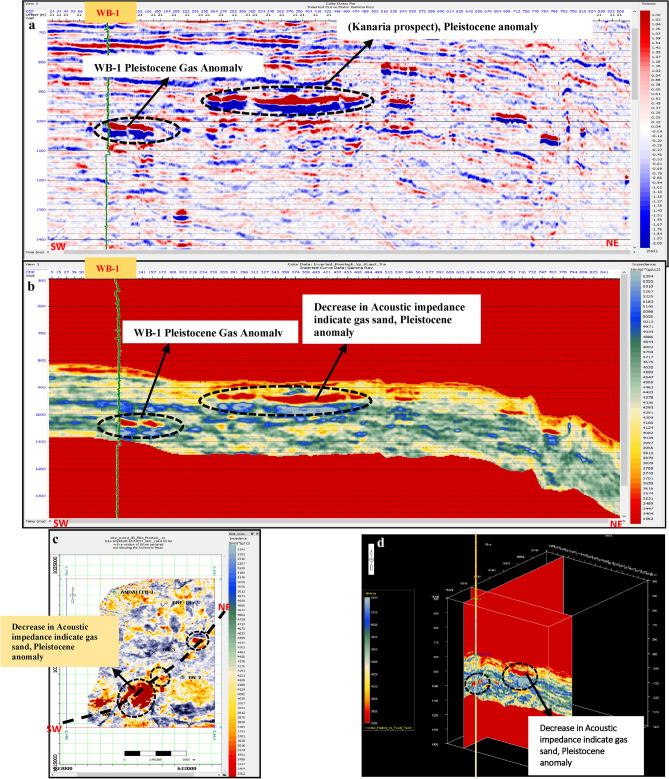
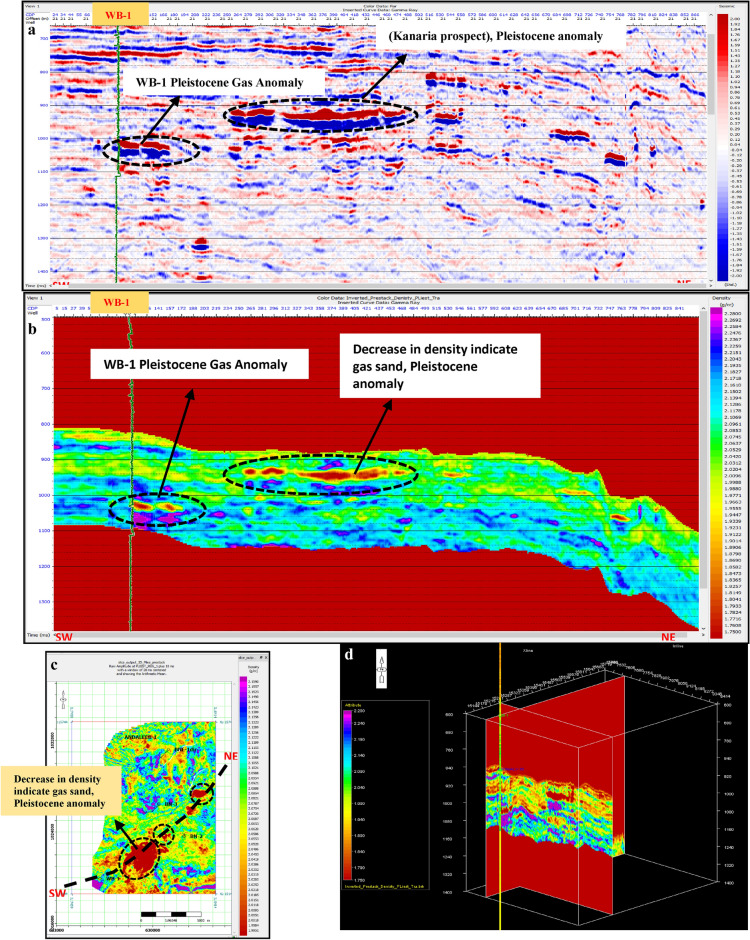
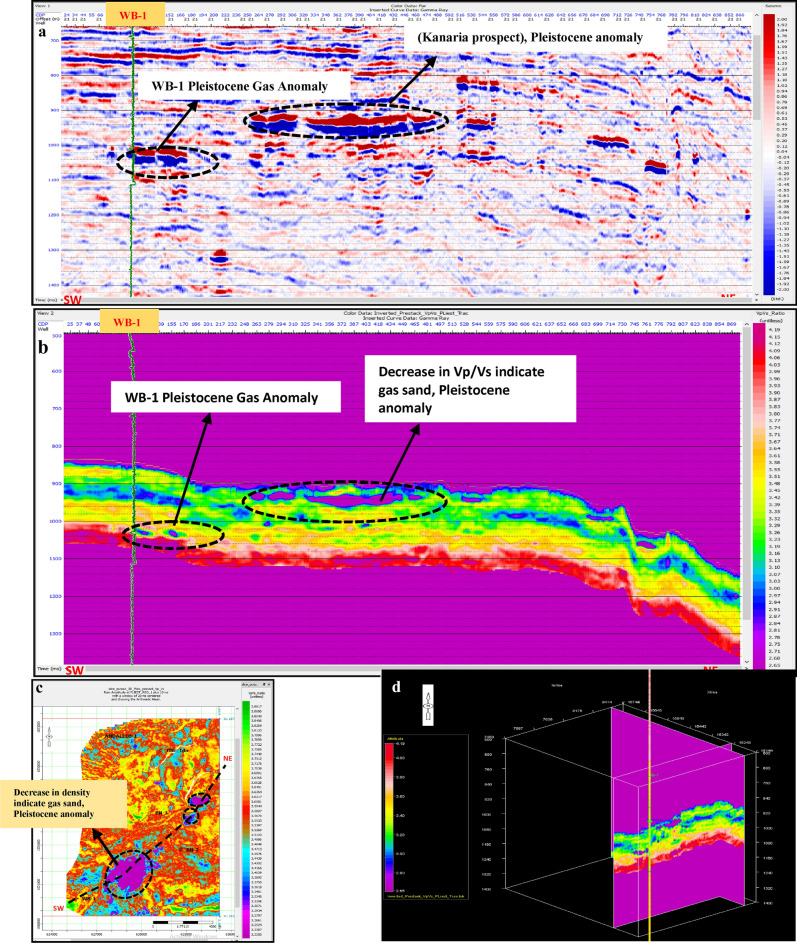
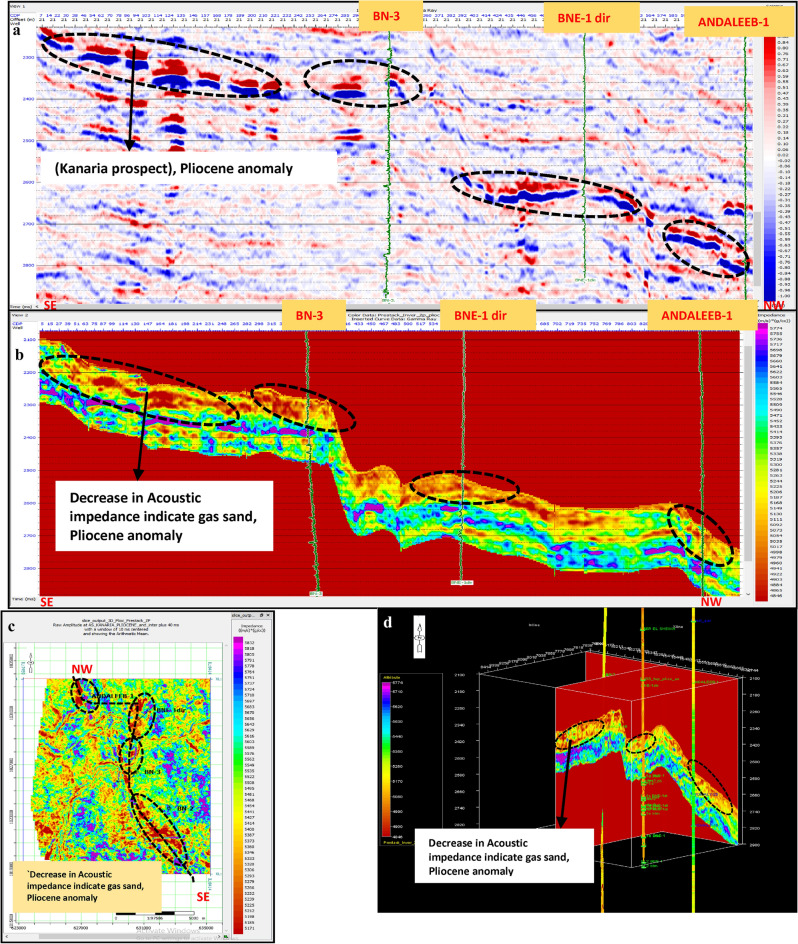
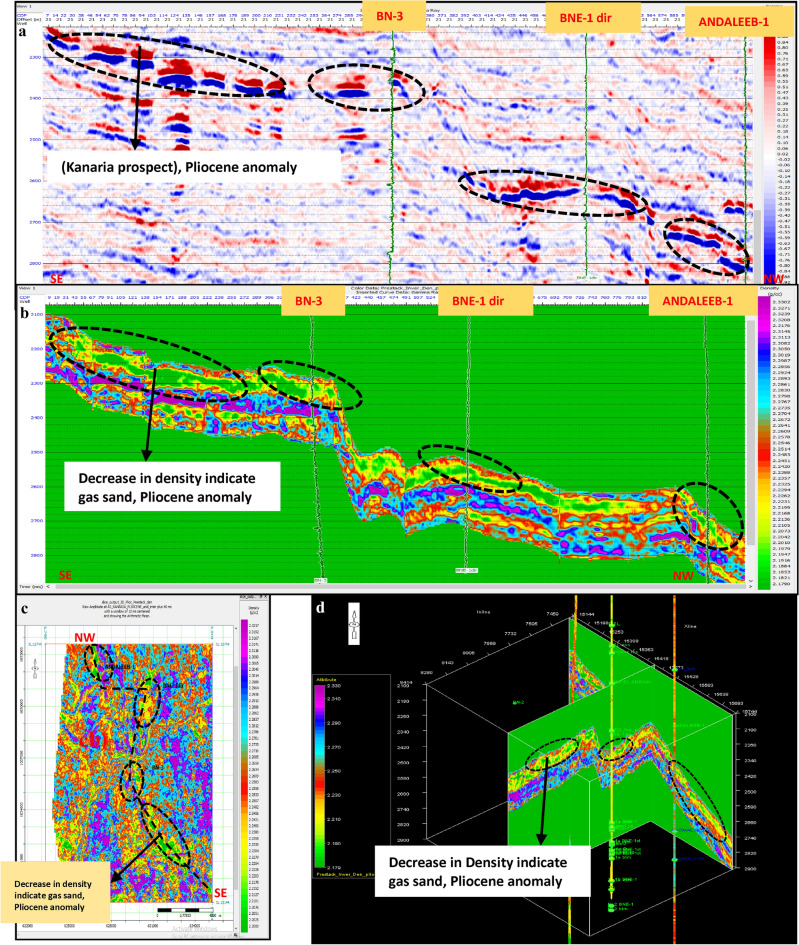
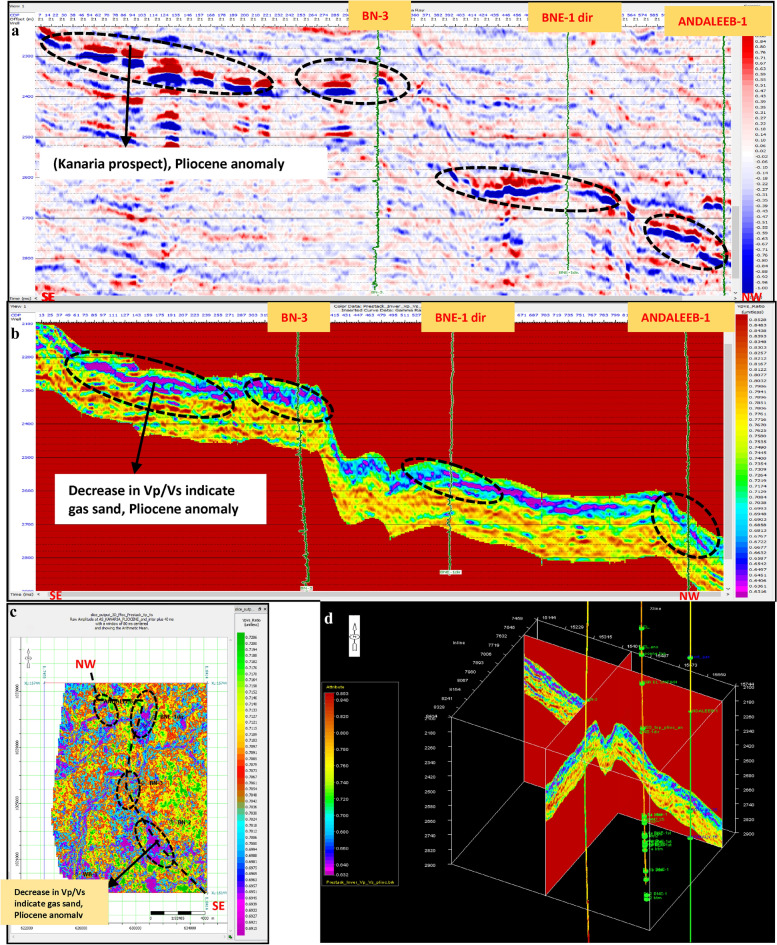
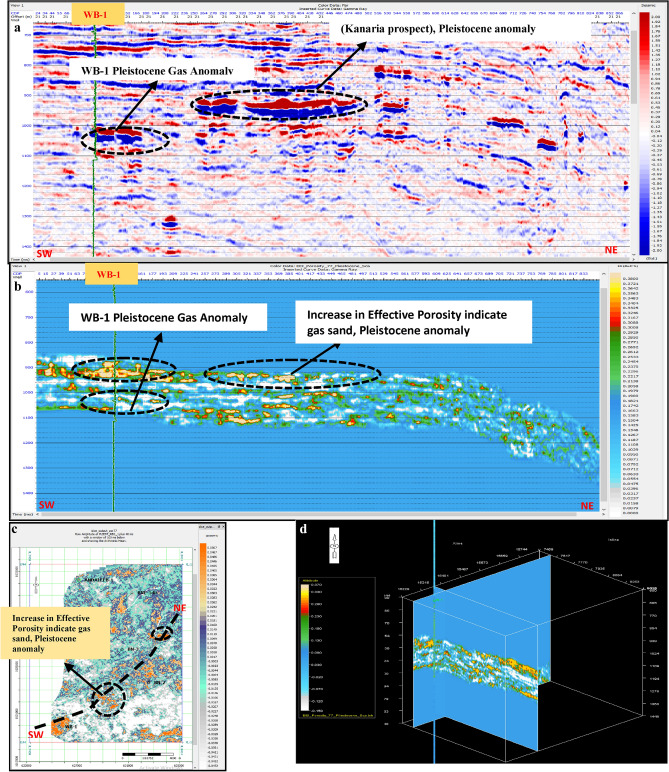
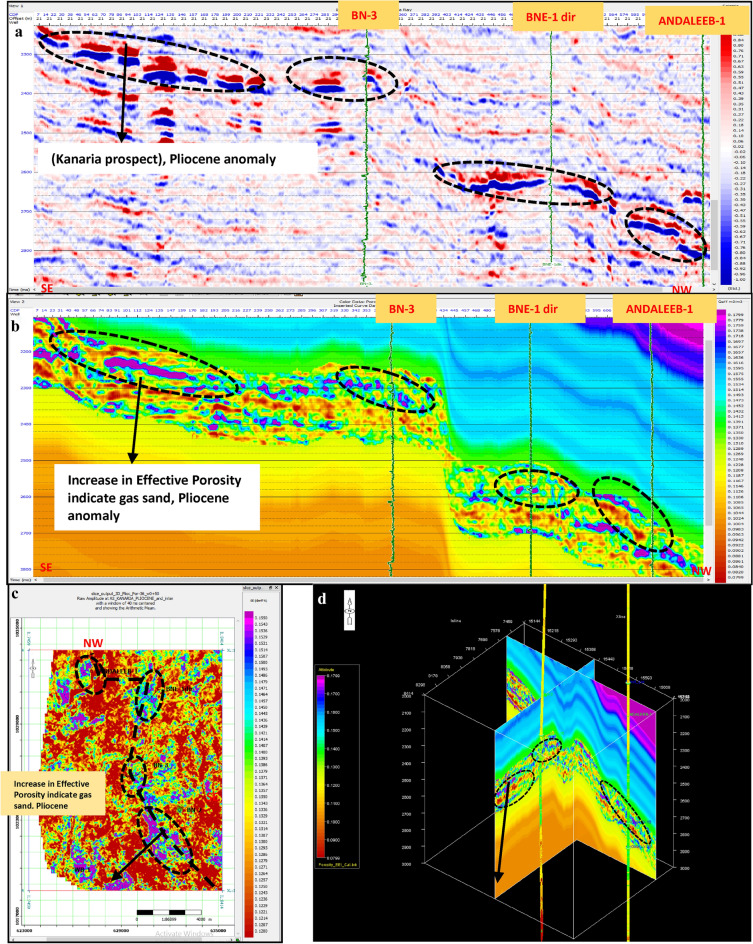
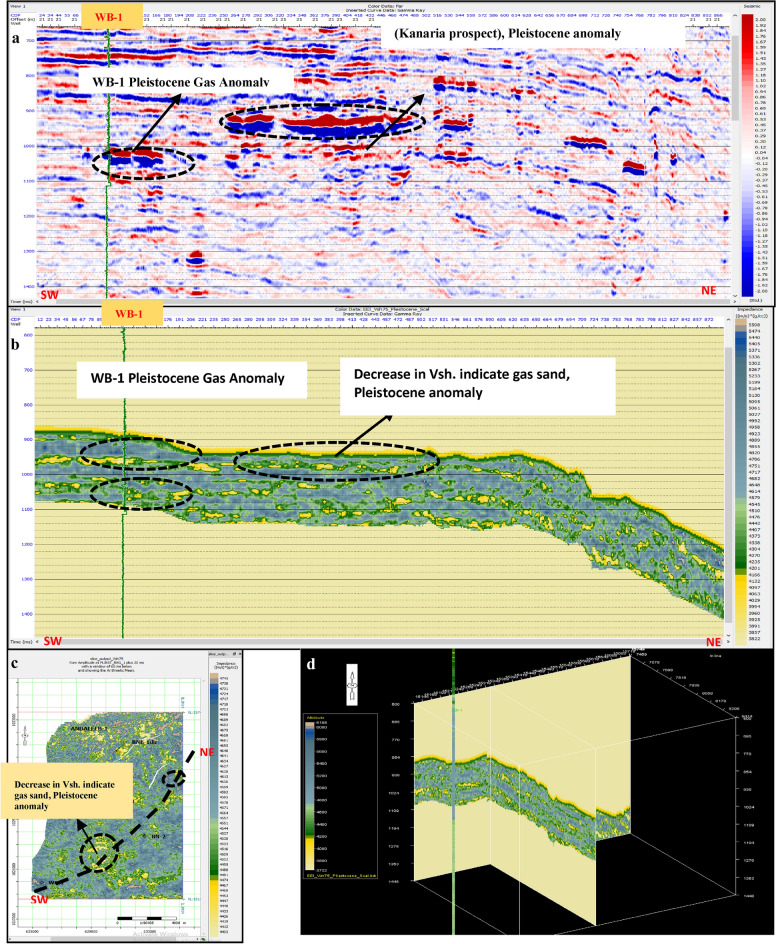
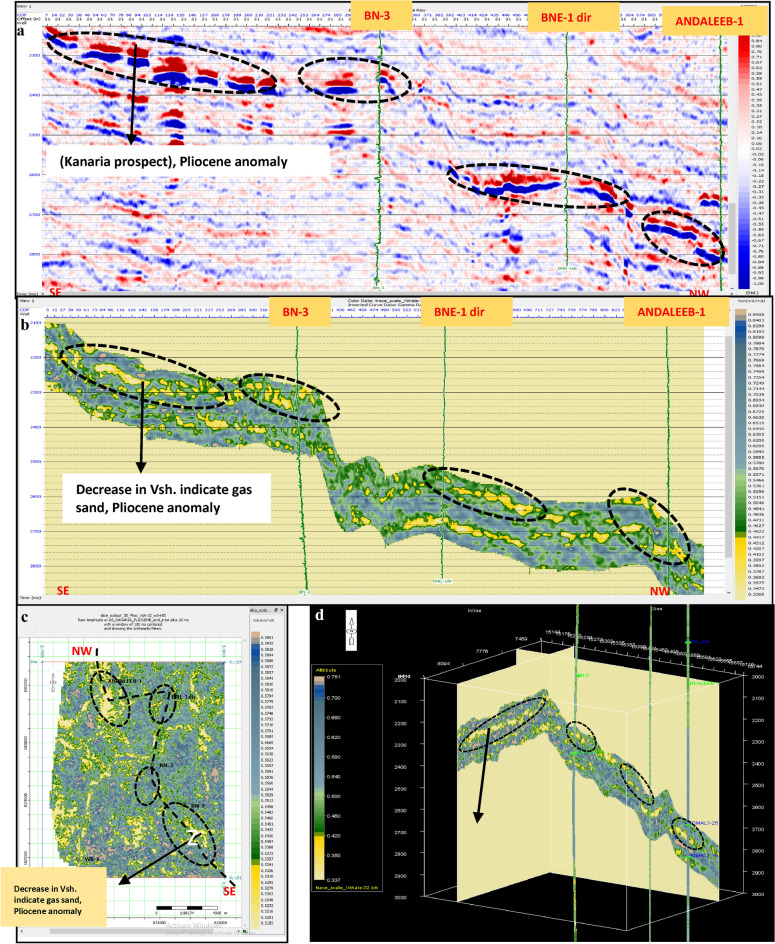
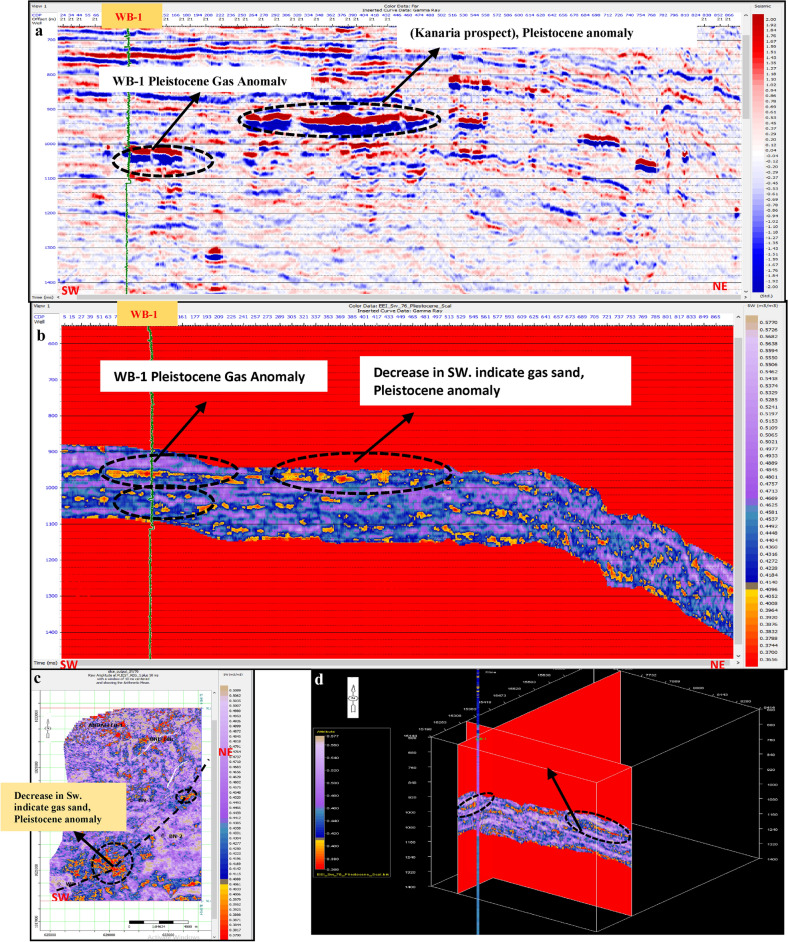
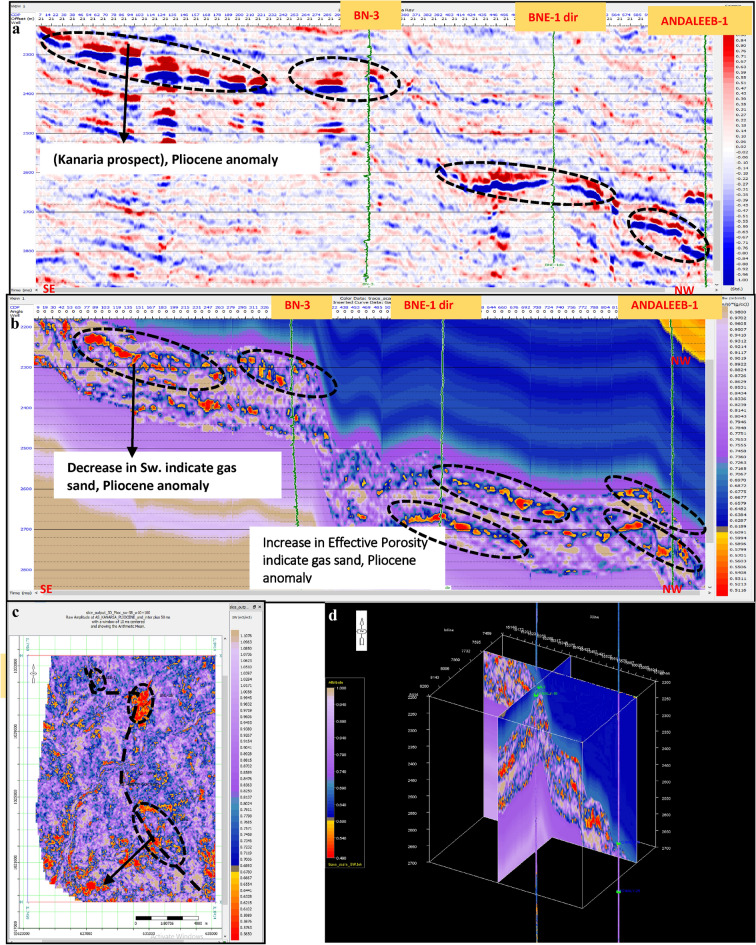
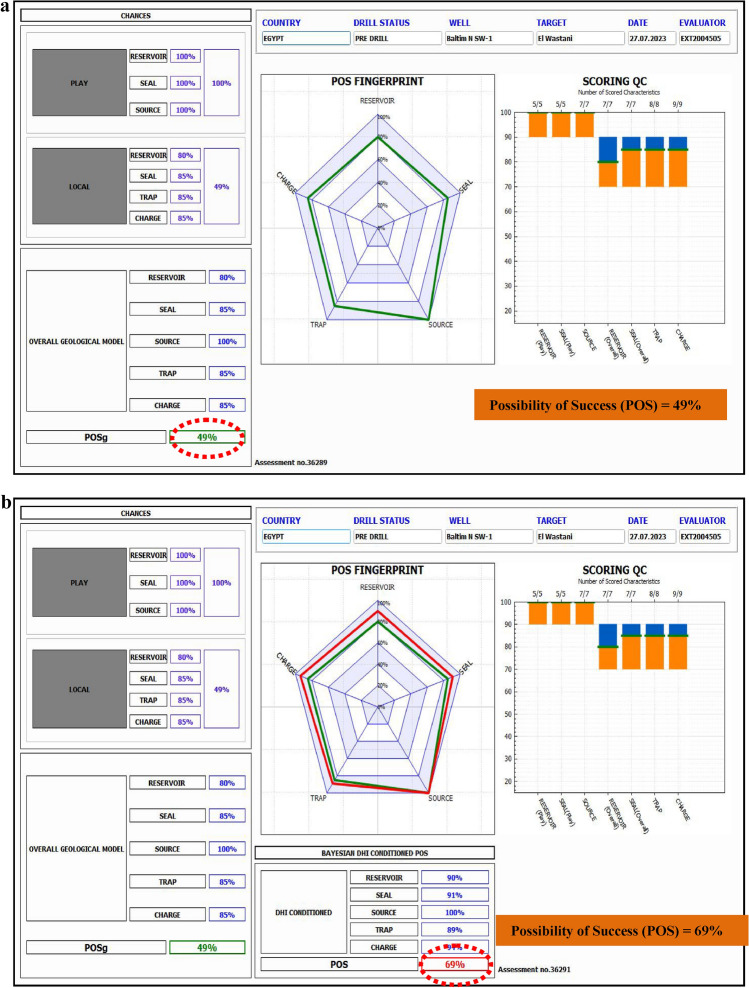
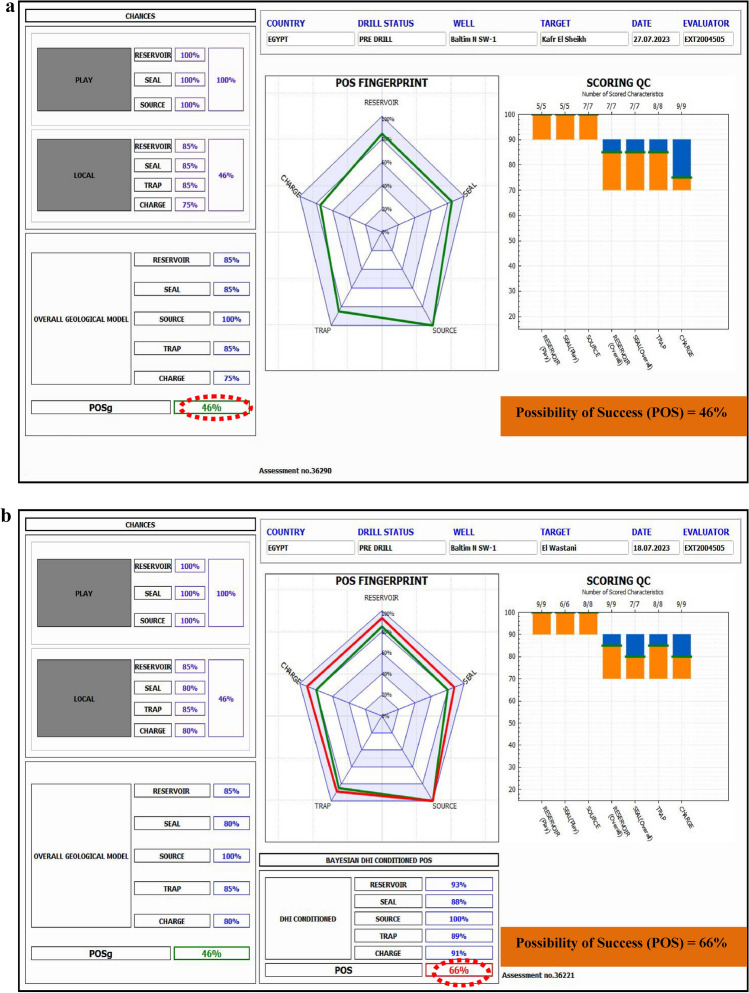
The Nile Delta, North Africa's leading gas-producing region, was the focus of this study aimed at delineating gas-bearing sandstone reservoirs from the Pleistocene to Pliocene formations using a combination of pre-stack inversion and rock physics analysis. This research employed seismic inversion techniques, including full-angle stack seismic volumes, well logs, and 3-D with rock physics modeling to refine volumes of P-wave velocity (Vp), S-wave velocity (Vs), and density. Traditional seismic attributes, such as far amplitude, proved insufficient for confirming gas presence, highlighting partial angle stacks, integrated the need for advanced methods. Extended Elastic Impedance (EEI) analysis was used to predict fluids and identify lithology in clastic reservoir environments. The EEI approach facilitated the determination of optimal projection angles for key petrophysical properties such as porosity, shale volume, and water saturation. This method was applied to the middle Pliocene (Kafr El Sheikh Formation) and the Pleistocene (El Wastani Formation), revealing promising drilling sites. In the Kafr El Sheikh Formation, porosity ranged from 16 to 29%, shale volume from 21 to 40%, and hydrocarbon saturation from 25 to 90%. The study concludes that integrating pre-stack seismic inversion with EEI significantly enhances the likelihood of identifying gas-bearing sands while reducing exploration risks. The improved POS for the Pleistocene anomaly gas bearing sand (from 49 to 69%) and the middle Pliocene anomaly (from 46 to 66%) underscores the effectiveness of this approach in the Baltim Field, Offshore Nile Delta, and supports further drilling and development wells.

Keywords: Baltim field; EEI; Gas bearing sand; Offshore Nile Delta; Pre-stack seismic inversion.


Conflict of interest statement

Competing interests: The authors declare no competing interests.

Figures

Fig. 1
Fig. 1
Scheme of the stratigraphic and facies relations between South Delta block and North Nile Delta basin,.
Fig. 2
Fig. 2
Nile Delta Regional Structural Framework.
Fig. 3
Fig. 3
Stratigraphic column of Baltim Field in the Nile Delta.
Fig. 4
Fig. 4
(a) Location map of a central Nile Delta, Egypt. (b) Base map showing the well locations.
Fig. 5
Fig. 5
Research Workflow, From Seismic data till risk assessment.
Fig. 6
Fig. 6
(a) Pleistocene Anomaly, Structure Depth Map, PSTM. (b) Pleistocene Anomaly, (− 25, 50) ms, far Amp./Depth Map.
Fig. 7
Fig. 7
(a) Middle Pliocene Anomaly, Structure Depth Map, PSTM. (b) Pleistocene Anomaly, (− 10, 40) ms, far Amp./Depth Map.
Fig. 8
Fig. 8
Petrophysical interpretation of WB-1 dir well (EL Wastani Fm.)
Fig. 9
Fig. 9
Petrophysical interpretation of ANDALEEB-1 dir well (Kafr El sheikh Fm.)
Fig. 10
Fig. 10
(a) AI Versus SI, with Vsh, as plotting curve from Neural Net at WB-1 well (El Wastani Fm.). (b) AI Versus SI, with Phieff, as plotting curve from Neural Net at WB-1 well (El Wastani Fm.). (c) AI Versus SI, with Sg, as plotting curve from Neural Net at WB-1 well (El Wastani Fm.). (d) AI Versus SI, with Sw, as plotting curve from Neural Net at WB-1 well (El Wastani Fm.)
Fig. 11
Fig. 11
(a) AI Versus SI, with Vsh, as plotting curve from Neural Net at BNE-1 dir well (Kafr El Shiek Fm.). (b) AI Versus SI, with PHIeff, as plotting curve from Neural Net at BNE-1 dir well (Kafr El Shiek Fm.). (c) AI Versus SI, with Sg, as plotting curve from Neural Net at BNE-1 dir well (Kafr El Shiek Fm.). (d) AI Versus SI, with Sw, as plotting curve from Neural Net at WB-1 well (El Wastani Fm.)
Fig. 12
Fig. 12
(a) AI Versus Vp/Vs ratio, with Vsh, as plotting curve from Neural Net at WB-1 well (El Wastani Fm.). (b) AI Versus Vp/Vs ratio, with PHIeff, as plotting curve from Neural Net at WB-1 well (El Wastani Fm.). (c) AI Versus Vp/Vs ratio, with Sg, as plotting curve from Neural Net at WB-1well (El Wastani Fm.).
Fig. 13
Fig. 13
(a) AI Versus Vp/Vs ratio, with Vsh, as plotting curve from Neural Net at BNE-1 dir well (Kafr El Shiek Fm.). (b) AI Versus Vp/Vs ratio, with PHIeff, as plotting curve from Neural Net at BNE-1 dir well (Kafr El Shiek Fm.). (c) AI Versus Vp/Vs ratio, with Sg, as plotting curve from Neural Net at BNE-1 dir well (Kafr El Shiek Fm.).
Fig. 14
Fig. 14
(a) Well to seismic tie for WB-1 well. (b) Statistical wavelet of WB-1 well. (c) Phase and polarity of WB-1 well.
Fig. 15
Fig. 15
(a) Well to seismic tie for BNE-1 dir well. (b) Statistical wavelet of BNE-1 dir well. (c) Phase and polarity of BNE-1 dir well.
Fig. 16
Fig. 16
(a) Pre seismic inversion analysis, for WB-1 well, Pleistocene anomaly, with correlation approximately 97%. (b) Pre seismic inversion analysis, for Andaleeb-1 well, Pleistocene anomaly, with correlation approximately 96%.
Fig. 17
Fig. 17
(a) Far SW-NE seismic section at Pleistocene anomaly (El Wastani Fm.). (b) SW-NE seismic section showing Zp Pre-Stack inversion model, Pleistocene anomaly (El Wastani Fm.). (c) Time Slice extracted for Zp Pre-Stack inversion model, extracted at Pleistocene gas sand anomaly (El Wastani Fm.). (d) 3D Volume showing Zp Pre-Stack inversion model, Pleistocene anomaly (El Wastani Fm.).
Fig. 18
Fig. 18
(a) Far SW-NE seismic section at Pleistocene anomaly (El Wastani Fm.). (b) SW-NE seismic section showing Density Pre-Stack inversion model, Pleistocene anomaly (El Wastani Fm.). (c) Time Slice extracted for Density Pre-Stack inversion model, extracted at Pleistocene gas sand anomaly (El Wastani Fm.). (d) 3D Volume showing Density Pre-Stack inversion model, Pleistocene anomaly (El Wastani Fm.).
Fig. 19
Fig. 19
(a) Far SW-NE seismic section at Pleistocene anomaly (El Wastani Fm.). (b) SW-NE seismic section showing Vp/Vs ratio Pre-Stack inversion model, Pleistocene anomaly (El Wastani Fm.). (c) Time Slice extracted for Vp/Vs ratio Pre-Stack inversion model, extracted at Pleistocene gas sand anomaly (El Wastani Fm.). (d) 3D Volume showing Vp/Vs ratio Pre-Stack inversion model, Pleistocene anomaly (El Wastani Fm.).
Fig. 20
Fig. 20
(a) Far SW-NE seismic section at Pliestocene anomaly (Kafr El Sheikh Fm.). (b) SW-NE seismic section showing Zp Pre-Stack inversion model, Kafr El-Sheikh Fm. (Pliocene Anomaly). (c) Time Slice extracted for Zp Pre-Stack inversion model, extracted at Kafr El-Sheikh Fm. (Pliestocene Anomaly). (d) 3D Volume showing Zp Pre-Stack inversion model, Pliocene anomaly (Kafr El-Sheikh Fm.).
Fig. 21
Fig. 21
(a) Far SW-NE seismic section at Pliocene anomaly (Kafr El Sheikh). (b) SW-NE seismic section showing Density Pre-Stack inversion model, Kafr El-Sheikh Fm. (Pliocene Anomaly). (c) Time Slice extracted for Density Pre-Stack inversion model, extracted at Kafr El-Sheikh Fm. (Pliocene Anomaly). (d) 3D Volume showing Density Pre-Stack inversion model, Kafr El-Sheikh Fm. (Pliocene Anomaly).
Fig. 22
Fig. 22
(a) Far SW-NE seismic section at Pliocene anomaly (Kafr El Sheikh). (b) SW-NE seismic section showing Vp/Vs ratio Pre-Stack inversion model, Kafr El-Sheikh Fm. (Pliocene Anomaly). (c) Time Slice extracted for Vp/Vs ratio Pre-Stack inversion model, extracted at Kafr El-Sheikh Fm. (Pliocene Anomaly). (d) 3D Volume showing Vp/Vs ratio Pre-Stack inversion model, Kafr El-Sheikh Fm. (Pliocene Anomaly).
Fig. 23
Fig. 23
(a) Far SW-NE seismic section at Pleistocene anomaly (El Wastani Fm.). (b) SW-NE EEI inverted effective Porosity (Φeff), Pleistocene anomaly. (c) Time Slice extracted for EEI inverted effective Porosity (Φeff) at El Wastani Fm. (Pleistocene anomaly). (d) 3D Volume showing EEI inverted effective Porosity (Φeff), Pleistocene anomaly (El Wastani Fm.).
Fig. 24
Fig. 24
(a) Far SW-NE seismic section at Pliocene anomaly (El Wastani Fm.). (b) SW-NE seismic section showing EEI inverted effective Porosity, Kafr El-Sheikh Fm. (Pliocene Anomaly). (c) Time Slice extracted from EEI inverted effective Porosity (Φeff) at Kafr El-Sheikh Fm. (Pliocene Anomaly). (d) 3D Volume showing EEI inverted effective Porosity (Φeff) at Pliocene anomaly (Kafr El-Sheikh Fm.).
Fig. 25
Fig. 25
(a) Far SW-NE seismic section at Pleistocene anomaly (El Wastani Fm.). (b) SW-NE EEI inverted Shale volume (Vsh), Pleistocene anomaly (El Wastani Fm.). (c) Time Slice extracted from EEI inverted Shale volume at El Wastani Fm. (Pleistocene anomaly). (d) 3D Volume showing EEI inverted Shale volume (Vsh), Pleistocene anomaly (El Wastani Fm.).
Fig. 26
Fig. 26
(a) Far SW-NE seismic section at Pliocene anomaly (Kafr El Sheikh Fm.). (b) SW-NE seismic section showing EEI inverted Shale volume (Vsh), Kafr El-Sheikh Fm. (Pliocene Anomaly). (c) Time Slice extracted from EEI inverted Shale volume at Kafr El-Sheikh Fm. (Pliocene Anomaly). (d) 3D Volume showing EEI inverted Shale volume (Vsh) at Pliocene anomaly (Kafr El-Sheikh Fm.).
Fig. 27
Fig. 27
(a) Far SW-NE seismic section at Pleistocene anomaly (El Wastani Fm.). (b) SW-NE EEI inverted Water saturation (Sw), Pleistocene anomaly. (c) Time Slice extracted from EEI inverted Water saturation (Sw) at El Wastani Fm. (Pleistocene anomaly). (d) 3D Volume showing EEI inverted Water saturation (Sw), Pleistocene anomaly (El Wastani Fm.).
Fig. 28
Fig. 28
(a) Far SW-NE seismic section at Pliocene anomaly (Kafr El Shiekh Fm.). (b) SW-NE seismic section showing EEI inverted Water saturation (Sw), Kafr El-Sheikh Fm. (Pliocene Anomaly). (c) Time Slice extracted from EEI inverted effective Porosity (Φeff) at Kafr El-Sheikh Fm. (Pliocene Anomaly). (d) 3D Volume showing EEI inverted Water saturation (Sw) at Pliocene anomaly (Kafr El-Sheikh Fm.).
Fig. 29
Fig. 29
(a) Possibility of Success, before applying Inversion technique, Pleistocene prospect anomaly (El-Wastani Fm.). (b) Possibility of Success, after applying Inversion technique, Pleistocene prospect anomaly (El-Wastani Fm.).
Fig. 30
Fig. 30
(a) Possibility of Success, before applying Inversion technique, Pliocene prospect anomaly (Kafr El-sheikh Fm.). (b) Possibility of Success, after applying Inversion technique, Pliocene prospect anomaly (Kafr El-sheikh Fm.).

References

    1. Abdel-Fattah, M. I., Hamdan, H. A. & Sarhan, M. A. Hydrocarbon potential and reservoir characteristics of incised-valley transgressive sandstones: A case study of the Messinian gas reservoirs (Nile Delta Basin, Egypt). J. Afr. Earth Sci.207, 105073. 10.1016/j.jafrearsci.2023.105073 (2023). - DOI
    1. El-Fawal, F. M., Sarhan, M. A., Collier, R. E. L., Basal, A. & Aal, M. H. A. Sequence stratigraphic evolution of the post-rift megasequence in the northern part of the Nile Delta basin, Egypt. Arab. J. Geosci.9(11), 585. 10.1007/s12517-016-2602-8 (2016). - DOI
    1. Sarhan, M. A. New prospective gas plays in Pliocene sands, offshore nile Delta basin: a case study from Kamose-1 well at north Sinai concession. Egypt10.1016/j.ptlrs.2021.12.007 (2021). - DOI
    1. Rizzini, A., Vezzani, F., Cococcetta, V. & Milad, G. Stratigraphy and sedimentation of a Neogene-Quaternary section in the Nile Delta area, (A.R.E.). Mar Geol.27, 327–348. 10.1016/0025-3227(78)90038-5 (1978). - DOI
    1. Hemdan, S., Jonathan M. Nile Delta Gas Origin and Biogenic Gas Potential, AAPG Search and Discovery Article #90161©2013 AAPG European Regional Conference, Barcelona, Spain, 8–10 April 2013 (2013).

LinkOut - more resources