. 2025 Jan 8;15(1):1250.
doi: 10.1038/s41598-024-83939-7.

Forearm elevation impairs local static handgrip endurance likely through reduction in vascular conductance and perfusion pressure: revisiting Rohmert's curve

Affiliations

Forearm elevation impairs local static handgrip endurance likely through reduction in vascular conductance and perfusion pressure: revisiting Rohmert's curve

L Heinzl et al. Sci Rep. .

Abstract

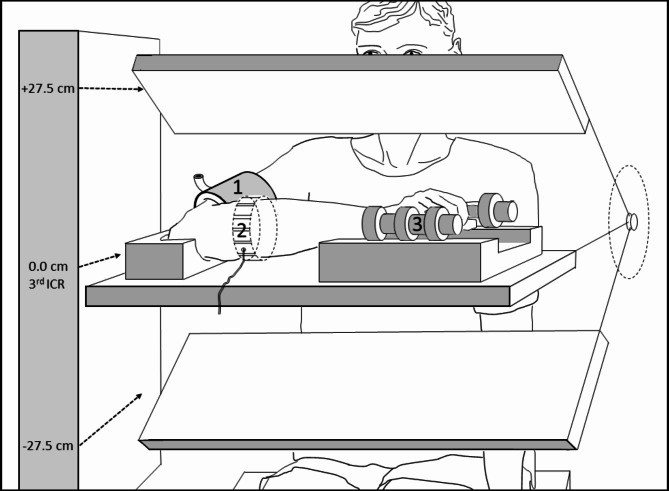
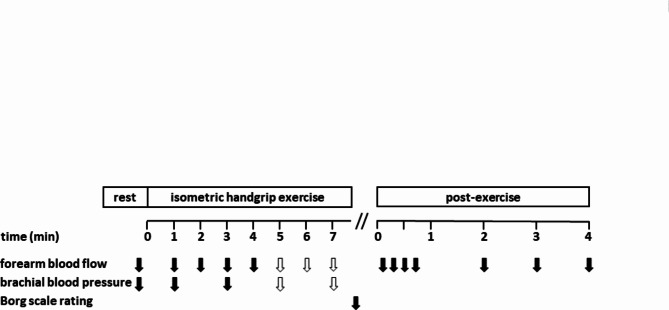
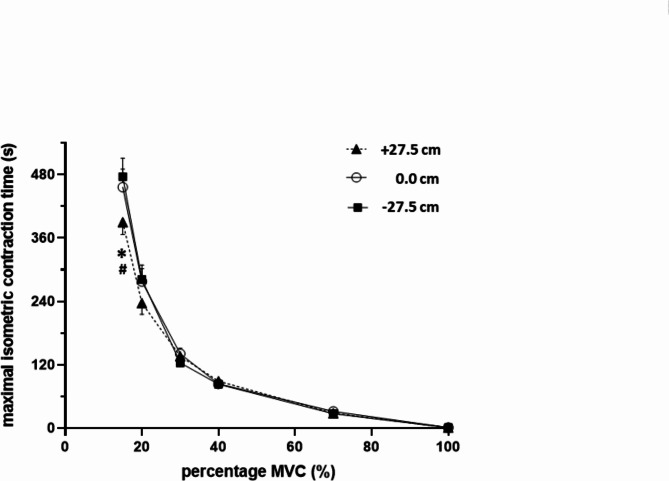
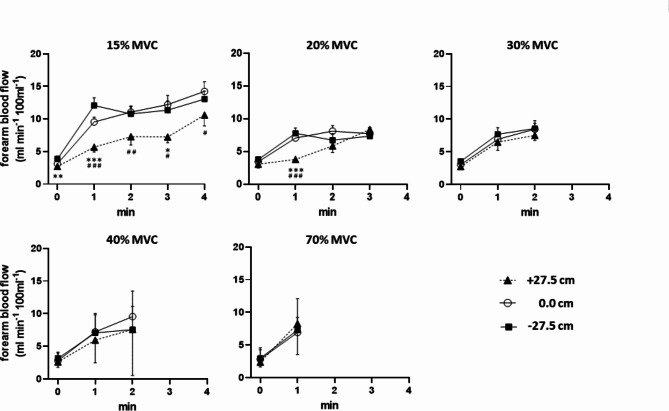
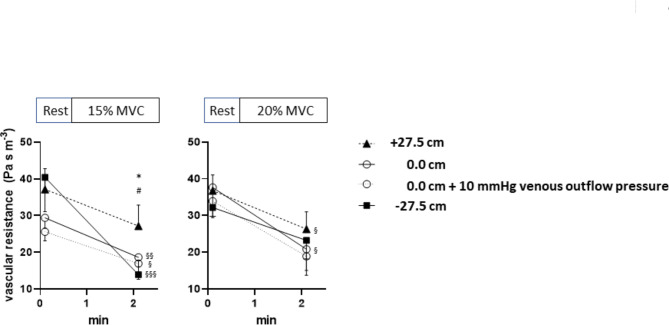
Maximal isometric contraction time (MICT) is critical for most motor tasks and depends on skeletal muscle blood flow at < 40% of maximal voluntary strength (MVC). Whether limb work positions associated with reduced perfusion pressure and facilitated vessel compression affect MICT is largely unknown. In 14 healthy young men we therefore assessed bilateral handgrip MICT at 15, 20, 30, 40, and 70% of MVC in horizontal forearm positions of 0.0, + 27.5 or - 27.5 cm relative to heart level. Forearm blood flow (FBF, venous occlusion plethysmography) and brachial blood pressure were measured repetitively. MICT at 15% MVC was significantly shorter by 66.3 and 86.2 s with forearm position + 27.5 cm (389.6 ± 23.3 s) as compared to 0.0 cm (455.9 ± 34.1 s) and - 27.5 cm (475.8 ± 35.0 s) while MICT at 20-70% MVC was unaffected. Peak FBF at 15% MVC was significantly lower in position + 27.5 cm (11.11 ± 0.92 ml/min/100 ml) compared to 0.0 cm (15.55 ± 0.91 ml/min/100 ml) or - 27.5 cm (14.21 ± 0.59 ml/min/100 ml) and vascular resistance significantly higher in position + 27.5 vs 0.0 or - 27.5 cm. Working position above, but not below heart level may limit MICT at 15% MVC possibly through blood flow reduction arising from increased vascular resistance beside reduced perfusion pressure. Local isometric endurance warrants (re)evaluation regarding hydrostatic/gravitational or other hemodynamic limitations.

Keywords: Blood flow; Fatigue; Gravitation; Hydrostatic pressure; Skeletal muscle; Static exercise.


Conflict of interest statement

Declarations. Competing interests: The authors declare no competing interests. Data availability: The data sets used and/or analyzed during the present study are available from the corresponding author on reasonable request.

Figures

Fig. 1
Fig. 1
Experimental setup showing the horizontal forearm support of the sitting subject in the three different experimental olecranon positions of 0.0 cm (reference position), + 27.5 cm (elevated), and − 27.5 cm (lowered) relative to the parasternal 3rd intercostal space (ICR). Venous occlusion plethysmography was performed with an upper arm occlusion cuff (1) and a linked-chain mercury-in-silastic-strain-gauge sensor (2) placed around the maximal forearm circumference as indicated for the right arm. Isometric handgrip was performed by a supported dynamometer (3) with visual feedback. Brachial blood pressure was measured at the contralateral dependent non-exercising arm (for details see Methods section).
Fig. 2
Fig. 2
Principal time schedule of pre-, intra- and post-exercise measurements of forearm blood flow and brachial blood pressure as well as Borg scale self-rating. For example, the isometric workload of 15% MVC could be sustained for 4 min by all subjects (as indicated by filled arrows). Statistical analysis of forearm blood flow and blood pressure values considered for this interval only, since longer maximal isometric contraction times were tolerated only by subgroups (as indicated by open arrow).
Fig. 3
Fig. 3
Relationship between maximal isometric contraction time tolerated until task failure (MICT) and graded % MVC (Rohmert’s curve) presented separately for the forearm test positions + 27.5, 0.0, and − 27.5 cm relative to the parasternal 3rd intercostal space (as indicated within the graph). * for p < 0.05 + 27.5 cm vs 0.0 cm; # for p < 0.05 + 27.5 cm vs − 27.5 cm.
Fig. 4
Fig. 4
Response of forearm blood flow to isometric exercise in the three different positions + 27.5, 0.0, and − 27.5 cm relative to the parasternal 3rd intercostal space with the five levels of % MVC as indicated: 15% (upper let panel), 20% (upper middle panel), 30% (upper right panel), 40% (lower left panel), and 70% (lower right panel). Forearm blood flow values during exercise significantly exceeded those at rest in all cases. * for p < 0.05, ** for p < 0.01, *** for p < 0.001 + 27.5 cm vs 0.0 cm; # for p < 0.05, ## for p < 0.01, ### for p < 0.001 + 27.5 cm vs − 27.5 cm.
Fig. 5
Fig. 5
Forearm vascular resistance calculated as the ratio between estimated mean forearm perfusion pressure and simultaneous forearm blood flow readings at rest and after 2 min of isometric contraction at 15% MVC (left panel) and 20% MVC (right panel) in the forearm position + 27.5, 0.0, and − 27.5 cm, as indicated. Mean forearm perfusion pressure was estimated as the difference between local mean arterial inflow pressure and venous outflow pressure. Local mean arterial inflow pressure was calculated as the brachial mean arterial pressure (MAP = diastolic pressure + 1/3 (systolic pressure − diastolic pressure)), derived from oscillometric measures from the dependent non-working contralateral upper arm with corrections for the hydrostatic pressure changes caused by forearm elevation to + 27.5 cm (− 20.23 mmHg) or forearm lowering to − 27.5 cmH2O (+ 20.23 mmHg) from 0.0 cm (reference position) relative to the parasternal 3rd ICS, respectively. Thereby, venous outflow pressure was assumed to be unchanged (around 0.0 mmHg) with forearm elevation to + 27.5 cm, while lowering the forearm to − 27.5 cm was considered to increase hydrostatic local arterial inflow or venous outflow pressure equally by 27.5 cmH2O (20.23 mmHg). As, realistically, venous outflow pressure in the forearm position of 0.0 cm (reference position) relative to the parasternal 3rd ICS could be assumed to vary between 0 and 10 mmHg (and to slightly exceed central venous pressure), vascular resistance was calculated assuming a venous outflow pressure equal to either 0.0 mmHg or, alternatively, 0.7355 mmHg, with this range approximately covering prevailing anatomical-physiological variations. * for p < 0.05 + 27.5 cm vs 0.0 cm or 0.0 cm + 10 mmHg; # for p < 0.05 + 27.5 cm vs −27.5 cm; § for p < 0.05, §§ for p < 0.01, §§§ for p < 0.001 exercise (2nd min) vs. rest.

Similar articles

References

    1. Hsu, W. L. et al. Fatigue changes neck muscle control and deteriorates postural stability during arm movement perturbations in patients with chronic neck pain. Spine J.20(4), 530–537. 10.1016/j.spinee.2019.10.016 (2020). - PubMed
    1. Paillard, T. & Borel, L. Unilateral and bilateral fatiguing contractions similarly alter postural stability but differently modify postural position on bipedal stance. Hum. Mov. Sci.32(2), 353–362. 10.1016/j.humov.2012.12.001 (2013). - PubMed
    1. Rohmert, W. Die Grundlage der Beurteilung statischer Arbeit (Westdeutscher Verlag ISSN 0367-3421, 1960).
    1. Kilbom, A. Circulatory adaptation during static muscular contractions. A review. Scand. J. Work Environ. Health2(1), 1–13. 10.5271/sjweh.2827 (1976) - PubMed
    1. Frey Law, L. A. & Avin, K. G. Endurance time is joint-specific: a modelling and meta-analysis investigation. Ergonomics53(1), 109–129. 10.1080/00140130903389068 (2010). - PMC - PubMed

LinkOut - more resources