. 2025 Jan 7;15(1):1045.
doi: 10.1038/s41598-025-85310-w.

Prediction model establishment of prognosis factors for acute myeloid leukemia based on the SEER database

Affiliations

Prediction model establishment of prognosis factors for acute myeloid leukemia based on the SEER database

Gangping Li et al. Sci Rep. .

Abstract

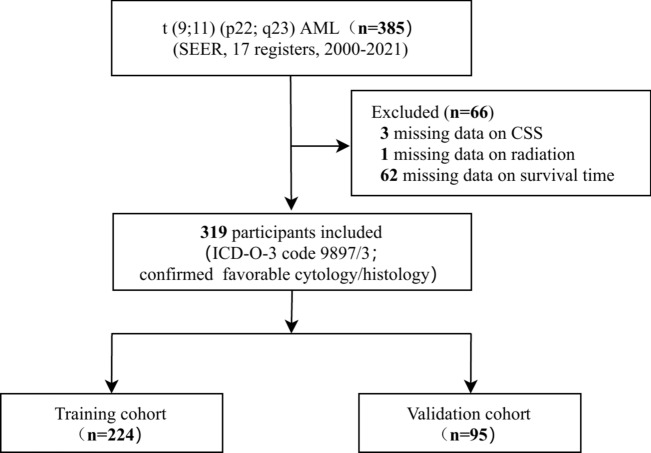
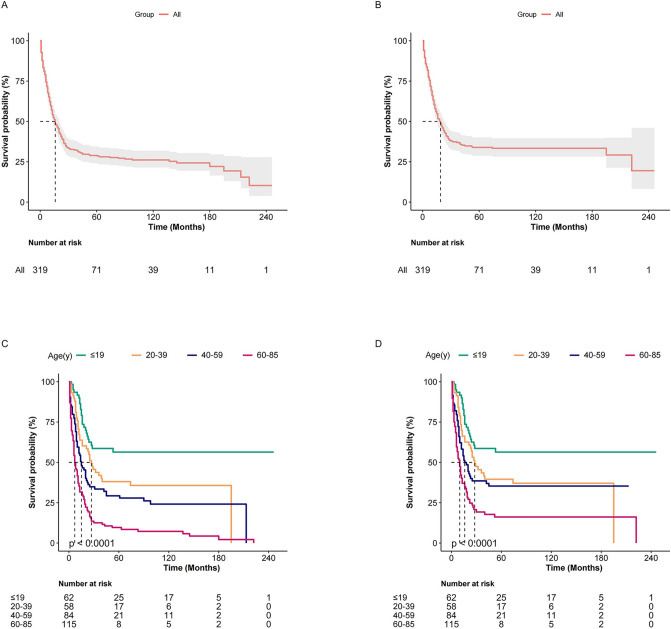
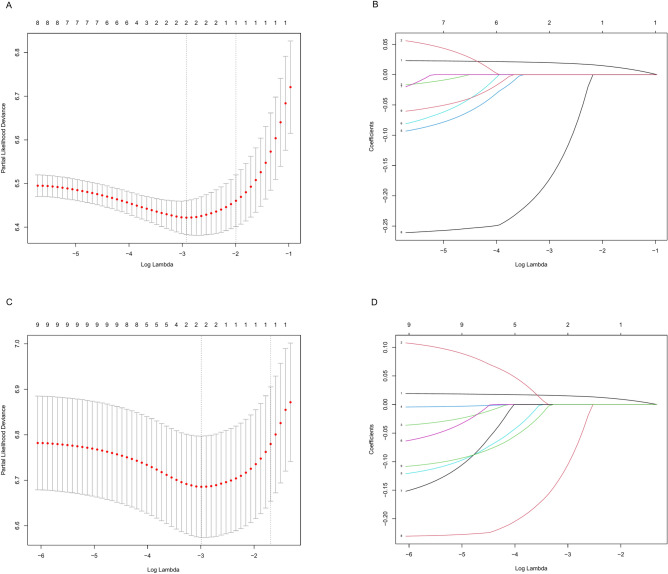
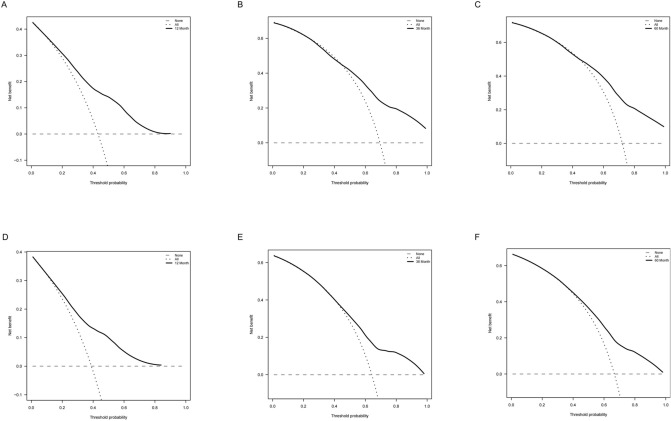
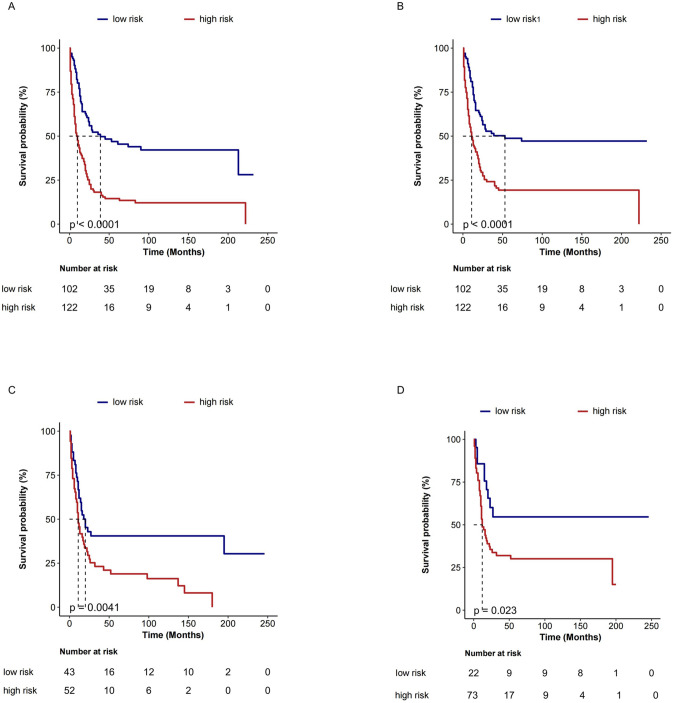
Acute myeloid leukemia (AML) with t (9;11) (p22; q23) presents as a varied hematological malignancy. The t (9;11) (p22; q23) translocation is the most common among 11q23/KMT2A rearrangements in AML. This research aimed to develop a nomogram for precise prediction of overall survival (OS) and cancer-specific survival (CSS) in AML with the t (9;11) (p22; q23) translocation. We utilized the Surveillance, Epidemiology, and End Results (SEER) database to identify patients diagnosed with t (9;11) (p22; q23) AML from 2000 to 2021. Prognostic factors for this AML subtype were determined using least absolute shrinkage and selection operator (LASSO) regression, which guided the creation of prognostic nomograms. To evaluate the model's discrimination, accuracy, and effectiveness, we employed the concordance index (C-index), calibration charts, receiver operating characteristic curves (ROC), area under the curve (AUC), and decision-curve analysis (DCA). The research was meticulously planned, executed, and documented in full adherence to the TRIPOD guidelines. The nomogram was developed using key variables including age, race, first primary tumor, and chemotherapy. The concordance indices (C-indices) were 0.704 for OS and for 0.686 for CSS. Patients were classified into high-risk and low-risk groups based on nomogram scores, with significant differences in OS and CSS between these groups (P < 0.001). This study developed innovative nomograms that combine clinical and treatment factors to predict 1-, 3-, and 5-year survival rates for patients with t (9;11) (p22; q23) AML.

Keywords: Analysis; Nomogram; Prognosis; SEER; T (911) (p22q23) acute myeloid leukemia.


Conflict of interest statement

Declarations. Ethics approval and consent to participate: The data analyzed and used in this study was obtained from Surveillance, Epidemiology, and End Results (SEER) database in accordance with the SEER data use agreement. Therefore, this study did not require approval of ethical board. Competing interests: The authors declare no competing interests. Consent for publication: Not applicable.

Figures

Fig. 1
Fig. 1
The flow chart of the study.
Fig. 2
Fig. 2
Kaplan–Meier analysis of overall survival (OS) and cancer-specific survival (CSS) in t (9;11) (p22; q23) AML. Kaplan–Meier survival curves of OS for all patients (A), CSS for all patients (B). Kaplan–Meier survival curves of OS for patients stratified by age (C), CSS for patients stratified by age (D).
Fig. 3
Fig. 3
LASSO regression plot for OS and CSS. A Plot of partial likelihood deviance for OS; B plot of LASSO coefficient profiles for OS; C Plot of partial likelihood deviance for CSS; D plot of LASSO coefficient profiles for CSS. Each curve illustrates the LASSO coefficient profile of a feature across the log (lambda) sequence.
Fig. 4
Fig. 4
Nomograms for predicting the 1-, 3- and 5-year OS rates (A) and CSS rates (B) for t (9;11) (p22; q23) AML patients.
Fig. 5
Fig. 5
Receiver operating characteristic (ROC) and calibration curves of the nomogram for OS and CSS. In the training cohort, the nomogram achieved AUC values of 0.762, 0.748, and 0.738 for predicting 1-, 3-, and 5-year OS (A), and 0.747, 0.721, and 0.716 for predicting 1-, 3-, and 5-year CSS (E). In the validation cohort, corresponding AUC values were 0.671, 0.679, and 0.726 for OS (C), and 0.670, 0.676, and 0.711 for CSS (G) across the same time intervals. Calibration curves for predicting 1-, 3-, and 5-year OS and CSS using the nomogram were generated for both the training cohort (B, F) and the validation cohort (D, H). The x-axis represents the predicted survival rate by the model, while the y-axis shows the actual survival rate. The ideal alignment is along the 45-degree line, where predicted and actual survival rates match perfectly. In the plots, red, blue, and orange lines correspond to the model’s predictions and actual outcomes for 1-year, 3-year, and 5-year OS, respectively.
Fig. 5
Fig. 5
Receiver operating characteristic (ROC) and calibration curves of the nomogram for OS and CSS. In the training cohort, the nomogram achieved AUC values of 0.762, 0.748, and 0.738 for predicting 1-, 3-, and 5-year OS (A), and 0.747, 0.721, and 0.716 for predicting 1-, 3-, and 5-year CSS (E). In the validation cohort, corresponding AUC values were 0.671, 0.679, and 0.726 for OS (C), and 0.670, 0.676, and 0.711 for CSS (G) across the same time intervals. Calibration curves for predicting 1-, 3-, and 5-year OS and CSS using the nomogram were generated for both the training cohort (B, F) and the validation cohort (D, H). The x-axis represents the predicted survival rate by the model, while the y-axis shows the actual survival rate. The ideal alignment is along the 45-degree line, where predicted and actual survival rates match perfectly. In the plots, red, blue, and orange lines correspond to the model’s predictions and actual outcomes for 1-year, 3-year, and 5-year OS, respectively.
Fig. 6
Fig. 6
Decision Curve Analysis (DCA) results evaluating a nomogram’s predictive accuracy for 1-, 3-, and 5-year OS rates (AC) and CSS rates (D-F) in t (9;11) (p22; q23) AML patients. The x-axis shows threshold probabilities, while the y-axis indicates the net benefit. The horizontal line on the x-axis shows no deaths predicted, while the diagonal dashed line indicates all patients predicted to have died. All = assuming all patients survive. None = assuming no patients survive.
Fig. 7
Fig. 7
Kaplan–Meier analysis of OS and CSS in t (9;11) (p22; q23) AML patients for risk stratification. Kaplan–Meier survival curves of OS and CSS in t (9;11) (p22; q23) AML patients stratified by the total points in the training cohort (A, B) and validation cohort (C, D).

Similar articles

References

    1. Bill, M. et al. Mutational landscape and clinical outcome of patients with de novo acute myeloid leukemia and rearrangements involving 11q23/KMT2A. Proc. Natl. Acad. Sci. USA117, 26340–26346. 10.1073/pnas.2014732117 (2020). - PMC - PubMed
    1. Heuts BMH, Arza-Apalategi S, Alkema SG, et al (2023) Inducible MLL-AF9 Expression Drives an AML Program during Human Pluripotent Stem Cell-Derived Hematopoietic Differentiation - PMC - PubMed
    1. Takahashi, T. et al. Extramedullary relapse of AML with t(9;11)(p22;q23) associated with clonal evolution from trisomy 8 into tetrasomy 8. Intern. Med.49(5), 447–451. 10.2169/internalmedicine.49.2904 (2010). - PubMed
    1. Tirado, C. A. et al. A t(9;11)(p22;q23) within the context of a complex karyotype is associated with a poor prognosis in a 19-year-old patient with AML. J. Assoc. Genet. Technol.47, 78–83 (2021). - PubMed
    1. Baer, M. R. et al. Acute myeloid leukemia with 11q23 translocations: Myelomonocytic immunophenotype by multiparameter flow cytometry. Leukemia12, 317–325. 10.1038/sj.leu.2400933 (1998). - PubMed

Publication types

LinkOut - more resources