. 2025 Mar;39(3):650-662.
doi: 10.1038/s41375-024-02509-y. Epub 2025 Jan 7.

EZH2 modulates mRNA splicing and exerts part of its oncogenic function through repression of splicing factors in CML

Affiliations

EZH2 modulates mRNA splicing and exerts part of its oncogenic function through repression of splicing factors in CML

Reinhard Brunmeir et al. Leukemia. 2025 Mar.

Abstract

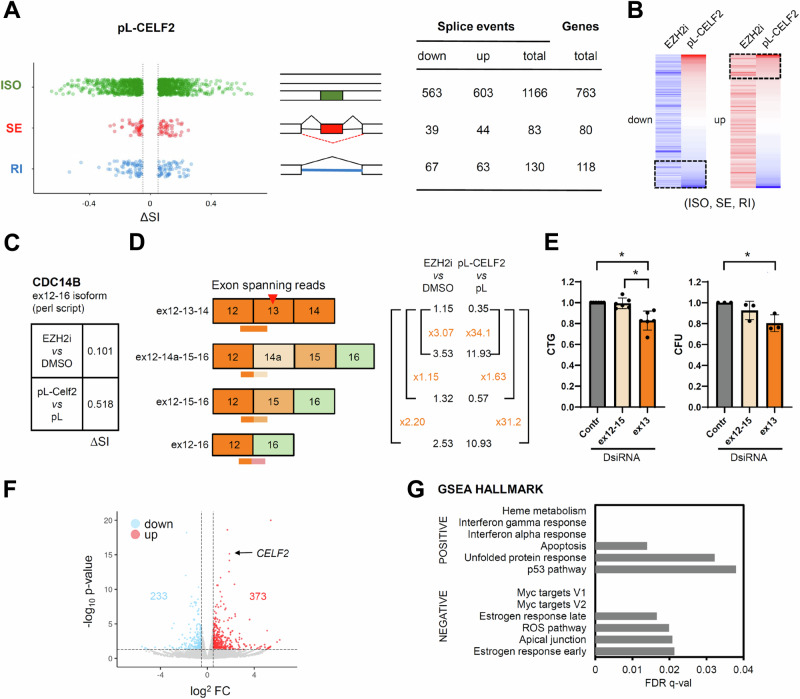
The polycomb protein EZH2 is up-regulated in Chronic Myeloid Leukaemia (CML) and associated with transcriptional reprogramming. Here we tested whether EZH2 might also act as a modulator of the mRNA splicing landscape to elicit its oncogenic function in CML. We treated CML cell lines with EZH2 inhibitors and detected differential splicing of several hundreds of events, potentially caused by the transcriptional regulation of splicing factors. Amongst those genes, CELF2 was identified as a candidate to mediate part of the EZH2 inhibitor induced phenotype. Upon over-expression, we observed (1) reduced cell growth, viability, and colony formation of CML cell lines, (2) a change in the splicing landscape, partially overlapping with EZH2 mediated changes, (3) the down-regulation of MYC signalling. Importantly, these findings were successfully validated in a cohort of CML patient samples, confirming the role of CELF2 as EZH2-regulated tumour-suppressor, contributing to the severe splicing de-regulation present in CML. Based on this we propose that EZH2 exerts part of its oncogenic function in CML through the transcriptional repression of splicing factors. Finally, analysis of publicly available datasets suggests that splicing modulation by EZH2 might not be restricted to CML.


Conflict of interest statement

Competing interests: The authors declare no competing interests. Ethics approval and consent to participate: The research was approved by the institutional review board (National University Hospital, DSRB# 2015/00804; DSRB#: 2007/00173) and all human participants gave written informed consent. All methods were performed in accordance with the relevant guidelines and regulations.

Figures

Fig. 1
Fig. 1. Splicing mis-regulation upon EZH2 inhibition.
A Plot on the left panel shows splicing events significantly de-regulated in K562 cells upon GSK126 and EPZ-6438 treatment (2 µM, 72 h), table on the right summarises up- and down-regulated events, as well as the number of associated genes. ISO: annotated isoform, SE: skipped exon, RI: retained intron, ΔSI: differential splice-index. B Genome tracks of RNA-seq signals of differentially spliced genes ZMIZ1, HERC2, IFFO2, MST1, C8orf33 in EZH2i-treated (GSK126, EPZ-6438: red) and control samples (DMSO: black). Exons are shown as blue boxes, relevant intron-exon junctions are indicated with black arrows, the strand direction with blue arrows. C Experimental validation of differential splicing via qRT-PCR. Primers specifically amplifying the spliced or non-spliced variant of nine putative target genes identified in (A) were used to examine changes in exon skipping or intron retention upon EZH2i treatment. The schematic view on the right side indicates the location of primers (black arrows) in relation to relevant exons (boxes) and introns (lines). Differential splicing events are highlighted in red. Results are based on 4 biological replicates, significance was calculated using t-test (paired, 2-tailed, * indicates p value < 0.05). SE ↑ , SE ↓ , and IR↓ indicates the type and direction of alternative splicing determined in (A).
Fig. 2
Fig. 2. Differentially spliced genes are distinct from transcriptional targets.
A Volcano plot showing preferential up-regulation of differentially expressed genes upon EZH2 inhibition in K562 cells (GSK126 and EPZ64-38 vs DMSO, 2 µM, 3 d). B GSEA analysis reveals enrichment of PRC2 target genes amongst DEGs. C Gene ontology (GO) analysis of differentially expressed genes (DEGs) or differentially spliced genes (DSGs) determined either with the in-house perl script or rMATS. D Venn diagrams show the overlap of genes found differentially expressed or spliced upon EZH2 inhibitor treatment. E Metagene analysis depicting the mean enrichment of H3K27me3 (upper panels) or EZH2 (lower panels) across PRC2 target genes (left), DEGs (middle) or DSGs (right). ChIP-seq signals were normalized to corresponding inputs before plotting. TSS: transcript start site, TES: transcript end site. F Metagene analysis of H3K27me3 or EZH2 enrichment at DSGs only, presenting either normalized mean values for all exon/intron junctions (left), or focusing exclusively on differentially spliced junctions (right).
Fig. 3
Fig. 3. EZH2-regulated splicing genes in K562.
A Heatmap showing differential expression of RNA splicing genes after GSK126 and EPZ-6438 treatment relative to DMSO controls. B Significantly up-regulated genes in both conditions with log2 fold changes <0.5 and p values < 0.05 are shown in detail. C To estimate basal expression levels of genes from (B) their normalized counts in control samples (DMSO) were plotted. D mRNA expression of CELF2, MBNL3, KHDRBS3, HABP4, RBM11 in K562 cell lines transduced with lentiviral constructs containing their cDNAs or an empty vector (pL), determined via qRT-PCR. Expression values are normalized to GAPDH, and represent the mean of 4 biological replicates. * p value < 0.05 (t test, paired, 2-tailed). E Western blot showing the presence of the FLAG-tagged protein of over-expressed splicing factors in K562 cells (upper panel). B-ACTIN served as loading control (lower panel). F Cell viability of K562 cell lines stably over-expressing indicated SRs. CTG assays were performed to determine ATP levels as indicator of metabolically active cells. * p value < 0.05 (t test, paired, 2-tailed). G Validation of differential splicing upon over-expression of SRs. qRT-PCR analysis for 6 genes shown to be differentially spliced upon EZH2i treatment (See Fig. 1C). Given are the relative levels of retained introns / skipped exons versus non-retained / non-skipped splice variants. Genes exhibiting similar behaviour as after EZH2i treatment are highlighted with black arrows. Biological replicates = 4, * p value < 0.05 (t test, paired, 2-tailed).
Fig. 4
Fig. 4. CELF2 acts as a tumour-suppressor in CML cells.
A Stable over-expression of CELF2 in K562 cells. B Growth curve assay of K562 cell lines stably expressing CELF2 (pL- CELF2) or an empty control plasmid (pL). Cells were seeded at 200 000 cells per ml of growth medium, and cell numbers were measured on the 3 following days. Results summarize 2 independent experiments. C The ability to form colonies was determined in CELF2 over-expressing or control cells. Colony forming units (CFUs) are given relative to control cells. D To determine the effect of EZH2 inhibitor treatment on CFUs, K562 cells were treated with 2 µM for 3 days prior to seeding in Matrigel. E Western blots showing that EZH2 inhibitor treatment (2 µM, 3 days, right panel) as well as genetic inactivation of EZH2 via CRISPR/Cas9 (left panel) leads to loss of H3K27me3 and CELF2 protein up-regulation. GAPDH, LAMIN A/C, and H3 proteins served as loading controls. F CELF2 over-expressing K562 cells remain sensitive to Imatinib and CELF2 over-expression together with TKI treatment elicits increased effects on colony formation (left panel) and cell viability (right panel). Cells were grown for 3 days with or without Imatinib, then either seeded on Matrigel, or subjected to CTG assays. Experiments were performed in triplicates. G Expression of CELF2 in the TKI sensitive CML cell line AR230-s, as well as in its TKI resistant counterpart AR230-r, leads to decreased cell viability. CTG assays were conducted in triplicates. H TF1-GFP or TF1-BCR::ABL1 leukaemia cells were used as models to examine a potential dependence of CELF2 on the presence of BCR::ABL1. Cell lines over-expressing CELF2 or an empty control vector were generated and Western blot was performed to confirm CELF2 over-expression. I CTG assay was used to assess cell viability of growth factor dependent TF1-GFP or BCR::ABL1-driven TF1-BCR::ABL1 cells upon CELF2 expression. J CTG assays of TF1 cell lines treated with increasing concentrations of the TKI imatinib for 72 h. K The leukaemia cell line THP-1 served as additional model to test the role of CELF2 in a non BCR::ABL1 driven setting. Overexpression leads to reduced cell viability as seen in the right panel (CTG assay, biological triplicates). All statistical analysis presented in this figure were conducted employing the t test (paired, 2-sided). * indicates a p value < 0.05.
Fig. 5
Fig. 5. Splicing regulation by CELF2.
A Differential splicing events in K562 cells after CELF2 over-expression determined with our in-house perl script. Plot on the left gives differential splice indices (ΔSI) of annotated isoforms (ISO), skipped exons (SE), and retained introns (RI), table on the right summarizes up- and down-regulated events, as well as the number of associated genes. B Heatmaps presenting ΔSI values at differential slicing events found after EZH2 inhibition, together with the corresponding ΔSI values observed after CELF2 over-expression. Red: up, blue: down. The black square highlights splicing events significantly up- or down-regulated in both scenarios. C The CDC14B isoform ex12-16 is increased upon EZH2 inhibitor treatment or CELF2 overexpression (perl script). D Analysis of exon-junction covering reads reveals that EZH2 inhibition or CELF2 expression leads to a shift from CDC14B isoforms containing exon 3 with a premature stop codon (shown as inverted red triangle), to isoforms skipping exon 13. Left panel: overview of CDC14B isoforms distinguishable by diagnostic exon-junction covering reads (shown as lines underneath the boxes that represent exons). Right panel: black numbers: reads covering the relevant diagnostic junctions were counted, and are given as ratio between treated samples (EZH2 inhibitor, pL-CELF2) over corresponding controls (DMSO, pL). Note that treatment leads to a relative enrichment of isoforms lacking exon 13 (see orange numbers, showing their increased presence relative to exon 13 containing isoforms). E DsiRNA (Dicer-Substrate Short Interfering RNA) mediated knock-down of exon 13 containing isoforms (ex13), but not the exon 13 skipping isoform ex12-15, leads to reduced cell viability and colony formation ability in K562 cells. * p value < 0.05 (t test, paired, 2-tailed). F Volcano plot showing differential gene-expression after CELF2 expression in K562 cells. G Gene set enrichment analysis of top ranked “Hallmark” genes upon CELF2 over-expression.
Fig. 6
Fig. 6. Splicing landscape in CML.
A Alternative splicing events in CD34+ cells from CML patients exhibiting differential splicing compared to CD34+ from healthy donors (HD) determined with our in-house perl script. Plot on the left gives differential splice indices (ΔSI) of annotated isoforms (ISO), skipped exons (SE), and retained introns (RI), table on the right summarizes up- and down-regulated events, as well as the number of associated genes. B Percentage of differentially expressed genes from the GO categories “RNA-splicing” and “Development” in CD34 + CML patient samples compared to CD34+ control samples. Up-regulated genes are presented in red, down-regulated genes in blue. C Bar-graph showing the differential expression of selected splicing genes in CML patients. The blot encompassed genes previously identified as EZH2 targets in K562 cells. Red: up-regulated, blue: down-regulated. D Basal expression levels of genes from (E) in CD34+ control samples determined by RNA-seq. E Normalized read counts of CELF2 in CD34+ healthy donor (HD) and CML chronic phase (CP) patient samples. F H3K27me3 levels at the CELF2 promoter in CML (pink) and non-CML (grey) haematopoietic stem/progenitor cells (HSCs/HPCs) as determined by ChIP-seq. Figure was generated using the dataset PRJEB8291. Tracks represent normalized read counts and the same scale is used for all samples. BM: samples derived from bone marrow, PB: derived from peripheral blood, CP: chronic phase (G) CELF2 promoter H3K27me3 levels in non-CML (black, grey) and CML CD34+ cells in chronic phase (CP, pink) or blast phase (BP, green). Data was derived from the previously published ChIP-seq dataset PRJNA777969, tracks are shown using the same scale. BM: samples derived from bone marrow, PB: derived from peripheral blood.
Fig. 7
Fig. 7. Role of CELF2 in splicing, gene expression and colony formation in CML.
A Differential splice index values (ΔSI) for ISO, SE, and RI splice events found differentially spliced upon CELF2 over-expression in CML patient samples (left chart). The table on the right summarized the number of de-regulated events and associated genes. B Heatmaps presenting ΔSI values at differential splicing events found after CELF2 over-expression in CML patient samples, together with the corresponding ΔSI values observed in CML versus HD samples. Red: up, blue: down. The black square highlights splicing events with opposing regulation patterns. C Enrichment plots of the “cMyc gene set V1” in CML patients (left blot) and after CELF2 over-expression in CML patient samples (right blot). In between, a heatmap represents the log2 fold-change expression values of genes in the “cMyc gene set V1”. D Colony forming ability of CML samples was assessed after treatment with the EZH2 inhibitor GSK126, or CELF2 over-expression. CP: chronic phase, BM: samples derived from bone marrow, PB: derived from peripheral blood. E Correlation between EZH2 and CELF gene family members in 9 selected TCGA datasets. Correlation coefficients associated with p values < 0.05 are plotted in red (positive correlation) or blue (negative correlation). BRCA breast cancer, COAD colon adenocarcinoma, GBM glioblastoma, LUAD lung adenocarcinoma, LUSC lung squamous cell carcinoma, STAD stomach adenocarcinoma, TGCT testicular germ cell tumour, THYM thymoma, UCEC uterine corpus endometrial carcinoma.

References

    1. Brown SJ, Stoilov P, Xing Y. Chromatin and epigenetic regulation of pre-mRNA processing. Hum Mol Genet. 2012;21:R90–96. - PMC - PubMed
    1. Luco RF, Pan Q, Tominaga K, Blencowe BJ, Pereira-Smith OM, Misteli T. Regulation of alternative splicing by histone modifications. Science. 2010;327:996–1000. - PMC - PubMed
    1. Tellier M, Maudlin I, Murphy S. Transcription and splicing: a two-way street. Wiley Interdiscip Rev RNA. 2020;11:e1593. - PubMed
    1. Bradley RK, Anczukow O. RNA splicing dysregulation and the hallmarks of cancer. Nat Rev Cancer. 2023;23:135–55. - PMC - PubMed
    1. Cherry S, Lynch KW. Alternative splicing and cancer: insights, opportunities, and challenges from an expanding view of the transcriptome. Genes Dev. 2020;34:1005–16. - PMC - PubMed

MeSH terms

LinkOut - more resources