. 2025 Apr 2;15(4):767-792.
doi: 10.1158/2159-8290.CD-24-0605.

Spatially Resolved Tumor Ecosystems and Cell States in Gastric Adenocarcinoma Progression and Evolution

Affiliations

Spatially Resolved Tumor Ecosystems and Cell States in Gastric Adenocarcinoma Progression and Evolution

Haoran Ma et al. Cancer Discov. .

Abstract

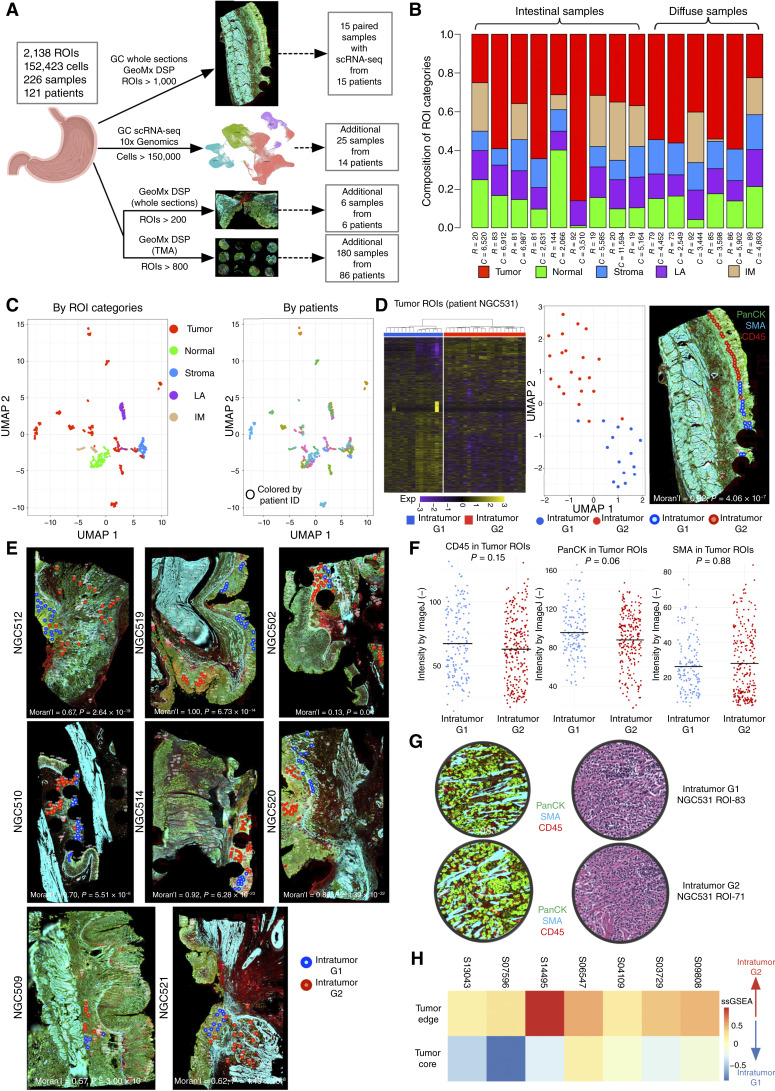
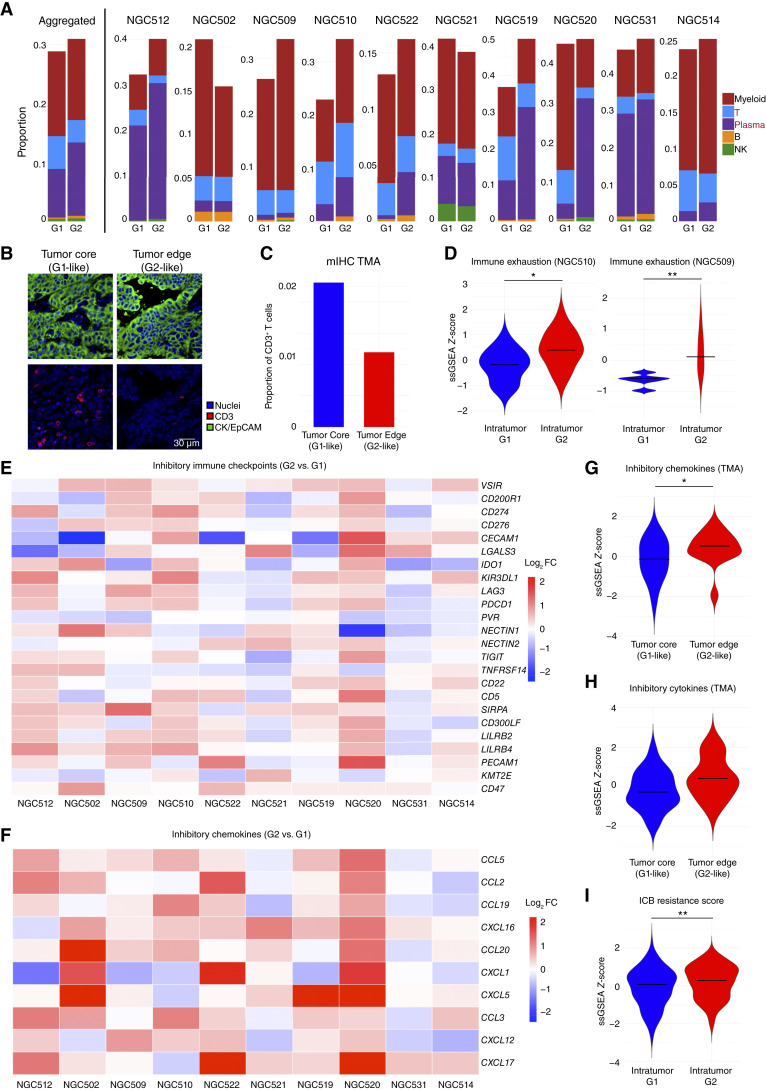
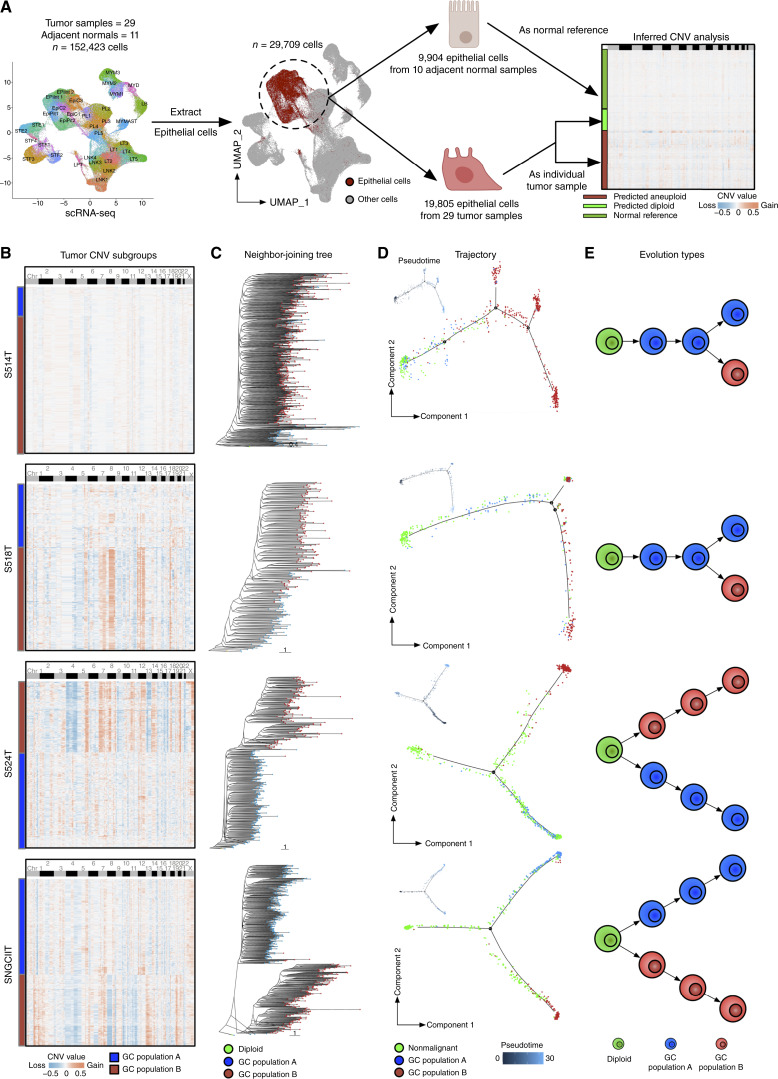
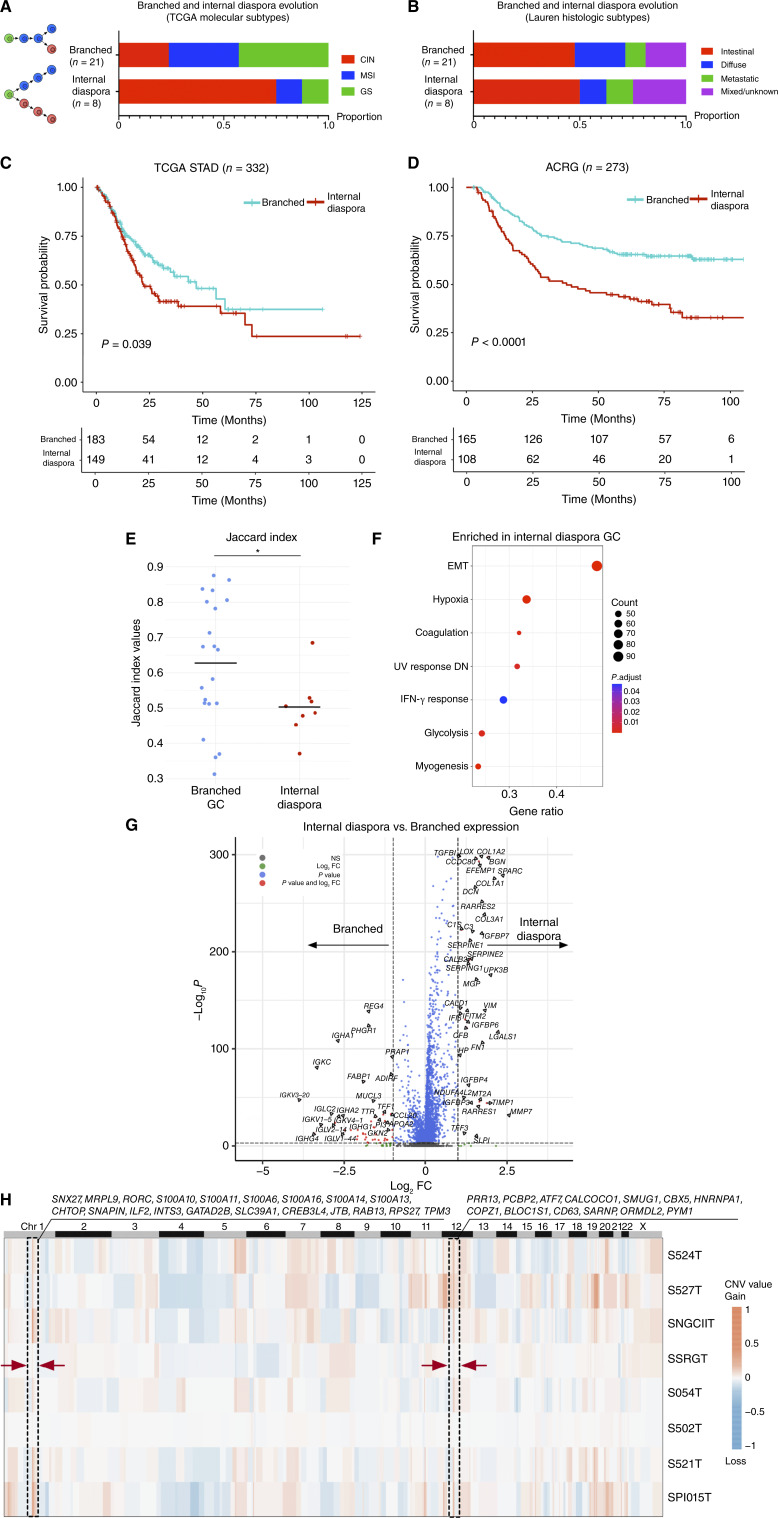
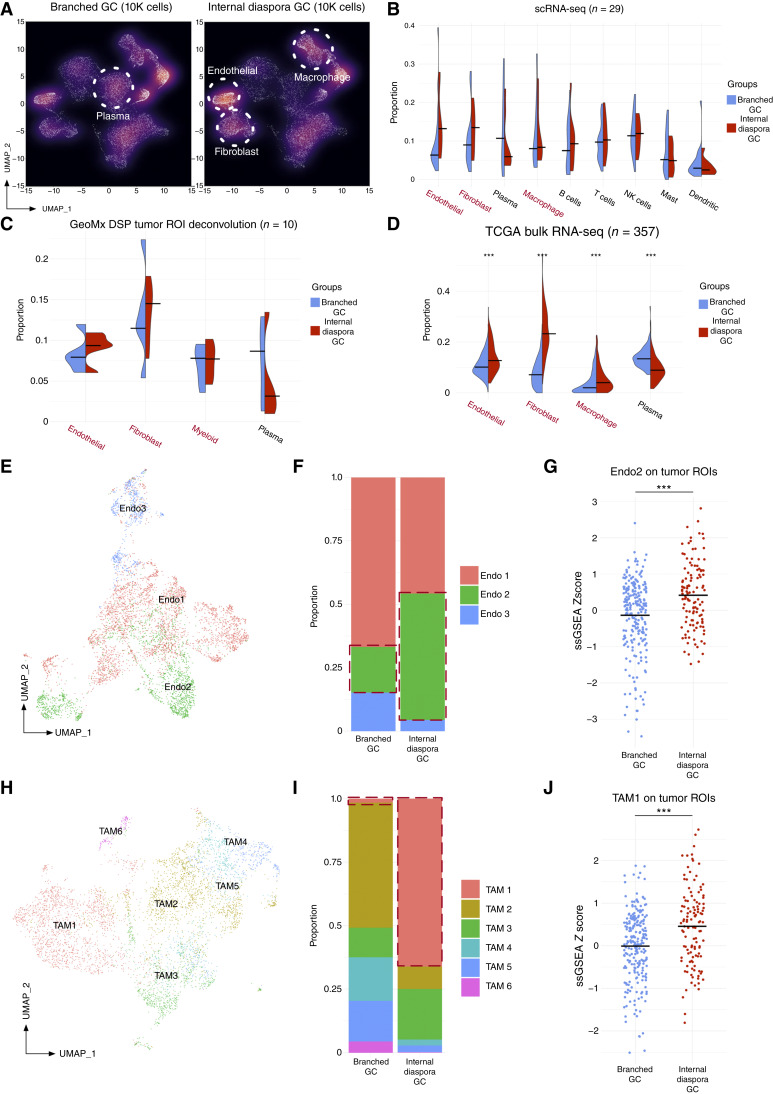
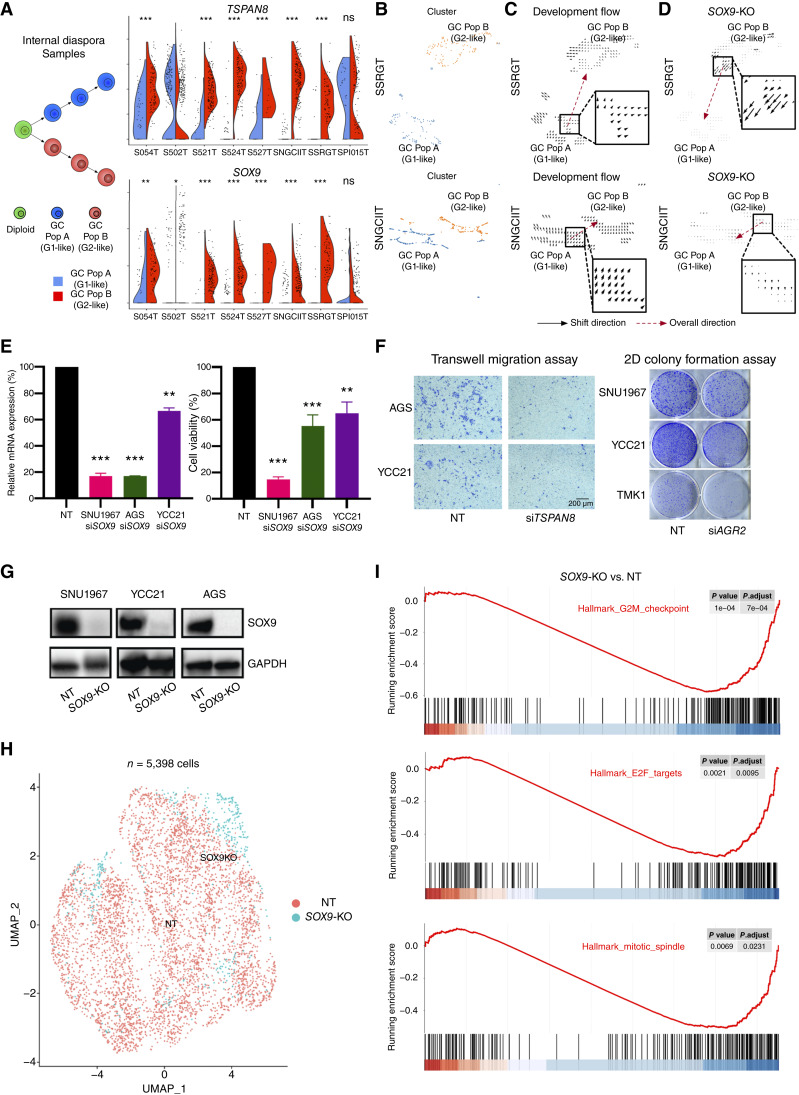
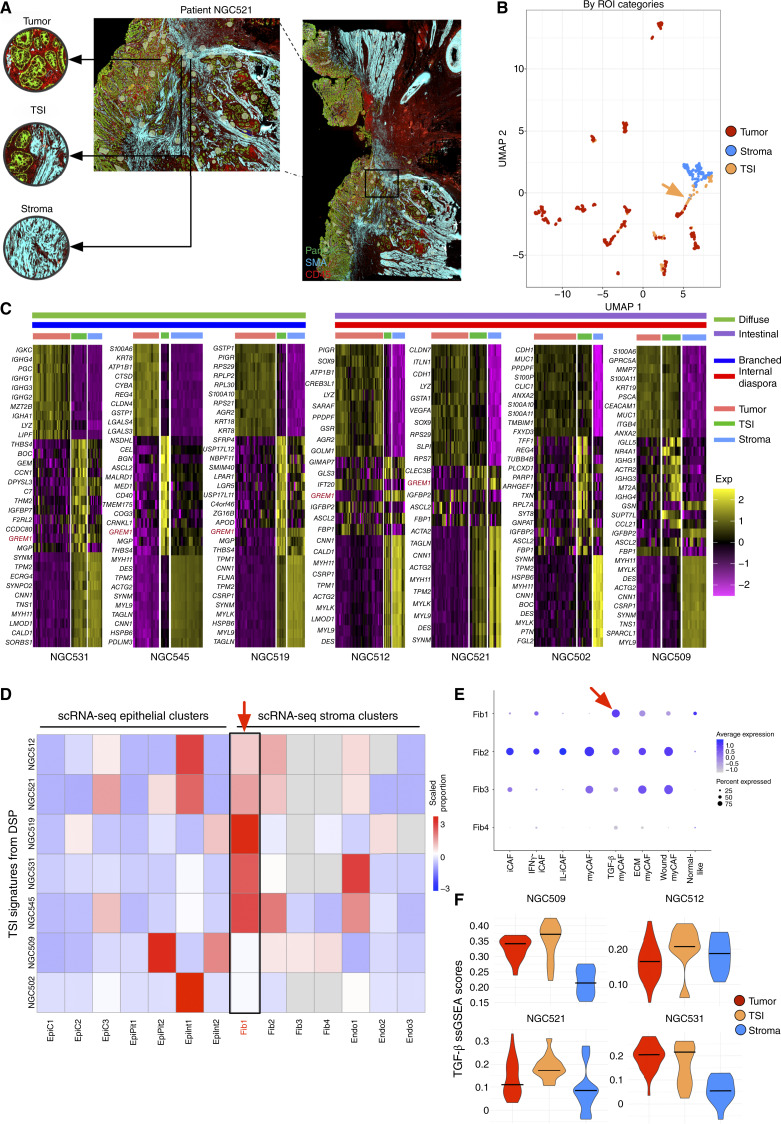
Integration of spatial transcriptomic (GeoMx Digital Spatial Profiler) and single-cell RNA sequencing data from multiple gastric cancers identifies spatially resolved expression-based intratumoral heterogeneity, associated with distinct immune microenvironments. We uncovered two separate evolutionary trajectories associated with specific molecular subtypes, clinical prognoses, stromal neighborhoods, and genetic drivers. Tumor-stroma interfaces emerged as a unique state of tumor ecology.


Conflict of interest statement

J.J. Zhao reports grants from the National University Health System Seed Fund (NUHSRO/2024/008/RO5+6/Seed-Sep23/01), National University Hospital Junior Research Award 2023 (JRA/Sep23/002), Chan Heng Leong Education & Research Fund 2024 award by the National University Hospital Singapore, 2025 Conquer Cancer Merit Award by Conquer Cancer, the ASCO Foundation, and Dean’s Research Development Award awarded by the Yong Loo Lin School of Medicine, National University of Singapore, outside the submitted work. R. Sundar reports grants from the National Medical Research Council during the conduct of the study and other support from Astellas, AstraZeneca, Bayer, BeiGene, Bristol Myers Squibb, Daiichi Sankyo, DKSH, Eisai, GSK, Merck, MSD, Novartis, Pierre-Fabre, Sanofi, Taiho, Tavotek, Eli Lilly, Ipsen, Roche, CytoMed, Paxman, and Teladoc outside the submitted work. No disclosures were reported by the other authors.

Figures

Figure 1.
Figure 1.
Spatially resolved ITH in gastric cancer. A, Schematic depiction of study datasets. The study contains 2,138 GeoMx DSP ROIs and 152,423 scRNA-seq single-cell profiles across 226 samples from 121 individual patients with gastric cancer. Fifteen patients were analyzed by GeoMx DSP and paired scRNA-seq, 14 patients by scRNA-seq only, 6 patients from an additional GeoMx DSP validation set, and 86 patients on TMAs. B, Bar chart of the proportional distribution of ROI types across 15 samples (nine intestinal and six diffuse). ROIs were categorized into five types, namely tumor, normal, stroma, LA, and intestinal metaplasia (IM), based on morphology and cell type–specific markers from serial paired H&E-stained images. The number of ROIs (represented as “R”) and the number of paired scRNA-seq cells (represented as “C”) are shown below the proportion bar for each patient. C, UMAP projections of ROIs, distinguished by ROI categories (left). A separate color-coded representation of the same UMAP based on patients is on the right. Each UMAP point represents an ROI. D, Unsupervised heatmap clustering (left) displays two distinct intratumor subgroups based on gene expression (Exp) in patient NGC531, with each row representing a gene and each column an individual ROI. The UMAP projection (middle) further illustrates these subgroups, in which each point denotes an ROI. Right, The stained section is the same NGC531 image from A, onto which tumor ROIs have been overlaid as small circles with different colors indicating distinct intratumor subgroups. Spatial autocorrelation values (Moran’s I) and significance values for intratumor subgroups are shown at the bottom of the stained image (right). E, Stained GeoMx DSP slides annotated with intratumor subgroup labels derived from unsupervised clustering in eight more samples. Each circle within the stained slide represents a tumor ROI, with varied circle colors denoting different tumor subgroups. Spatial autocorrelation values (Moran’s I) and significance values for intratumor subgroups are shown for each sample. F, Intensity of CD45/PanCK/SMA IHC signals in tumor ROIs across samples. Blue dots represent G1 RNA-ITH ROIs, and red dots represent G2 RNA-ITH ROIs. P values were calculated using Wilcoxon rank-sum tests. G, Image showing H&E- and immunofluorescence-stained tissue sections showing representative G1 RNA-ITH and G2 RNA-ITH tumor areas. Both areas show scattered tumor cells in between immune cells and stroma. The morphology of the two areas is histologically similar. H, Heatmap of mapping scores based on signatures derived from GeoMx DSP intratumor subgroups applied to TMA data. Color intensities represent scaled average ssGSEA scores for each sample. Each square in the heatmap corresponds to an individual sample within the gastric cancer TMA cohort. GC, gastric cancer.
Figure 2.
Figure 2.
Immune heterogeneity in spatial intratumor subgroups. A, Bar chart of the proportion of deconvoluted immune cell types between intratumor subgroups (G1 and G2) in tumor ROIs in aggregated 10 GeoMx DSP samples (left of the vertical line) and in each individual sample (right). Samples were selected based on the number of tumor ROIs. Colors represent five different immune cell types, including myeloid, T, plasma, B, and NK cells. B, Representative stained slides of mIHC for tumor core (left) and tumor edge regions (right) in TMA sample S03729. Blue represents nuclei, red represents CD3, and green represents CK/EpCAM. The length of the scale bar represents 30 μm. C, Bar plot of the proportion of CD3+ T cells in tumor core and tumor edge ROIs by TMA mIF. Colors represent different tumor regions. D, Violin plot of scaled ssGSEA scores of immune exhaustion signatures (comprising genes such as LAG3, TIGIT, and PD1) on G1 and G2 subregions in two representative samples. Stars represent the statistical significance of the Wilcoxon test. Bars represent median values of the scaled ssGSEA score. E, Heatmap of log2 fold changes (log2 FC) in expression of inhibitory immune checkpoints between intratumor subgroups (G2 vs. G1) in 10 GeoMx DSP samples. Each row represents an immune checkpoint, and each column represents a GeoMx DSP sample. Colors represent log2 FC values between G2 and G1. F, Heatmap of log2 FCs in expression of inhibitory chemokines between intratumor subgroups (G2 vs. G1) in 10 GeoMx DSP samples. Each row represents an immune checkpoint, and each column represents a GeoMx DSP sample. Colors represent log2 FC values between G2 and G1. G, Violin plot of scaled ssGSEA scores of inhibitory immune chemokines on tumor core and tumor edge ROIs using the gastric cancer TMA cohort. Stars represent statistical significance of the Wilcoxon test. Bars represent median values of scaled ssGSEA scores. H, Violin plot of scaled ssGSEA scores of inhibitory cytokines on tumor core and tumor edge ROIs using the gastric cancer TMA cohort. Stars represent statistical significance of the Wilcoxon test. Bars represent median values of scaled ssGSEA scores. I, Violin plot of scaled ssGSEA scores of an immune checkpoint blockade resistance signature on G1 and G2 subregions in aggregated 10 samples. Stars represent the statistical significance of the Wilcoxon test. Bars represent the median values of the scaled ssGSEA score. (*, P < 0.05; **, P < 0.01; ***, P < 0.001; absence of a star represents non-significance, P ≥ 0.05).
Figure 3.
Figure 3.
Single-cell resolved evolutionary trajectories in gastric cancer. A, Workflow depiction for sCNA inference from scRNA-seq single-cell data. Adjacent normal epithelial cells from 10 adjacent normal samples were used as references (one normal sample was filtered out due to the lack of a matched tumor sample), and tumor epithelial cells from 29 patients were classified as diploid and aneuploid. B, Heatmap presenting inferred sCNA values for tumor subgroups within single-cell data for samples S514T, S518T, S524T, and SNGCIIT (from top to bottom). Rows represent individual cells, whereas columns correspond to genomic bin positions of 220 kb each. Color gradations indicate varying states of sCNA, with subgroups determined through unsupervised clustering based on Euclidean distances. C, Neighbor-joining tree constructed on the inferred sCNA values, with the tree rerooted to a diploid state for reference. Each dot on a tree branch represents a single cell, color-coded according to subgroup labels identified in B. D, Main panels show trajectory plots, whereas the top left panels show pseudotime graphics for nonmalignant cells and tumor cells from identified sCNA subgroups. Each dot represents a cell, color-coded by cell type. Solid lines in the trajectory plot are derived from single-cell expression data, indicating the developmental path of cells. Pseudotime analysis, with zero time points anchored to selected nonmalignant cells, use color gradations to represent estimated pseudotimes for each cell. E, The illustrated figure conceptualizes the two identified tumor evolution patterns in gastric cancer. Cells in green are depicted as diploids, whereas cells in blue and red symbolize two distinct tumor populations, each characterized by their sCNA patterns. GC, gastric cancer.
Figure 4.
Figure 4.
Internal diaspora evolution in gastric cancer progression and prognosis. A, Bar plots showing the proportion of TCGA molecular subtypes across internal diaspora and branched evolution gastric cancer samples, denoted by sample counts on bars. B, Bar plots showing the proportion of Lauren histologic subtypes across internal diaspora and branched evolution gastric cancer samples, denoted by sample counts on bars. C, Kaplan–Meier survival plot comparing internal diaspora and branched evolution patterns in TCGA gastric cancer samples (n = 332), as classified by single-cell–derived signatures. The blue survival curve represents patients with tumors exhibiting a branched evolution pattern, whereas the red curve denotes patients with tumors exhibiting an internal diaspora evolution pattern. D, Kaplan–Meier survival plot of internal diaspora vs. branched evolution in the ACRG (n = 273) classified by single-cell–derived signatures. The blue survival curve represents patients with tumors exhibiting a branched evolution pattern, whereas the red curve denotes patients with tumors exhibiting an internal diaspora evolution pattern. E, Bar chart of Jaccard indexes for two sCNA evolution types. Jaccard indexes were calculated among intratumor subgroups using the sCNA matrix within each sample. Bars represent mean values in each group. The star * indicates statistical significance using t tests (P < 0.05). F, GSEA dot plot shows upregulated pathways in internal diaspora evolution samples compared with branched evolution samples. Dot dimensions denote gene overlap counts with the Hallmark database, whereas colors represent GSEA enrichment significance. “DN” represents “down-regulated”. G, Volcano plot comparing gene expression between internal diaspora and branched evolution samples at the single-cell level. Axes indicate Log2 fold changes (log2 FC) and significance levels. H, A sCNA heatmap showing the average sCNA pattern of aneuploid cells from internal diaspora samples. Arrows and boxes highlight common large copy-number variation events (Chr1 and Chr12) across internal diaspora samples. Genes in these regions are listed. GC, gastric cancer; STAD, stomach adenocarcinoma.
Figure 5.
Figure 5.
Internal diaspora gastric cancer exhibits a unique TME. A, UMAP density plots comparing internal diaspora and branched gastric cancer samples. Each dot represents a single cell, with solid circles emphasizing predominant cell populations. As the x–y positioning of cell clusters in the UMAP density plots are often affected by the number of cells, to enable an intuitive visual comparison, we utilized 10,000 randomly downsampled cells for each type. B, Split violin plot of cell type proportions comparing branched evolution and internal diaspora evolution samples from gastric cancer scRNA-seq tumor samples (29 patients). Median values are indicated by bars. C, Split violin plot of deconvoluted cell type proportions comparing branched evolution and internal diaspora evolution samples from gastric cancer GeoMx DSP tumor ROIs (10 patients). Median values are indicated by bars. D, Split violin plot of cell type proportions comparing branched and internal diaspora evolution from TCGA samples mapped by single cell–derived signatures (357 patients). Median values are indicated by bars. Stars represent statistical significance of the Wilcoxon test between branched evolution and internal diaspora gastric cancer. E, UMAP of endothelial subclusters in gastric cancer scRNA-seq samples. Colors indicate different endothelial subtypes (Endo1–Endo3). F, Bar plot of proportions of distinct endothelial subclusters identified in gastric cancer scRNA-seq. The left bar represents these proportions in branched gastric cancer samples, whereas the right bar represents the proportions in internal diaspora gastric cancer samples. Different colors denote distinct endothelial subclusters. G, Dot plot of Endo2 signature mapping scores on GeoMx DSP tumor ROIs. Gastric cancers analyzed by GeoMx DSP were categorized by evolution type using matched scRNA-seq assignments. Scores were z-transformed ssGSEA scores using Endo2 signatures derived from scRNA-seq data. Colors of the dots represent the two evolution types. Stars represent Wilcoxon test statistical significance between branched and internal diaspora gastric cancer. Bars represent the median values of scaled ssGSEA scores. H, UMAP of TAM subclusters in the gastric cancer scRNA-seq dataset. Colors indicate different TAM subtypes (TAM1–TAM6). I, Bar plots of the distribution of various TAM subclusters within the gastric cancer scRNA-seq dataset. The left bar represents the proportion of each TAM subcluster in branched gastric cancer samples, whereas the right bar shows distributions in internal diaspora gastric cancer samples. Different colors in the chart distinguish between the various TAM subclusters. J, Dot plot of TAM1 signature mapping scores on GeoMx DSP tumor ROIs. Scores were z-transformed ssGSEA scores using TAM1 signatures derived from scRNA-seq data. Colors of the dots represent the two evolution types. Stars represent Wilcoxon test statistical significance between branched and internal diaspora gastric cancer. Bars represent median values of scaled ssGSEA scores. (*, P < 0.05; **, P < 0.01; ***, P < 0.001; without stars represents not significant, P ≥ 0.05). GC, gastric cancer.
Figure 6.
Figure 6.
Candidate drivers of internal diaspora evolution. A, Split violin plots of TSPAN8 and SOX9 expression between gastric cancer population A (G1-like) and B (G2-like) in internal diaspora samples. The left subfigure depicts the evolution of the two populations in internal diaspora samples. Stars above the violin plots represent the significance of the Wilcoxon test between expression in G1 RNA-ITH and G2 RNA-ITH regions. B, UMAP of single cells in two representative internal diaspora samples (SSRGT and SNGCIIT). Cells were normalized, clustered using Scanpy, and colored by gastric cancer populations A (G1-like) and B (G2-like). C, Development vector field plots in two internal diaspora samples (SSRGT and SNGCIIT) using CellOracle. Arrows represent the direction of shift between cell states of gastric cancer population A (G1-like) to B (G2-like). D,SOX9 KO simulation vector field plots in two internal diaspora samples (SSRGT and SNGCIIT) using CellOracle. Arrows represent the direction of shift between cell states of gastric cancer population B (G2-like) to A (G1-like). E, Relative mRNA expression (left) and relative cell viability (right) of NT and SOX9 siRNA gastric epithelial cells (SNU1967, AGS, and YCC21). Statistical significance was determined using Student t test. F, Transwell migration assay after TSPAN8 siRNA in gastric epithelial cells (AGS and YCC21; left), and 2D colony formation assay after AGR2 siRNA in gastric epithelial cells (SNU1967, YCC21, and TMK1; right). G, Confirmation of SOX9 CRISPR KO at the protein level in NT and SOX9 CRISPR KO gastric epithelial cells (SNU1967, AGS, and YCC21; representative of three independent experiments). H, UMAP of integrated SOX9 KO and NT scRNA-seq (5,398 cells). Each dot on the UMAP represents a cell, and the color of the dot denotes a SOX9 KO (in blue) or NT cell (in red). I, GSEA enrichment score curves plot of the top enriched pathways between SOX9 KO and NT cells. G2M checkpoint, EF2 targets, and MITOTIC spindle pathway activity is downregulated in SOX9 KO cells compared with NT cells. (*, P < 0.05; **, P < 0.01; ***, P < 0.001; ns, P ≥ 0.05). GC, gastric cancer; Pop, population.
Figure 7.
Figure 7.
TSIs represent a unique TGF-β–mediated cell state. A, Stained GeoMx DSP slide of a specific region from patient NGC521 showing the selection of tumor, TSIs, and stroma ROIs. This region is a zoom-in from the larger NGC521 section (right, black box) shown in Fig. 1E. B, UMAP visualization of the ROIs and tumor/stroma ROIs in the gastric cancer GeoMx DSP dataset. Each dot represents an ROI. Color variations represent ROI categories. TSI ROIs are highlighted with a dotted circumference. C, Expression heatmap of signature genes for tumor, TSI, and stroma ROIs in seven samples after filtering by the number of TSI ROIs. For the heatmap, each row represents a signature gene, and each column represents an individual ROI. The chromatic gradient on the heatmap designates normalized expression intensities of signature genes within individual ROIs. Lauren classification, evolution subtype, and ROI categories are colored as different annotation bars above the heatmap. GREM1 expression is highlighted in red. D, Heatmap displaying the proportions of mapped gastric cancer scRNA-seq cluster labels in corresponding GeoMx DSP samples, determined by CIBERSORTx. Each row corresponds to a GeoMx DSP sample, whereas columns represent different single-cell clusters within the sample. Color intensities reflect the scaled proportions of each cluster. E, Dot plot illustrating the expression of CAF subtype signatures in the gastric cancer scRNA-seq fibroblast clusters. The size of the dot represents the proportion of signature-consistent cells within a cluster, and the dot color represents the scaled average expression of different CAF subtypes. F, Violin plot showing expression of TGF-β gene programs in epithelial, TSI, and stroma ROIs in GeoMx DSP data. The y-axis represents the ssGSEA scores of TGF-β gene program enrichment in each ROI. Exp, expression; Fib, fibroblast.

Similar articles

Cited by

References

    1. Morgan E, Arnold M, Camargo MC, Gini A, Kunzmann AT, Matsuda T, et al. . The current and future incidence and mortality of gastric cancer in 185 countries, 2020–40: a population-based modelling study. EClinicalMedicine 2022;47:101404. - PMC - PubMed
    1. Ferlay J, Colombet M, Soerjomataram I, Parkin DM, Piñeros M, Znaor A, et al. . Cancer statistics for the year 2020: an overview. Int J Cancer 2021;149:778–89. - PubMed
    1. Alsina M, Arrazubi V, Diez M, Tabernero J. Current developments in gastric cancer: from molecular profiling to treatment strategy. Nat Rev Gastroenterol Hepatol 2023;20:155–70. - PubMed
    1. Kelly RJ, Bever K, Chao J, Ciombor KK, Eng C, Fakih M, et al. . Society for Immunotherapy of Cancer (SITC) clinical practice guideline on immunotherapy for the treatment of gastrointestinal cancer. J Immunother Cancer 2023;11:e006658. - PMC - PubMed
    1. The Cancer Genome Atlas Research Network . Comprehensive molecular characterization of gastric adenocarcinoma. Nature 2014;513:202–9. - PMC - PubMed