. 2025 Jan 7;16(1):469.
doi: 10.1038/s41467-024-55741-6.

Mitotic block and epigenetic repression underlie neurodevelopmental defects and neurobehavioral deficits in congenital heart disease

Affiliations

Mitotic block and epigenetic repression underlie neurodevelopmental defects and neurobehavioral deficits in congenital heart disease

George C Gabriel et al. Nat Commun. .

Abstract

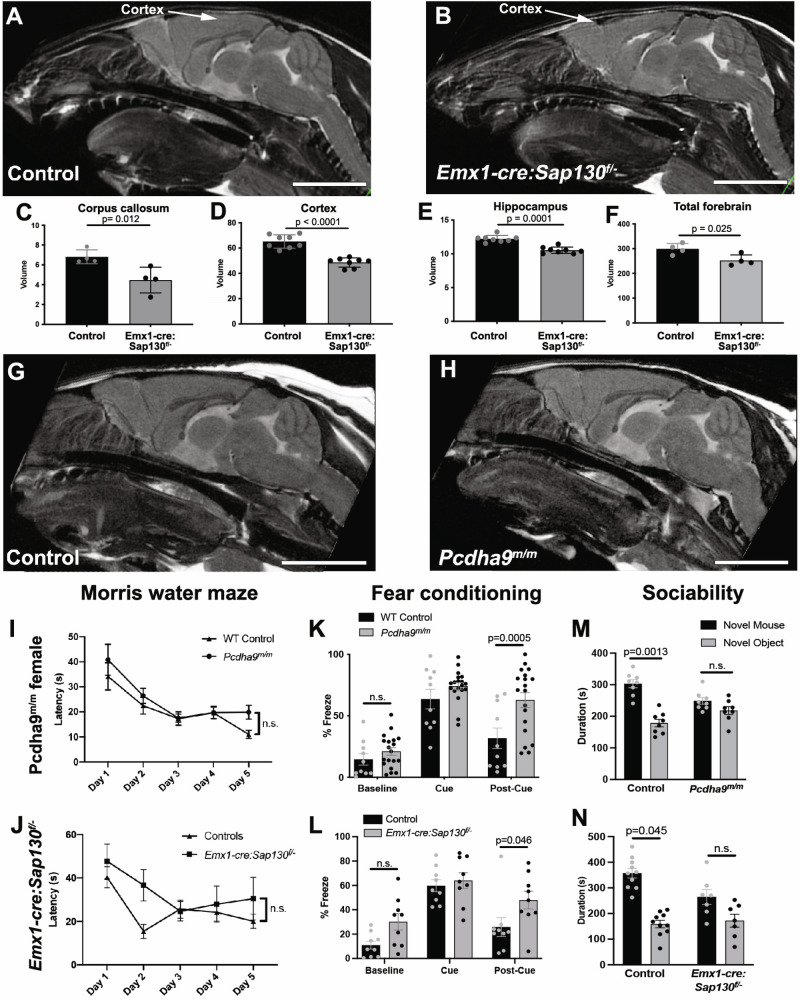
Hypoplastic left heart syndrome (HLHS) is a severe congenital heart disease associated with microcephaly and poor neurodevelopmental outcomes. Here we show that the Ohia HLHS mouse model, with mutations in Sap130, a chromatin modifier, and Pcdha9, a cell adhesion protein, also exhibits microcephaly associated with mitotic block and increased apoptosis leading to impaired cortical neurogenesis. Transcriptome profiling, DNA methylation, and Sap130 ChIPseq analyses all demonstrate dysregulation of genes associated with autism and cognitive impairment. This includes perturbation of REST transcriptional regulation of neurogenesis, disruption of CREB signaling regulating synaptic plasticity, and defects in neurovascular coupling mediating cerebral blood flow. Adult mice harboring either the Pcdha9 mutation, which show normal brain anatomy, or forebrain-specific Sap130 deletion via Emx1-Cre, which show microcephaly, both demonstrate learning and memory deficits and autism-like behavior. These findings provide mechanistic insights indicating the adverse neurodevelopment in HLHS may involve cell autonomous/nonautonomous defects and epigenetic dysregulation.


Conflict of interest statement

Competing interests: The authors declare no competing interests.

Figures

Fig. 1
Fig. 1. Ohiam/m mice display microcephaly with brain abnormalities.
AD E16.5 wildtype A and Ohiam/m mutant mouse brains exhibiting moderate B and severe C forebrain hypoplasia, with the severe mutant also showing holoprosencephaly. The distribution of brain phenotype severity in Ohiam/m mice is shown in the pie chart D. EJ Episcopic confocal imaging of the head shown in the sagittal and coronal plane of a wildtype (+/+) E, H and two Ohiam/m mice, one with mild F, I and the other with severe G, J forebrain hypoplasia. Note hypoplastic F or absent G olfactory bulb, thin cortex F, G, hypoplastic corpus callosum I, and holoprosencephaly J. KN. Cresyl violet stained sections from control K, and two Ohia mutants with mild L vs. severe M forebrain hypoplasia. Quantification of 5 Ohia mutants and 5 littermate controls showed reduced cortical thickness N. Graph represents mean ± SD, p = 0.003 with 2-tailed unpaired t-test. Cx cortex, OB olfactory bulb, Cb cerebellum, CC corpus callosum, Lat V lateral ventricle, Holo holoprosencephaly. Scale bars = 0.5 mm. Source data are provided as a Source Data file.
Fig. 2
Fig. 2. Impaired cortical plate formation with loss of Tbr2+ intermediate progenitors in Ohiam/m mutant brain.
AL Sections of the brain of E16.5 control AD and Ohiam/m mutant mice with mild EH or severe IL forebrain hypoplasia were stained with cresyl violet A, E, I to delineate the brain tissue architecture. Antibody staining was conducted for markers of apical progenitor cells (Pax6 in B, F, J), intermediate progenitor cells (Tbr2 in C, G, K), and merged image showing both markers D, H, L. Boxed regions in panels A,E,I are shown in magnified view under darkfield illumination in BD, FH, JL respectively. MT Section of the cortical plate of E16.5 wildtype (MP) and mutant (QT) mouse brain was stained with antibodies to Satb2, marker for cortical layers II–IV (M, Q), Ctip2 for cortical layers V–VI (O, S), and Tbr1 (N, R) for cortical layer VI, and merged image showing all three markers (P, T). UY Quantification of number of cells stained by Pax6 (U, P = 0.9639), Tbr2 (V, P < 0.0001), Ctip2 (W, P = 0.2598), Tbr1 (X, P = 0.3494), and Satb2 (Y, P < 0.0001) in the brain of 5 Ohiam/m mutant and 5 littermate controls. Graphs represent mean ± SD. P-values were calculated by 2-tailed, unpaired t-test. Scale bars in A–L indicate 500 µm. Scale bars in MT indicate 100 µm. CP cortical plate, SVZ subventricular zone, VZ ventricular zone. Source data are provided as a Source Data file.
Fig. 3
Fig. 3. Neural progenitors in the cortical plate show mitotic block with increase in cell death and centrosome defects indicating role for multipolar spindles.
AH Comparison of the brain cortex from E14.5 Ohiam/m mutant (DF) vs. wildtype littermate embryos (AC) showed more pH3 and TUNEL staining (G) in the ventricular (VZ) and subventricular (SVC) zones in the mutants. A decrease was also noted in mitotic cells in anaphase-telophase (H, n = 3, Ohiam/m mutants, n = 3 littermate controls). IK Centrosomes were visualized by confocal microscopy in E14.5 brain tissue sections from 4 Ohiam/m mutant (n = 766) and 3 wildtype control (n = 1394) embryos using γ-tubulin (green) antibody staining. Coimmunostaining with Tbr2 was conducted to track cells in the intermediate zone that will give rise to cortical layers II–IV. 3D serial confocal imaging stacks were collected to investigate centrosome distribution. Commonly observed were paired centrosomes of similar size, predicting normal bipolar spindles I. Also observed were abnormal juxtapositioning of three or more centrosomes of varying sizes that would predict multipolar spindle defects J. The insets show magnified views of the same regions indicated by the arrowheads. Quantification showed a significant increase of the abnormal centrosomes in the mutant brain tissue (J, K). LR. Confocal imaging was conducted using MEFs from wildtype (n = 3) (L-N) and Ohiam/m mutant embryos (n = 3) (O–Q) with α-tubulin and γ-tubulin used to visualized the mitotic spindles. >500 cells analyzed per embryo. Mutant MEFs showed increase in multipolar spindles (R). SU. Ohiam/m MEFs showed reduction in the proportion of mitotic cells in anaphase/telophase (S) and an increase in lagging chromosomes during anaphase (T, U) Q, R. CP cortical plate, IZ intermediate zone, SVZ subventricular zone, VZ ventricular zone, P/M prophase/metaphase, A/T anaphase/telophase. Scale bars = 100 µm. All graphs represent mean ± SD. p-values were obtained using 2-way, unpaired t-test. Source data are provided as a Source Data file.
Fig. 4
Fig. 4. Transcriptome profiling shows dysregulated neurodevelopment in Ohiam/m mutants.
Differentially expressed genes (DEGs) recovered from RNASeq analysis of E14.5 Ohia mutant brain were analyzed for pathway enrichment using Metascape (A), Ingenuity Pathway Analysis (IPA) for upstream regulators of downstream neurodevelopmental outcomes (B, red for upregulated, green for downregulated), IPA canonical pathway (C), IPA curated CREB signaling pathway (D, purple outline indicates genes found to be differentially expressed, green fill indicates downregulated and red fill indicates upregulated DEGs), as well as ToppGene Disease analysis (E).
Fig. 5
Fig. 5. Dysregulated expression of genes associated with neurovascular coupling.
Modified IPA curated neurovascular coupling pathway illustrating dysregulated expression of genes involved in neurovascular coupling. DEGs identified in Ohia brain highlighted in purple outline.
Fig. 6
Fig. 6. Molecular profiling of Ohiam/m brain tissue with integration of genome-wide methylome with RNAseq and Sap130 ChIPseq analyzes.
A Increased methylation of CpG sites in a DMR found in Klf17 in the Ohiam/m brain tissue. B Venn diagrams show two-way intersection of downregulated DEGs with genes associated with DMR and three-way intersection of down regulated DEGs, genes associated with DMR, and genes recovered from Sap130 ChiPSeq. C, D ToppGene enrichment analysis for Mouse Phenotypes (C) and Diseases (D) recovered from the two-way intersection of the downregulated DEGs with genes associated with DMRs.
Fig. 7
Fig. 7. Sap130 chromatin immunoprecipitation sequencing analysis of mouse brain and examination of cilia in the Ohia brain tissue.
A Sap130 occupancy in the 5’ upstream promoter region of selected genes. B Motif enrichment analysis of the Sap130 ChIPseq target genes identified putative Sap130 DNA binding sequences. CF Pathways in GO Biological Process (C) and Cellular Components (D), as well as Human Phenotype (E), and Disease (F) terms recovered from ToppGene gene enrichment analysis of Sap130 ChIPseq target genes. GI Cilia visualization in sections of wildtype (G) and Ohiam/m mutant brain tissue (H) immunostained with Arl13b (cilia, green), γ-tub (centrosome, red) and DAPI. Quantification showed reduction of cilia in the mutant brain (I, n = 3 Ohia mutant and 4 littermate controls). The graph represents the mean ± SD, with P = 0.0274 determined by 2-tailed, unpaired t-test. Magnification in panels G and H are the same, with scale bar = 200 µm. Source data are provided as a Source Data file.
Fig. 8
Fig. 8. DEGs associated with disease and mouse phenotype are enriched in DMR and Sap130 ChIP binding sites in the Ohia mutant brain.
A Circle plots showing Disease and Mouse Phenotype association identified by ToppGene enrichment analysis of the down regulated DEGs (first column), genes that are both down regulated DEGs and DMR associated (second column) and genes that are down regulated DEGs, DMR associated, and ChIPseq target genes (third column). All three analyzes yielded the same Disease and Mouse Phenotype terms, but with differing p-values. B Circle plots showing Disease and Mouse Phenotype associations identified via ToppGene analysis of the genes with direct physical overlap of the DMRs and the ChIPseq binding sites.
Fig. 9
Fig. 9. Emx1-cre Sap130f/ mice show microcephaly with transcriptome profiling showing abnormal neurodevelopment.
A Wildtype newborn control (left) and Emx1-cre Sap130f/ mutant (right) brains. Scale bar = 500 µm. B Brain/body weight ratio for newborn control (n = 18) and Emx1-cre Sap130f/ (n = 6) mice confirm brain hypoplasia in the Emx1-cre Sap130f/ mice. C qPCR of Sap130 transcripts in E14.5 forebrain tissue from 4 control and 4 Emx1-cre Sap130f/ mice showed decrease in Sap130 transcripts, demonstrating efficacy of the Emx1-Cre mediated Sap130 deletion. The graph represents the mean ± SD, with P = 0.0108 determined by 2-tailed, unpaired t-test. D qPCR of Wdr62 transcripts in E14.5 forebrain tissue from 4 control and 4 Emx1-cre Sap130f/ mice showed increase transcript expression, indicating possible centrosome amplification. The graph represents the mean ± SD, with P = 0.0307 determined by 2-tailed, unpaired t-test. EH IPA and ToppGene analysis of DEGs from RNAseq of E14.5 forebrain tissue from Emx1-cre Sap130f/ vs. control mice. Shown are the results obtained with IPA Canonical Pathway analysis (E), Gene Set analysis (F) for hallmark centrosome, hypoxia, and mitotic spindle genes, and ToppGene analysis for Mouse Phenotype (G) and Disease (H). Source data are provided as a Source Data file.
Fig. 10
Fig. 10. Brain and behavioral analysis of Emx1-cre Sap130f/− and Pcdha9m/m adult mice.
AF MRI of the brain of adult wildtype (A), and Emx1-cre;Sap130f/ mice (B) showed significant reduction in brain volumes associated with the corpus callosum (C, n = 4 control, n = 4 mutant), the cerebral cortex (D, n = 8 control, n = 8 mutant), the hippocampus (E, n = 8 control, n = 8 mutant), and forebrain (F, n = 4 control, n = 8 mutant). The values shown represent mean ± SD. P-values were obtained using 2-way unpaired t-test. G, H MRI of the wildtype (G) and adult Pcdha9m/m mutant (H) mouse brain showed no detectable change in anatomical structure. Scale bars in panels A, B, G, H = 500 µm. IN. Neurobehavioral testing was conducted on Pcdha9m/m mice (I, K, M) and Emx1-cre:Sap130f/   mice (J, L, N) using three tests: Morris water maze (I, n = 18 control, n = 18 mutant; J, n = 11 control, n = 9 mutant), cued fear conditioning (K, n = 10 control, n = 19 mutant; L, n = 9 control, n = 9 mutant), and three chamber sociability test (M, n = 8 control, n = 8 mutant; N, n = 10 control, n = 7 mutant). In Pcdha9m/m female mice and male/female Emx1-cre:Sap130f/ mice, significant deficits were observed for fear conditioning (K, L) and sociability (M, N), but not in the Morris water maze (I, J). Similar analysis of Pcdha9m/m male mice showed no change relative to wildtype male mice (Supplementary Fig. 10). Morris water maze analyzed by 2-way repeated measures ANOVA, fear conditioning analyzed by 2-way repeated measures ANOVA, and sociability tests analyzed by two-way and three-way ANOVA. All graphs represent mean ± SD. Source data are provided as a Source Data file.

Update of

Similar articles

References

    1. Hoffman, J. I. & Kaplan, S. The incidence of congenital heart disease. J. Am. Coll. Cardiol.39, 1890–1900 (2002). - PubMed
    1. Marino, B. S. et al. Neurodevelopmental outcomes in children with congenital heart disease: evaluation and management: a scientific statement from the American Heart Association. Circulation126, 1143–1172 (2012). - PubMed
    1. Marelli, A., Miller, S. P., Marino, B. S., Jefferson, A. L. & Newburger, J. W. Brain in congenital heart disease across the lifespan. Circulation133, 1951–1962 (2016). - PMC - PubMed
    1. Marelli, A., Miller, S. P., Marino, B. S., Jefferson, A. L. & Newburger, J. W. Brain in congenital heart disease across the lifespan: the cumulative burden of injury. Circulation133, 1951–1962 (2016). - PMC - PubMed
    1. Gaynor, J. W. et al. Patient characteristics are important determinants of neurodevelopmental outcome at one year of age after neonatal and infant cardiac surgery. J. Thorac. cardiovascular Surg.133, 1344–1353. e3 (2007). - PMC - PubMed

LinkOut - more resources