. 2025 Feb;31(2):502-513.
doi: 10.1038/s41591-024-03407-7. Epub 2025 Jan 7.

Multi-omics-based mapping of decidualization resistance in patients with a history of severe preeclampsia

Affiliations

Multi-omics-based mapping of decidualization resistance in patients with a history of severe preeclampsia

Irene Muñoz-Blat et al. Nat Med. 2025 Feb.

Abstract

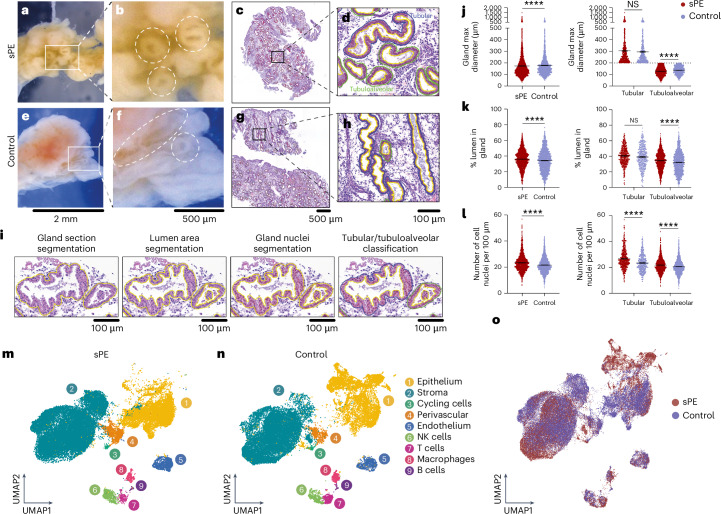
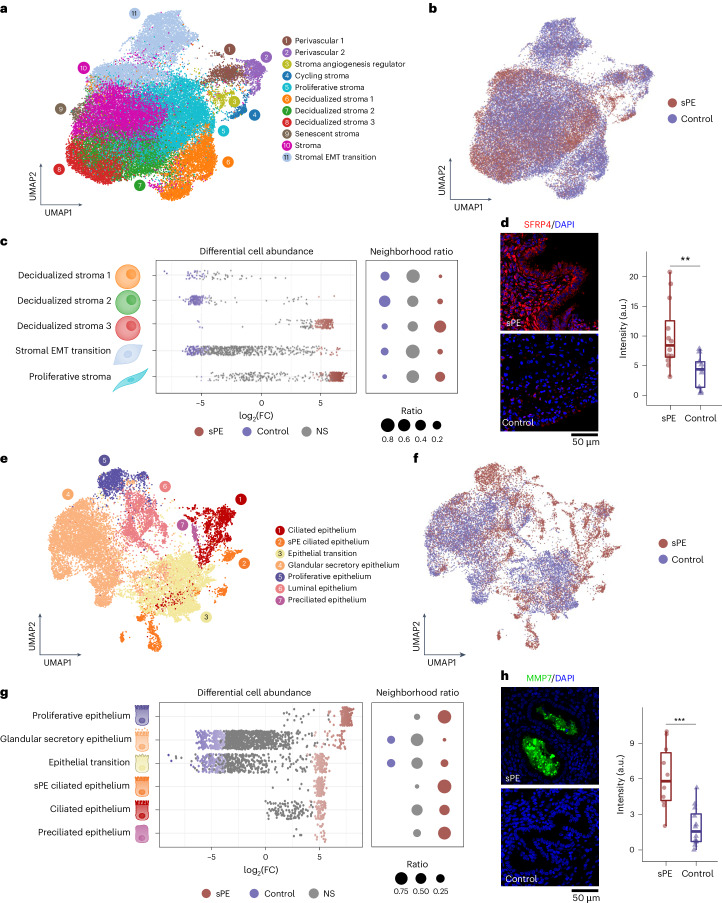
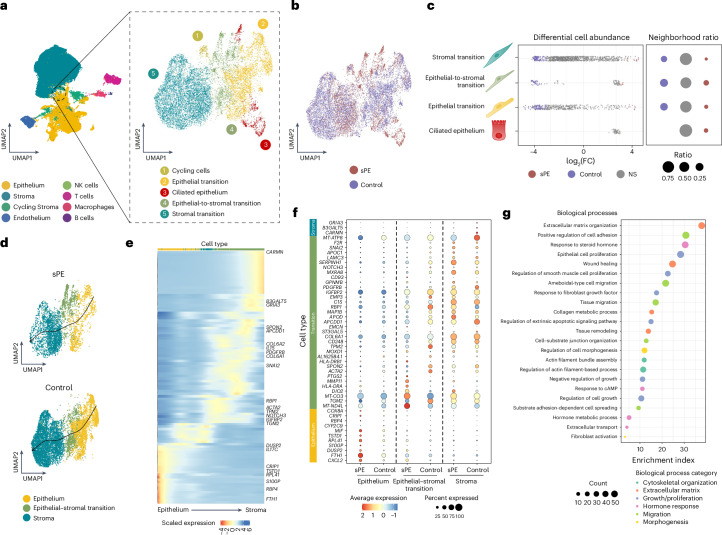
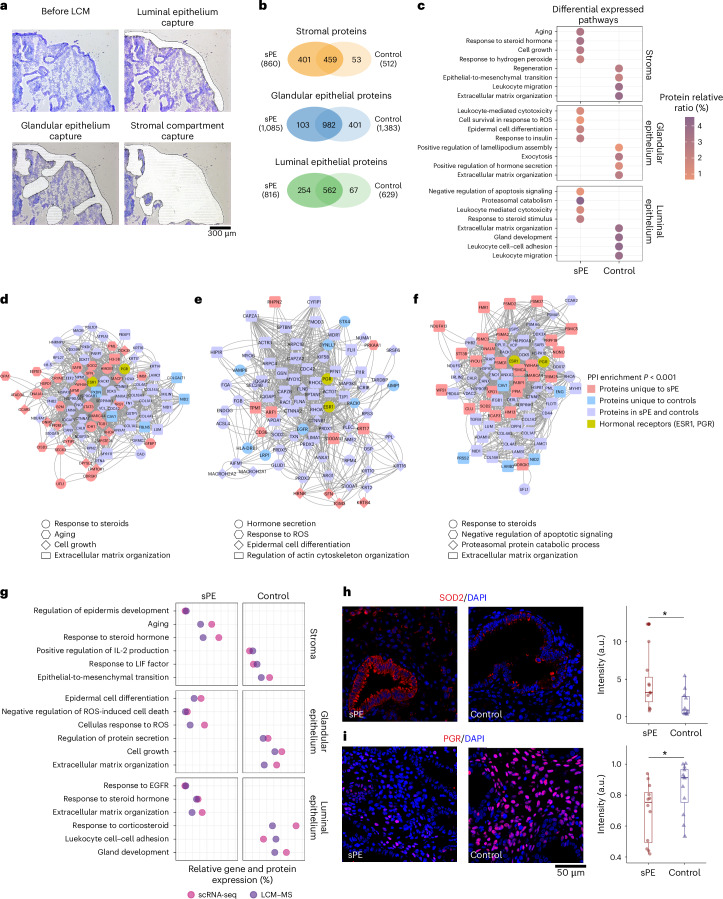
Endometrial decidualization resistance (DR) is implicated in various gynecological and obstetric conditions. Here, using a multi-omic strategy, we unraveled the cellular and molecular characteristics of DR in patients who have suffered severe preeclampsia (sPE). Morphological analysis unveiled significant glandular anatomical abnormalities, confirmed histologically and quantified by the digitization of hematoxylin and eosin-stained tissue sections. Single-cell RNA sequencing (scRNA-seq) of endometrial samples from patients with sPE (n = 11) and controls (n = 12) revealed sPE-associated shifts in cell composition, manifesting as a stromal mosaic state characterized by proliferative stromal cells (MMP11 and SFRP4) alongside IGFBP1+ decidualized cells, with concurrent epithelial mosaicism and a dearth of epithelial-stromal transition associated with decidualization. Cell-cell communication network mapping underscored aberrant crosstalk among specific cell types, implicating crucial pathways such as endoglin, WNT and SPP1. Spatial transcriptomics in a replication cohort validated DR-associated features. Laser capture microdissection/mass spectrometry in a second replication cohort corroborated several scRNA-seq findings, notably the absence of stromal to epithelial transition at a pathway level, indicating a disrupted response to steroid hormones, particularly estrogens. These insights shed light on potential molecular mechanisms underpinning DR pathogenesis in the context of sPE.


Conflict of interest statement

Competing interests: The authors declare no competing interests.

Figures

Fig. 1
Fig. 1. Morphological features in DR reflected in single-cell atlas in sPE and control conditions.
a, Representative image of one endometrial tissue collected during the late secretory phase from a woman with a previous sPE. b, Zoom-in of the macroscopical glands of the endometrial tissue of a. Dashed circles highlight the glands. c, Representative H&E slides staining endometrial tissue of an sPE sample (n = 11). d, Zoom-in of endometrial tissue of an sPE sample and gland classification (n = 11). e, Representative image of one endometrial tissue collected during the late secretory phase from a control woman. f, Zoom-in of the macroscopical glands of the endometrial tissue of e. Dashed circle and dashed ellipsis highlight the glands. g, Representative H&E slides staining of cross-section endometrial tissue of a control sample (n = 9). h, Zoom-in of the representative H&E slides staining of longitudinal-section endometrial tissue of a control sample (n = 9). i, Segmentation and classification of tubular and tubuloalveolar glands for subsequent analysis. j, Violin plots representing maximum glandular diameter in sPE (n = 11) and control (n = 9) samples and detailed tubular and tubuloalveolar glandular classification. k, Violin plots representing the percentage of the lumen in glands in sPE (n = 11) and control (n = 9) samples and detailed tubular and tubuloalveolar glandular classification. l, Violin plots representing the number of cell nuclei in 100 µm in glands in sPE (n = 11) and control (n = 9) samples and detailed tubular and tubuloalveolar glandular classification. Two-sided Wilcoxon test (****P < 0.0001; NS, not significant). m, UMAP of single-cell integration of sPE cells (28,154) of the major cell types of the endometrium during the late secretory phase (n = 11). n, UMAP of single-cell integration of control cells (37,227) of the major cell types of the endometrium during the late secretory phase (n = 12). o, UMAP of the 65,381 high-quality cells of types of merged cells of both sPE and control samples.
Fig. 2
Fig. 2. Altered stromal and epithelial cell differentiation states of DR in patients with sPE.
a, UMAP of cell subpopulation identification of stromal and perivascular fractions of endometrium in the late secretory phase. b, UMAP of stromal merged cells of both sPE (n = 11) and control (n = 12) samples. c, Beeswarm plot of differential cell abundance by stromal cell subtypes. The x axis represents the log2(FC) in the abundance of sPE. Significant changes in cell abundance in each condition are represented in colors. Gray dots annotated as ‘NS’ represent not significant changes. d, IF validation of SFRP4 in sPE (n = 4) versus control (n = 4) samples and quantification of fluorescence intensity. Four biological replicates were conducted for each condition, with three technical replicates assessed for each biological replicate. In each boxplot, horizontal lines denote median values; boxes extend from the 25th to the 75th percentile; dots are the observations, and whiskers represent the s.d. Two-sided Wilcoxon statistical analysis (**P = 0.0073). e, Cell subpopulation identification of epithelial fraction of endometrium in the late secretory phase. f, UMAP of epithelial merged cells of both sPE and control samples. g, Beeswarm plot of differential cell abundance by epithelial cell subtypes. The x axis represents the log2(FC) in the abundance of sPE. Each dot represents a neighborhood; neighborhoods colored in blue represent those with a significant decrease in cell abundance in sPE conditions, while red dots are enriched in sPE samples. Gray dots annotated as ‘NS’ represent not significant changes. h, IF validation of MMP7 in sPE (n = 4) versus control (n = 4) samples and quantification of fluorescence intensity. Four biological replicates were conducted for each condition, with three technical replicates assessed for each biological replicate. Two-sided t test statistical analysis (***P = 0.0007). a.u., arbitrary units.
Fig. 3
Fig. 3. Absence of EMT in endometria with DR from patients with sPE.
a, Zoom-in of EMT and cell subpopulation identification of endometrium in the late secretory phase. Circle highlights the epithelial-to-stromal transition subpopulation. b, UMAP of EMT merged cells of both sPE and control samples. c, Beeswarm plot of differential cell abundance by EMT cell subtypes. The x axis represents the log2(FC) in the abundance of sPE. Significant changes in cell abundance in each condition are represented in colors. Gray dots annotated as ‘NS’ represent not significant changes. d, RNA velocity generated with scVelo of sPE and control samples of epithelial transition, epithelial-to-stromal transition and stromal transition subpopulations. The ciliated cell subtype was removed from trajectory inferences in downstream analysis. Arrows represent the cell trajectories across clusters, inferring differentiation cell trajectories. e, Expression patterns of landmark genes of the lineage 1 differentiation process. Average log2(FC) is represented by the color scale and cell subtypes by color. f, Dot plot of DEGs in sPE versus controls identified across pseudotime associated with stroma, epithelial-to-stromal transition and epithelium (color represents the average expression, and dot size refers to the percentage of cells of each cluster expressing each marker). g, GO analysis including DEGs from all cell subtypes labeled as EMT populations. The enrichment index was calculated by log(adjusted P). The adjusting method was FDR, and the threshold set was <0.05.
Fig. 4
Fig. 4. Dysfunctional cell-to-cell communication networks associated with altered cell composition in DR.
a,c,e,g,i, Chord plots displaying the CCC network of EDN (a), ncWNT (c), canonical WNT (e), semaphorin (SEMA3; g) and SPP1 (i) in sPE and control samples. Each colored dot represents a cell subtype. Color arrows represent the incoming signaling, and the thickness of the lines refers to the strength of the signal between cell subtypes. b,d,f,h, Bar plot of each ligand–receptor pair contributing to the CCC of EDN (b), ncWNT (d), WNT (f) and SEMA3 (h). j, IF validation of SPP1 in sPE (n = 4) versus control (n = 4) samples and quantification of fluorescence intensity. Four biological replicates were conducted for each condition, with three technical replicates assessed for each biological replicate. Two-sided t test statistical analysis (**P = 0.006). EDN, endoglin.
Fig. 5
Fig. 5. DR in samples from patients with sPE confirmed with spatial transcriptomics.
a, IF of enriched stromal ROIs selected of one representative sPE sample and unsupervised hierarchical clustering based on Pearson distances of the normalized data z scores of the top genes of enriched stromal ROIs. b, Volcano plots depicting DEGs between sPE and controls within stromal ROIs. c, IF of enriched glandular epithelial ROIs selected of one representative sPE sample and unsupervised hierarchical clustering based on Pearson distances of the normalized data z scores of the top genes of enriched glandular epithelium ROIs. d, Volcano plots depicting DEGs between sPE and controls within glandular epithelial ROIs. e, IF of enriched luminal epithelial ROIs selected from one representative sPE sample and unsupervised hierarchical clustering based on Pearson distances of the normalized data z scores of the top genes of enriched luminal epithelium ROIs. f, Volcano plots depicting DEGs between sPE and controls within luminal epithelial ROIs. Heatmap legend reflects info of groups (sPE in red and control in blue), and colors represent the ROI of each participant. LMM was applied to obtain DEGs. Volcano plot legend represents significant genes (P < 0.05) and NS genes (NS < 0).
Fig. 6
Fig. 6. Differential endometrial proteome associated with DR in patients with sPE compared to controls.
a, Endometrial section before laser capture microdissection and after isolating the ROI. Black solid line shows the isolated regions (sPE n = 7 and control n = 10). b, Venn diagrams showing the total number of proteins identified between sPE and controls in the stromal, glandular epithelium and luminal epithelium compartment. c, Differential expressed pathways specific to controls and sPE per region analyzed. Color gradient shows the protein ratio (%), which refers to what proportion of all the proteins detected in the region are proteins involved in the pathway. All pathways included are significantly enriched (adjusted P < 0.05). d, PPI network including those proteins involved in highlighted pathways in the stromal compartment. e, PPI network including those proteins involved in highlighted pathways in the glandular epithelium. f, PPI network including those proteins involved in highlighted pathways in the luminal epithelium. Colors show the specificity of proteins is indicated as follows: proteins unique to sPE, to controls, shared by both groups and ESR1 and PGR. Shape denotes the pathways. g, Dot plot showing the functional enrichment coincides between the spatial proteome (LCM–MS) and the DEGs at single-cell resolution (scRNA-seq). Left: sPE-specific pathways. Right: control-specific pathways. h, IF validation of SOD2 in sPE (n = 4) versus control (n = 4) samples and quantification of fluorescence intensity. i, IF validation of PGR in sPE (n = 4) versus control (n = 4) samples and quantification of fluorescence intensity. Four biological replicates were conducted for each condition, with three technical replicates assessed for each biological replicate. Two-sided Wilcoxon test statistical analysis (*P = 0.03). PPI, protein–protein interaction.
Extended Data Fig. 1
Extended Data Fig. 1. Experimental design and workflow of each technology.
Experimental design and workflow for processing endometrial biopsies from sPE and control samples of morphological analysis, single-cell RNA-seq, spatial transcriptomics and spatial proteomics.
Extended Data Fig. 2
Extended Data Fig. 2. Additional morphological parameters.
(a) Violin plots representing gland area (µm2) in sPE (n = 11) and control (n = 9) samples and detailed tubular and tubuloalveolar glandular classification. Two-tailed Wilcoxon test (**p = 0.0013), (****p < 0.0001). (b) Violin plots representing lumen solidity (0–1) in sPE (n = 11) and control (n = 9) samples and detailed tubular and tubuloalveolar glandular classification. Two-tailed Wilcoxon test (**p = 0.0027), (***p < 0.001). (c) Violin plots representing gland circularity (0–1) in sPE (n = 11) and control (n = 9) samples and detailed tubular and tubuloalveolar glandular classification. Two-tailed Wilcoxon test (***p < 0.001). (d) Representative H&E slides staining endometrial tissue of an sPE sample (sPE patient 1). (e) Representative H&E slides staining endometrial tissue of an sPE sample (sPE patient 2). (f) Representative H&E slides staining endometrial tissue of a control sample (control 1). (g) Representative H&E slides staining endometrial tissue of a control sample (control 2).
Extended Data Fig. 3
Extended Data Fig. 3. Expression of canonical markers in each identified cell type.
(a) Dot plot of the top canonical markers of the nine major cell populations identified. (b) Dot plot of the top canonical markers of the stromal cell subtypes. (c) Dot plot of the top canonical markers of the epithelial cell subtypes. (d) Dot plot of the top canonical markers of the cell types involved in the epithelial-to-stroma transition. Average log2(FC) is represented by the color scale; dot size represents the percentage of cells expressing that gene.
Extended Data Fig. 4
Extended Data Fig. 4. DEGs associated with DR in affected cell subpopulations.
(a) Dot plot representing DEGs (adjusted log10(p val)) of immune cells (macrophages, natural killers and B cells). (b) Dot plot representing DEGs (adjusted log10(p val)) of endothelium. (c) Dot plot representing DEGs (adjusted log10(p val)) of decidualized stroma 1, 2 and 3, stromal transition and proliferative stroma subpopulations. Average log2(FC) is represented by the color scale; dot size represents the percentage of cells expressing that gene. (d) Dot plot representing DEGs (adjusted log10(p val)) of proliferative epithelium, glandular secretory epithelium, epithelial transition, sPE ciliated epithelium and ciliated epithelium subpopulations. Average log2(FC) is represented by the color scale; dot size represents the percentage of cells expressing that gene.
Extended Data Fig. 5
Extended Data Fig. 5. Neighborhood graph represents the differential cell abundance.
(a) Stromal and perivascular cells, (b) epithelial cells and (c) epithelial-to-mesenchymal transition in late secretory endometrium. Dot size represents neighborhoods, while edges depict the number of cells shared between neighborhoods. Neighborhoods colored in blue represent those with a significant decrease in cell abundance in sPE and red highlights cells enriched in sPE. (d) Gene ontology analysis including altered genes from all cell subtypes labeled as sPE ciliated epithelium population. Dot size represents the number of DEGs involved in each biological process; color represents the general category to which the biological process is related. Enrichment index was calculated by −log(adj p value). Adjusting method was FDR, and threshold set was <0.05.
Extended Data Fig. 6
Extended Data Fig. 6. RNA velocity recapitulates dynamics of epithelial-to-stromal transition.
(a) The observed and the extrapolated future states (arrowheads) are shown. Cell subtypes are represented by color scale. (b) UMAP with the two computed lineages detected by Slingshot. Cell subtypes are represented by color scale, solid arrow represents lineage 1 and dotted arrow represents lineage 2. (c) UMAP with the computed pseudotime showing the differentiation vector map for lineage 1 and coupled with a density plot of each condition. (d) Histogram of the distribution of cells across the pseudotime. Counts (y axis) show the number of cells contributing to the pseudotime. (e) Expression patterns of landmark genes of the lineage 1 differentiation process. Average log2(FC) is represented by the color scale and cell subtypes by color.
Extended Data Fig. 7
Extended Data Fig. 7. Signaling pathways that are considered significant (p < 0.05) and enriched in the experimental group.
(a) Relative information flow (ratio). (b) Absolute value of biologically enriched pathways in each group. This analysis was made using the rankNet function and the results of the Wilcoxon test analysis. Estimation is based on the number of interactor molecules expressed (that is, ligand–receptor pairs) and the strength of this interaction (expression level; Methods). (c) Heatmap showing the contribution of signals to cell subpopulations in terms of cumulative outgoing signaling (sPE vs control). Bar graph illustrates the mapping of perturbations in communication networks to specific cell types. (d) Heatmap showing the contribution of signals to cell subpopulations in terms of cumulative incoming signaling (sPE vs control). Bar graph illustrates the mapping of perturbations in communication networks to specific cell types.
Extended Data Fig. 8
Extended Data Fig. 8. ROI classification in endometrial tissue.
(a) One representative sPE patient and (b) one representative control. Venn diagrams of the DEGs from the single-cell and spatial transcriptomic analysis. (c) DEGs from stromal and endothelial cells overlapped with DEGs from enriched stromal ROIs. (d) DEGs from stromal, endothelial and epithelial cells overlapped with DEGs from enriched glandular epithelial ROIs. (e) DEGs from stromal, endothelial and epithelial cells overlapped with DEGs from enriched luminal epithelial ROIs. (ROIs refer to regions of interest). (f) Chords plots displaying the CCC network of TENASCIN in sPE and control. Each colored dot represents a cell subtype. Color arrow represents de incoming signaling, and the thickness of the lines refers to the strength of the signal between cell subtypes.
Extended Data Fig. 9
Extended Data Fig. 9. Single-cell integration labeled by patient.
(a) Global, (b) stroma and (c) epithelium. Single-cell integration labeled by age of the donor of (d) global, (e) stroma and (f) epithelium. Single-cell integration labeled by time since last pregnancy of (g) global, (h) stroma and (i) epithelium.
Extended Data Fig. 10
Extended Data Fig. 10. Single-cell integration labeled by cell type of global integration.
(a) All samples, (b) sPE and (c) control. Single-cell integration labeled by cell type of stromal integration for (d) all samples, (e) sPE and (f) control. Single-cell integration labeled by cell type of epithelial integration for (g) all samples, (h) sPE and (i) control.

References

    1. Moreno, I. et al. The human periconceptional maternal-embryonic space in health and disease. Physiol. Rev.103, 1965–2038 (2023). - PubMed
    1. Wang, W. et al. Single-cell transcriptomic atlas of the human endometrium during the menstrual cycle. Nat. Med.26, 1644–1653 (2020). - PubMed
    1. Garcia-Alonso, L. et al. Mapping the temporal and spatial dynamics of the human endometrium in vivo and in vitro. Nat. Genet.53, 1698–1711 (2021). - PMC - PubMed
    1. Ng, S. W. et al. Endometrial decidualization: the primary driver of pregnancy health. Int J. Mol. Sci.21, 4092 (2020). - PMC - PubMed
    1. Tabanelli, S., Tang, B. & Gurpide, E. In vitro decidualization of human endometrial stromal cells. J. Steroid Biochem. Mol. Biol.42, 337–344 (1992). - PubMed