

Spinal cord gray matter atrophy is associated with disability in spinal muscular atrophy
- PMID: 39775109
- PMCID: PMC11706851
- DOI: 10.1007/s00415-024-12740-3
Spinal cord gray matter atrophy is associated with disability in spinal muscular atrophy
Abstract
Background: With the approval of disease-modifying treatments for 5q-spinal muscular atrophy (SMA), there is an increasing need for biomarkers for disease course and therapeutic response monitoring. Radially sampled Averaged Magnetization Inversion Recovery Acquisitions (rAMIRA) MR-imaging enables spinal cord (SC) gray matter (GM) delineation and quantification in vivo. This study aims to assess SC GM atrophy in patients with 5q-SMA and its associations with clinical disability.
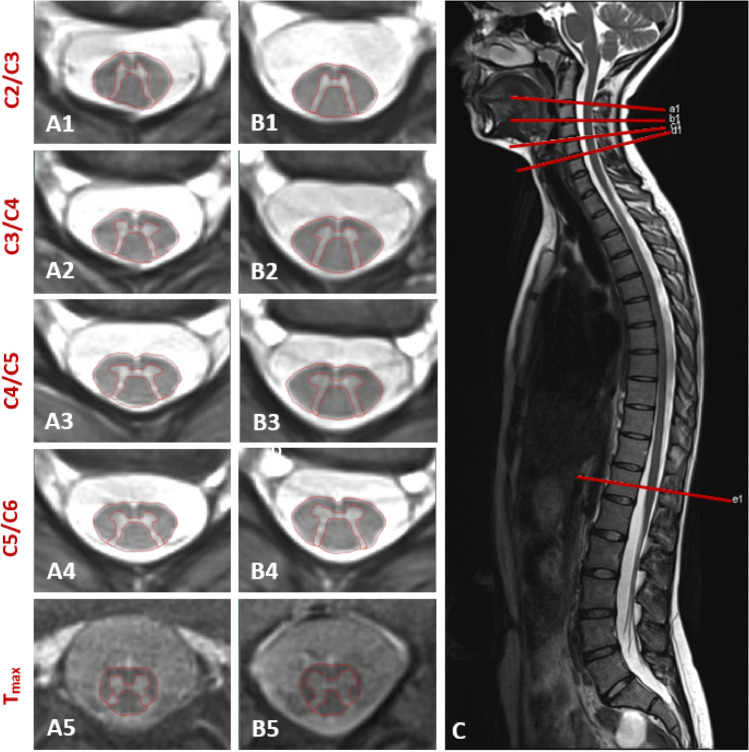
Methods: Twenty-one patients with 5q-SMA and twenty-one age- and sex-matched healthy controls (HCs) prospectively underwent 3 T axial 2D-rAMIRA MR-imaging at the intervertebral disc levels C2/C3-C5/C6 and Tmax (lumbar enlargement level). Associations between SC GM areas with muscle strength tested by dynamometry, Motor Function Measure (MFM), revised upper limb module (RULM), Revised Hammersmith Scale (RHS), and SMA-Functional Rating Scale (SMA-FRS) were assessed by Spearman Rank correlations and linear regression analysis.
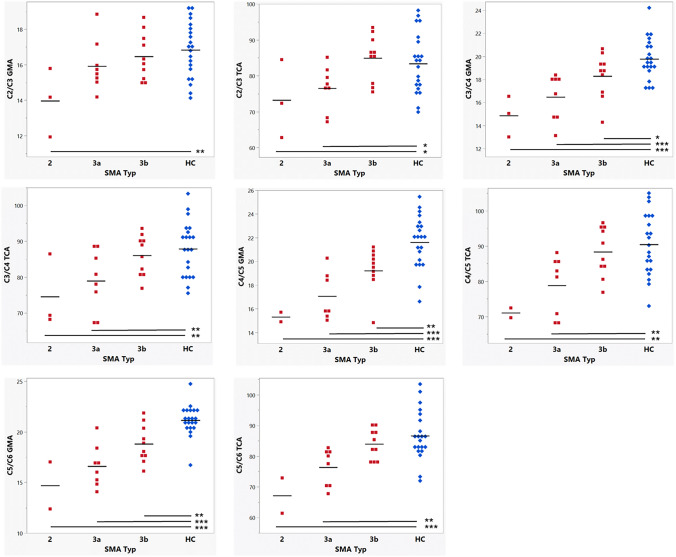
Results: Compared to HCs, patients had significantly reduced SC GM areas at levels C3/C4 (relative reduction (RR) = 13.6%, p < 0.0001); C4/C5 (RR = 16.7%, p < 0.0001), C5/C6 (RR = 17.1%, p < 0.0001), and Tmax (RR = 17.4%, p < 0.0001). Significant correlations were found between cervical SC GM areas and muscle strength, RULM, MFM, RHS, and SMA-FRS. In linear regression analysis, GM area C3/C4 explained 33% of RHS variance.
Conclusion: SC GM atrophy is detectable in patients with 5q-SMA and is consistently associated with clinical measures of upper limb function, physiotherapeutic assessments, and SMA-FRS indicating the clinical relevance of the observed atrophy. Further longitudinal investigations are necessary next steps to evaluate this novel and easily applicable imaging marker as a potential disease course and therapeutic response marker.
Keywords: Magnetic resonance imaging; SMA; Spinal cord atrophy; Spinal cord imaging; Spinal muscular atrophy.
© 2024. The Author(s).
Conflict of interest statement
Declarations. Conflict of interest: None of the other co-authors (EMK, MJW, CW, LS, MWei, TH, DF, NB, MWeb, MS, and OB) has a conflict of interest with respect to this study. Ethical approval: The local ethics committee approved the study (EKNZ 2019–01228). All participants gave written informed consent before participation in this study. The study is registered at clinicaltrials.gov: NCT06137612.
Figures
References
MeSH terms
LinkOut - more resources
Full Text Sources
Medical
Miscellaneous
