. 2025 Jan 7;5(1):7.
doi: 10.1038/s43856-024-00729-y.

Longitudinal monitoring of sewershed resistomes in socioeconomically diverse urban neighborhoods

Affiliations

Longitudinal monitoring of sewershed resistomes in socioeconomically diverse urban neighborhoods

Jangwoo Lee et al. Commun Med (Lond). .

Abstract

Background: Understanding factors associated with antimicrobial resistance (AMR) distribution across populations is a necessary step in planning mitigation measures. While associations between AMR and socioeconomic-status (SES), including employment and education have been increasingly recognized in low- and middle-income settings, connections are less clear in high-income countries where SES remains an important influence on other health outcomes.

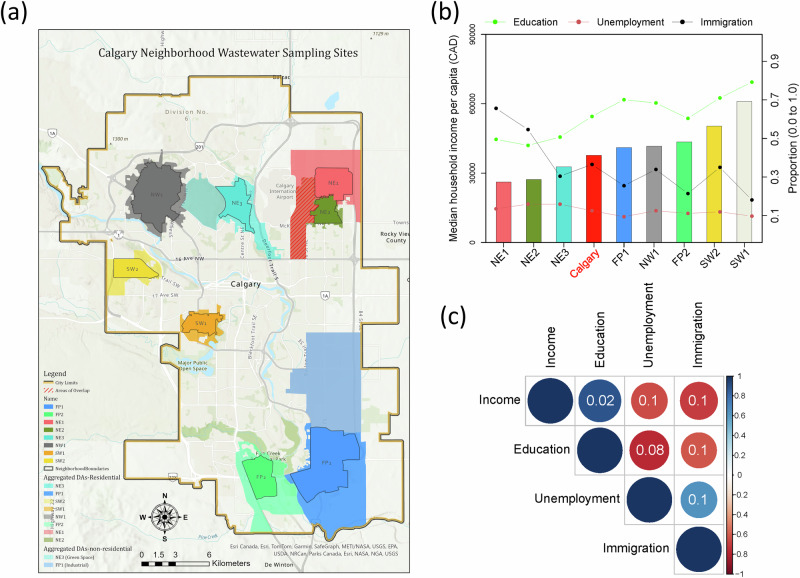
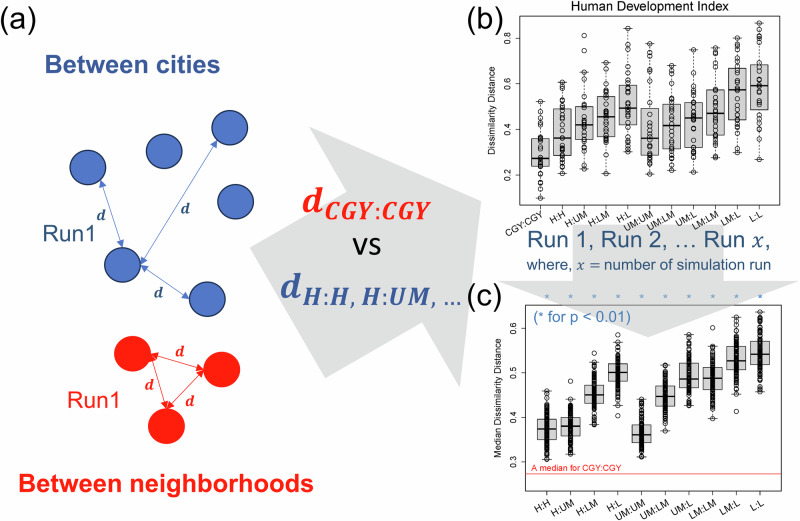
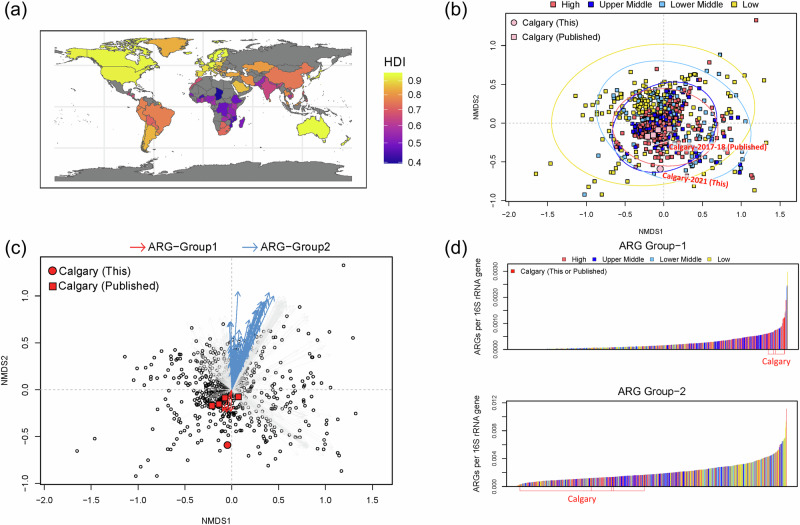
Methods: We explored the relationship between SES and AMR in Calgary, Canada using spatially-resolved wastewater-based surveillance of resistomes detected by metagenomics across eight socio-economically diverse urban neighborhoods. Resistomes were established by shotgun-sequencing of wastewater pellets, and qPCR of targeted-AMR genes. SES status was established using 2021 Canadian census data. Conducting this comparison during the height of COVID-related international travel restrictions (Dec. 2020-Oct. 2021) allowed the hypotheses linking SES and AMR to be assessed with limited confounding. These were compared with sewage metagenomes from 244 cities around the world, linked with Human Development Index (HDI).

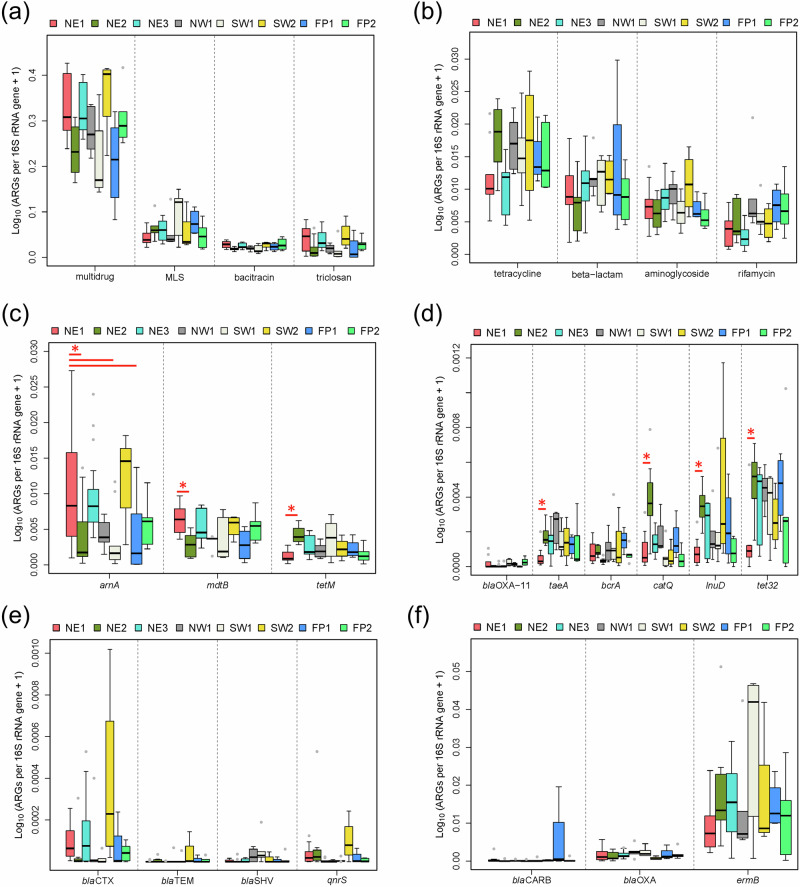
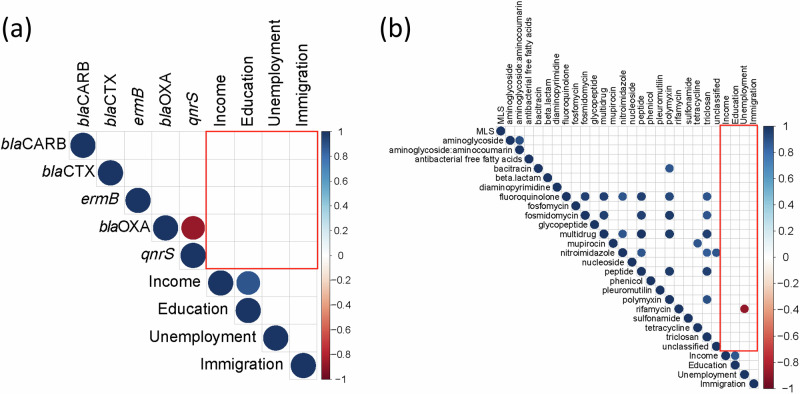
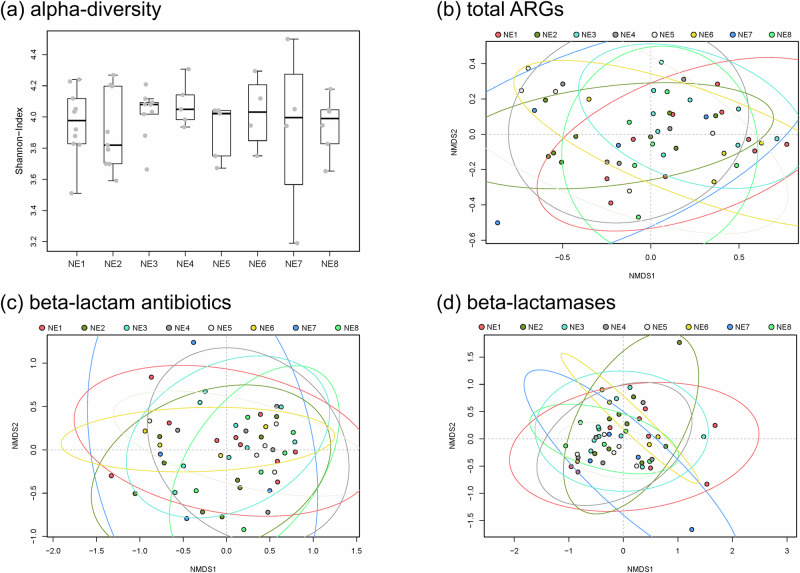
Results: Wastewater metagenomes from Calgary's socioeconomically diverse neighborhoods exhibit highly similar resistomes, with no quantitative differences (p > 0.05), low Bray-Curtis dissimilarity, and no significant correlations with SES. By comparison, dissimilarity is observed between globally-sourced resistomes (p < 0.05), underscoring the homogeneity of resistomes in Calgary's sub-populations. The analysis of globally-sourced resistomes alongside Calgary's resistome further reveals lower AMR burden in Calgary relative to other cities around the world. This is particularly pronounced for the most clinically-relevant AMR genes (e.g., beta-lactamases, macrolide-lincosamide-streptogramin).

Conclusions: This work showcases the effectiveness of inclusive and comprehensive wastewater-based surveillance for exploring the interplay between SES and AMR.

Plain language summary

Antimicrobial resistance (AMR) occurs when antimicrobial treatments fail to work and microbes continue to grow. This is a result of microbes acquiring AMR genes. Antimicrobial resistance (AMR) is an increasing public health threat. Some studies have suggested an association between AMR and socioeconomic factors. The amount of AMR can be monitored by investigating the presence of specific genes indicative of AMR in wastewater. To explore this within a high-income country with publicly funded health care, we collected wastewater from eight socioeconomically diverse neighborhoods across a large Canadian city. Conducted over eleven months during COVID-19-related travel restrictions, we did not observe an association between socioeconomic status of residents and the amount or types of AMR genes in wastewater. We also compared AMR genes from wastewater from cities across the globe, where we observed the presence of AMR genes significantly differed along established socio-economic parameters. Overall, our findings revealed the relationship between AMR genes and socioeconomic factors is dynamic, and context dependent.


Conflict of interest statement

Competing interests: The authors declare no competing interests.

Figures

Fig. 1
Fig. 1. Sampling map and socio-economic status (SES) indicators of Calgary neighborhoods.
a Map showing the city of Calgary and eight neighborhood sampling sites (differently colored), intersected with Dissemination Areas (DAs), i.e., spatial units where SES variables are surveyed (Census data). In cases of DAs only partially overlapping, sewersheds are shown in opaque, darker colors, whereas the residual portions of DAs not captured by the sewershed are shown in lighter, more transparent colors (see Methods); the cross-hatched areas indicate the residual portions of DAs that partially overlap with two sewersheds, i.e., NE1 and NE2. These areas generally represent uninhabited park or industrial space; b Histogram of various SES indicators including income, education, unemployment rates and immigration derived from Statistics Canada’s 2021 Census for those eight neighborhoods (colors corresponding to the map) as well as Calgary as a whole (bright red; median); c Correlations (Spearman’s; n = 8) between SES variables, with positive correlations represented by blue shades, and negative ones by red shades. p-values corrected by the Benjamini-Hochberg procedure for multiple comparisons are reported in each cell.
Fig. 2
Fig. 2. Log-transformed relative abundance of antibiotic resistance genes (ARGs) across eight different neighborhoods.
a, b Eight most abundant ARG-types found in neighborhood samples; (c, d) Nine ARG-subtypes that differed significantly between neighborhoods based on Wilcoxon rank-sum tests, where (c) are more prevalent ARGs, and (d) are less prevalent ARGs based upon relative abundance; (e, f) selected ARG-subtypes of specific clinical importance displayed in panels, where (e) are more prevalent ARGs, and (f) are less prevalent ARGs based upon relative abundance. The neighborhoods that significantly differed from NE1 for a given ARG were denoted by asterisks (*), with results for other test-pairs shown in Supplementary Dataset_Tab 4. The sample sizes were as follows: NE1 (10), NE2 (9), NE3 (9), NW1 (5), SW1 (5), SW2 (4), FP1 (4), and FP2 (6).
Fig. 3
Fig. 3. Relationships between socioeconomic status (SES) and the resistome.
Pairwise correlation between four SES variables and (a) five specific ARGs having clinical importance, and (b) a longer list including major ARG types identified in this study, with r values colored in a diverging color scale (blue for positive, red for negative correlation), all values with p.adj <0.10 are shown. The pairs between SES and ARGs were located within the red-colored box (where p.adj for rifamycin-unemployment 0.06). MLS denotes macrolide-lincosamide-streptogramin. The sample sizes for both figures were n = 8 with the median value calculated for each neighborhood.
Fig. 4
Fig. 4. Resistomes of eight Calgary neighborhoods.
Resistome alpha-diversity represented by Shannon Index values (a) and beta-diversity visualized by non-metric multidimensional scaling (NMDS) (bd) based on analysis of ARGs from eight different neighborhoods. Beta diversity was compared based on calculations for the entire resistome (b) and only for beta-lactam antibiotic resistance genes (c) and beta-lactamase genes (d). Variance ellipses indicated standard deviations of ordination scores (confidence limit = 0.95).
Fig. 5
Fig. 5. Schematic depicting workflow for comparing dissimilarity between resistomes in wastewater from Calgary and other locations around the world, categorized by Human Development Index (HDI).
(a) A diagram describing a random selection of certain number (n = 28) of dissimilarity distance, “d” in a single run, (b, c) comparisons of dissimilarity distance between Calgary neighborhoods (CGY:CGY) and between cities with different HDI classifications (b) in a single run (n = 28) and (c) and in multiple runs (n = 100). Calculated p-values according to (Eq. 6) are denoted by asterisks (*) in (c). Classifications of global cities used in this analysis include high (H), upper-middle (UM), lower-middle (LM), and low (L) categories based on HDI (see Fig. S12 and Methods for details).
Fig. 6
Fig. 6. Analysis of globally-sourced metagenomes.
(a) Map showing the Human Development Index (HDI) of the cities examined in this study. The HDI value of each global city is ascribed from its resident country; (b) Beta-diversity analysis visualized by NMDS with colors and ellipses (standard deviation of ordination scores; 0.95 confidence limit) denoting high, upper-middle, bottom-middle and low categories for HDI; (c) Biplot analysis of the top 100 ARGs most correlated with Calgary wastewater samples (from the current and previously published studies) shown in red (for positively associated genes; Group-1) or blue (for negatively associated genes; Group-2), and otherwise in light gray arrows; (d) Combined relative abundances of ARGs normalized against 16S rRNA genes across samples for Group-1 and Group-2.

Similar articles

Cited by

References

    1. Collignon, P., Beggs, J. J., Walsh, T. R., Gandra, S. & Laxminarayan, R. Anthropological and socioeconomic factors contributing to global antimicrobial resistance: a univariate and multivariable analysis. Lancet Planet. Heath2, e398–e405 (2018). - PubMed
    1. Aslam, B., et al. Antibiotic resistance: one health one world outlook. Front. Cell. Infect. Microbiol., 1153 10.3389/fcimb.2021.771510 (2021). - PMC - PubMed
    1. Murray, C. J. et al. Global burden of bacterial antimicrobial resistance in 2019: a systematic analysis. Lancet399, 629–655 (2022). - PMC - PubMed
    1. Maugeri, A., Barchitta, M., Puglisi, F. & Agodi, A. Socio-economic, governance and health indicators shaping antimicrobial resistance: an ecological analysis of 30 european countries. Glob. Health19, 12 (2023). - PMC - PubMed
    1. Wozniak, T. M., Cuningham, W., Ledingham, K. & McCulloch, K. Contribution of socio-economic factors in the spread of antimicrobial resistant infections in Australian primary healthcare clinics. J. Global Antimicrob. Resist.30, 294–301 (2022). - PubMed

LinkOut - more resources