. 2025 Jan 7;8(1):19.
doi: 10.1038/s42003-024-07447-0.

Kilohertz electrical stimulation evokes robust cellular responses like conventional frequencies but distinct population dynamics

Affiliations

Kilohertz electrical stimulation evokes robust cellular responses like conventional frequencies but distinct population dynamics

Cara R Ravasio et al. Commun Biol. .

Abstract

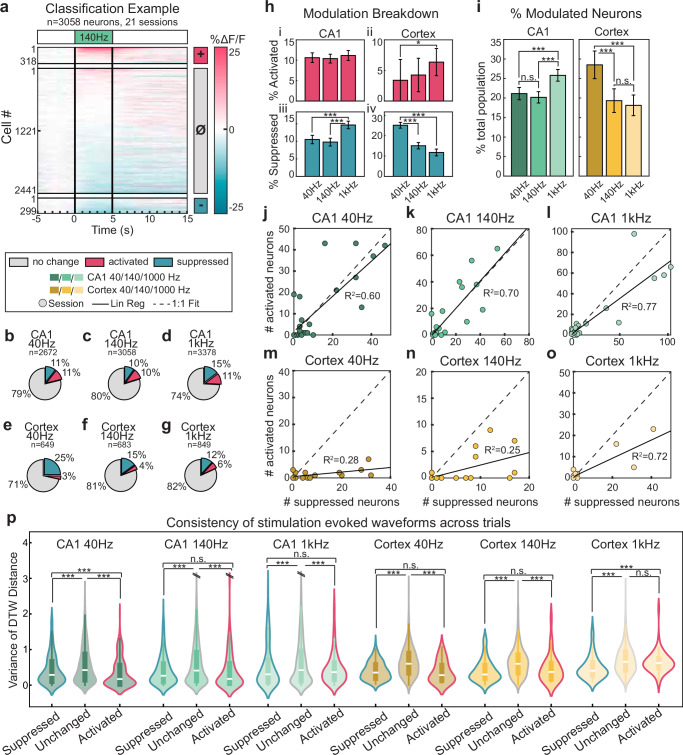
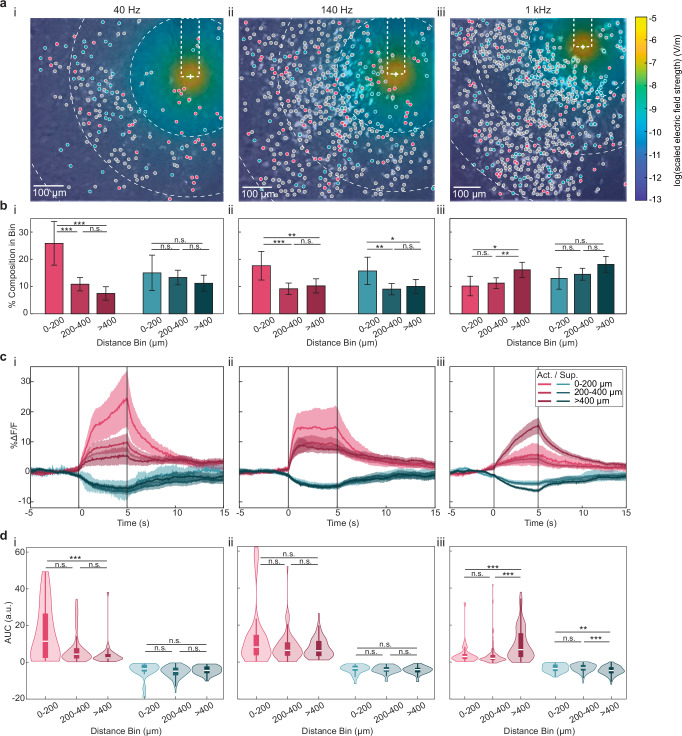
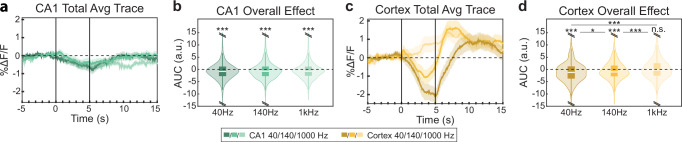
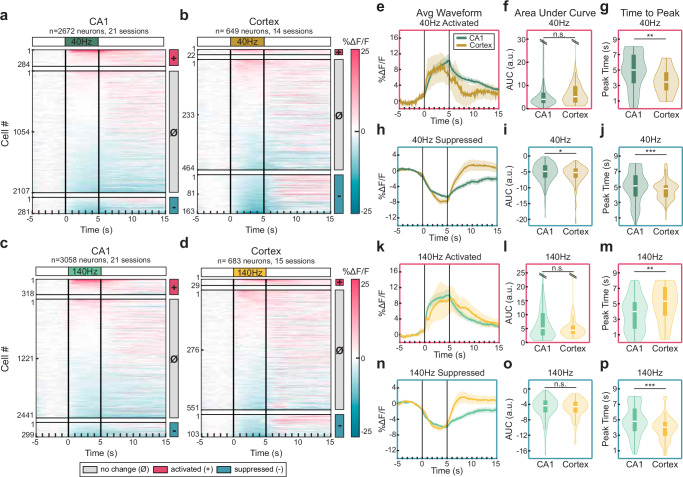
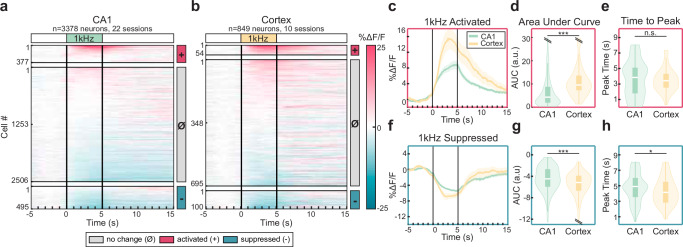
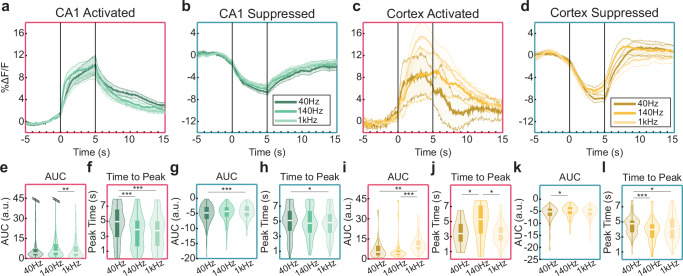
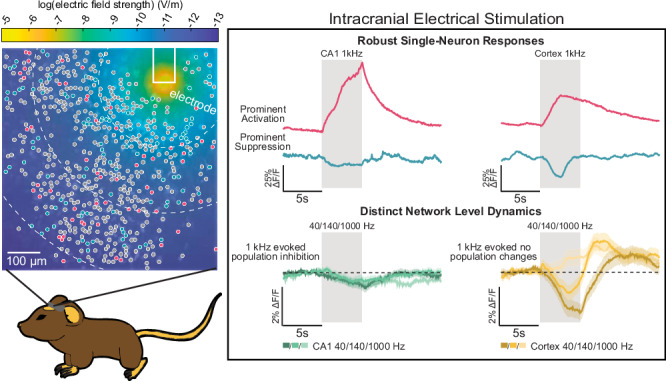
Intracranial electrical kilohertz stimulation has recently been shown to achieve similar therapeutic benefit as conventional frequencies around 140 Hz. However, it is unknown how kilohertz stimulation influences neural activity in the mammalian brain. Using cellular calcium imaging in awake mice, we demonstrate that intracranial stimulation at 1 kHz evokes robust responses in many individual neurons, comparable to those induced by conventional 40 and 140 Hz stimulation in both the hippocampus and sensorimotor cortex. The evoked responses at the single-cell level are shaped by prominent network inhibition and critically depend on brain region. At the network level, all frequencies lead to pronounced population suppression except 1 kHz in the cortex, which evokes balanced excitatory and inhibitory population effects. Thus, kilohertz stimulation robustly modulates neural activity at both the single-neuron and population network levels through mechanisms distinct from conventional frequency stimulation, highlighting the clinical potential of intracranial kilohertz neuromodulation.


Conflict of interest statement

Competing interests: The authors declare no competing interests.

Figures

Fig. 1
Fig. 1. Electrical stimulation at 40 Hz, 140 Hz, and 1 kHz evoked robust cellular calcium activity.
a, b An illustration of the animal preparation for the (a) CA1 and (b) cortex, showing optical imaging chambers with nearby stimulation and ground electrodes. c Schematic of the widefield calcium imaging experimental setup in freely locomoting head-fixed mice. d (left) An example max-min projected imaging field of view of the GCaMP7f fluorescence during a CA1 recording session testing 140 Hz stimulation, (middle) a heatmap depicting the theoretical electric field strength dissipation, and (right) the overlay of the left and middle panels. White dotted circles mark every 50 µm from the center of the electrode tip. The fluorescence traces of four example modulated neurons (outlined in yellow in the left and right panels) are shown in f. e The normalized fluorescence traces of example CA1 neurons during 40 Hz stimulation, aligned to stimulation onset. Every trial is shown in gray (10 trials total); the average fluorescence trace across all trials is shown in red for activated neurons and blue for suppressed neurons. f–j Additional example modulated neurons for the other experimental conditions, with electrical stimulation period highlighted by the bar on the top (green, for CA1; yellow for cortex). (e) 40 Hz in the CA1, (f) 140 Hz in the CA1, (g) 1 kHz in the CA1, (h) 40 Hz in the cortex, (i) 140 Hz in the cortex, and (j) 1 kHz in the cortex.
Fig. 2
Fig. 2. The fraction of activated and suppressed neurons was balanced in the CA1, but suppression dominated in the cortex.
a Heatmap of 140Hz-evoked responses across 3058 CA1 neuron. Every row is the mean normalized fluorescence of a neuron across trials. The color corresponds to the change relative to baseline, with red indicating increases, blue indicating decreases, and white indicating minimal change. Of the neurons recorded, 318 were activated (red, +, top), 2441 were unchanged (gray, Ø, middle), and 299 were suppressed (blue, -, bottom). b–g The fraction of activated, suppressed, and unchanged neurons for (b) 40 Hz in the CA1, (c) 140 Hz in the CA1, (d) 1 kHz in the CA1, (e) 40 Hz in the cortex, (f) 140 Hz in the cortex, and (g) 1 kHz in the cortex. h Comparison across stimulation frequencies for the fraction of (i, ii) activated and (iii, iv) suppressed neurons in CA1 and cortex. Bar plots are ± 95% confidence intervals. (Chi-squared test, statistical results in Suppl. Table 1). i Comparison of the fraction of modulated neurons for CA1 and cortex. (Chi-squared test, statistical results in Suppl. Table 1). j–o The number of activated vs. suppressed neurons across experimental sessions. Each circle corresponds to a recording session. Solid line is the linear regression with R2 value indicated, and the dotted line corresponds to the diagonal for reference. p Variance of dynamic time warping (DTW) distance across neurons that were activated, suppressed, or unchanged at the three stimulation frequencies in the two brain regions. (Kruskal-Wallis with Dunn-Sidak correction, statistical results in Suppl. Table 1). Violin plots depict the kernel density overlaid with box plots showing the interquartile range (1x, 1.5x). The white lines in the boxes are the median. All tests are two-tailed. n.s., not significant, *p < 0.05, **p < 0.01, ***p < 0.005.
Fig. 3
Fig. 3. Electric field strength in CA1 correlated with the stimulation-evoked effects during 40 Hz and 140 Hz stimulation, but not 1 kHz.
a Example fields-of-view showing max-min projected GCaMP7f fluorescence in the CA1 in a mouse with visible electrode tip during (i) 40 Hz, (ii) 140 Hz, and (iii) 1 kHz stimulation. The electrode is outlined with a white dashed rectangle, and its tip marked with a white cross. White dashed circles mark every 200 µm from the electrode tip. Every neuron is marked with a small colored circle (red = activated, blue = suppressed, gray = unchanged) outlined in white. (b) The fraction of neurons being activated (red) or suppressed (blue) within each distance bin across recordings (0–200 µm, 200–400 µm, and >400 µm) during (i) 40 Hz, (ii) 140 Hz, and (iii) 1 kHz stimulation (±95% confidence interval; Chi-squared test, statistical results in Suppl. Table 1). c The mean GCaMP7f fluorescent traces (±95% confidence interval) of activated (red) and suppressed (blue) neurons in each bin (0–200 µm = lightest shade, 200–400 µm = middle shade, and >400 µm = darkest shade) during (i) 40 Hz, (ii) 140 Hz, and (iii) 1 kHz stimulation. d Quantification of the area under the curve (AUC) during stimulation for the traces shown in c during (i) 40 Hz (ii) 140 Hz, and (iii) 1 kHz stimulation (Kruskal-Wallis with Dunn-Sidak correction, statistical results in Suppl. Table 1). Violin plots depict the kernel density overlaid with box plots showing the interquartile range (1x, 1.5x). The white lines in the boxes are the median. All tests are two-tailed. n.s., not significant, *p < 0.05, **p < 0.01, ***p < 0.005.
Fig. 4
Fig. 4. 1 kHz stimulation in the cortex did not suppress population-level calcium dynamics.
a, c The population fluorescence across all neurons (±95% confidence interval) during 40 Hz (darkest shade), 140 Hz (middle shade), and 1 kHz (lightest shade) stimulation in the (a) CA1 (green) and (c) cortex (yellow). b, d Area under the curve (AUC) during stimulation in the (b) CA1 (Wilcoxon signed-rank test, statistical results in Suppl. Table 1), and (d) cortex (Wilcoxon signed-rank test, statistical results in Suppl. Table 1). Violin plots depict the kernel density overlaid with box plots showing the interquartile range (1x, 1.5x). The white lines in the boxes are the median. All tests are two-tailed. n.s., not significant, *p < 0.05, **p < 0.01, ***p < 0.005.
Fig. 5
Fig. 5. 40 Hz and 140 Hz stimulation-evoked effect varied in temporal characteristics, but not strength, between CA1 and cortex.
ad Heatmaps showing the normalized fluorescence across all neurons during (a–b) 40 Hz or (c-d) 140 Hz stimulation in the (a, c) CA1 and (b, d) cortex. The neurons were grouped based on modulation classification: activated (top, red, +), unchanged (middle, gray, Ø), or suppressed (bottom, blue, -). e Average fluorescence trace (± 95% confidence interval) in the CA1 (dark green) and cortex (dark yellow) for activated neurons during 40 Hz stimulation. f, g 40 Hz stimulation-evoked (f) AUC and (g) time to peak (Wilcoxon rank-sum, statistical results in Suppl. Table 1). h Average fluorescence trace (± 95% confidence interval) in the CA1 (dark green) and cortex (dark yellow) for suppressed neurons during 40 Hz stimulation. i, j Same as f, g, but for suppressed neurons. (Wilcoxon rank-sum, statistical results in Suppl. Table 1). (k) Average fluorescence trace (± 95% confidence interval) in the CA1 (green) and cortex (yellow) for activated neurons during 140 Hz stimulation. l–m 140 Hz stimulation-evoked response (l) AUC and (m) time to peak (Wilcoxon rank-sum, statistical results in Suppl. Table 1). n Average fluorescence trace (± 95% confidence interval) in the CA1 (green) and cortex (yellow) for suppressed neurons during 140 Hz stimulation. op Same as l and m but for suppressed neurons (Wilcoxon rank-sum, statistical results in Suppl. Table 1). Violin plots depict the kernel density overlaid with box plots showing the interquartile range (1x, 1.5x). The white lines in the boxes are the median. All tests are two-tailed. n.s., not significant, *p < 0.05, **p < 0.01, ***p < 0.005.
Fig. 6
Fig. 6. 1 kHz stimulation-evoked responses were stronger in cortex than CA1, without temporal differences between brain regions.
a, b Heatmaps showing the normalized fluorescence for all neurons upon 1 kHz stimulation in the (a) CA1 and (b) cortex. The neurons were grouped based on modulation classification (activated (top, red, +), unchanged (middle, gray, Ø), or suppressed (bottom, blue, -)). (c) Average fluorescence trace (± 95% confidence interval) in the CA1 (light green) and cortex (light yellow) for activated neurons during 1 kHz stimulation. de 1 kHz stimulation-evoked (d) AUC and (e) time to peak (Wilcoxon rank-sum, statistical results in Suppl. Table 1). f Average fluorescence trace (± 95% confidence interval) in the CA1 (light green) and cortex (light yellow) for suppressed neurons during 1 kHz stimulation. g, h Same as d and e but for suppressed neurons (Wilcoxon rank-sum, statistical results in Suppl. Table 1). Violin plots depict the kernel density overlaid with box plots showing the interquartile range (1x, 1.5x). The white lines in the boxes are the median. All tests are two-tailed. n.s., not significant, *p < 0.05, **p < 0.01, ***p < 0.005.
Fig. 7
Fig. 7. Stimulation-evoked excitatory and inhibitory response profiles were generally insensitive to stimulation frequencies within each brain region.
ad Population fluorescence traces as shown in Figs. 5e,h,k,n and 6c,f are replotted here but grouped by brain region for (a, b) activated neurons and (b, d) suppressed neurons. Solid lines were the mean, and the shaded areas were 95% confidence interval. e-l Violin plots quantifying the difference between 40 Hz, 140 Hz and 1 kHz for the (e-f, i-j) activated neurons and (g-h, k-l) suppressed neurons. e, f AUC and Time to peak for activated neurons in the CA1 (Kruskal-Wallis, statistical results in Suppl. Table 1). (g, h) (g) AUC and (h) time to peak for suppressed neurons in the CA1 (Kruskal-Wallis, statistical results in Suppl. Table 1). (i, j) (i) AUC and (j) time to peak for activated neurons in the cortex (Kruskal-Wallis, statistical results in Suppl. Table 1). (k, l) (k) AUC and (l) time to peak for suppressed neurons in the cortex (Kruskal-Wallis, statistical results in Suppl. Table 1). Violin plots depict the kernel density overlaid with box plots showing the interquartile range (1x, 1.5x). The white lines in the boxes are the median. All Kruskal-Wallis tests were performed with a Dunn-Sidak multiple comparisons correction. n.s., not significant, *p < 0.05, **p < 0.01, ***p < 0.005.
None

Similar articles

Cited by

References

    1. Alector Inc. A Phase 2 Randomized, Double-Blind, Placebo-Controlled, Multicenter Study to Evaluate the Efficacy and Safety of AL002 in Participants With Early Alzheimer’s Disease. https://clinicaltrials.gov/ct2/show/NCT04592874 (2021).
    1. McKinnon, C. et al. Deep brain stimulation: potential for neuroprotection. Ann. Clin. Transl. Neurol.6, 174–185 (2018). - PMC - PubMed
    1. Lozano, A. M. et al. A Phase II Study of Fornix Deep Brain Stimulation in Mild Alzheimer’s Disease. J. Alzheimers Dis.54, 777–787 (2016). - PMC - PubMed
    1. Nair, D. R. et al. Nine-year prospective efficacy and safety of brain-responsive neurostimulation for focal epilepsy. Neurology95, e1244–e1256 (2020). - PMC - PubMed
    1. Li, M. C. H. & Cook, M. J. Deep brain stimulation for drug-resistant epilepsy. Epilepsia59, 273–290 (2018). - PubMed

LinkOut - more resources