. 2025 Apr;21(4):598-610.
doi: 10.1038/s41589-024-01815-x. Epub 2025 Jan 7.

FUT10 and FUT11 are protein O-fucosyltransferases that modify protein EMI domains

Affiliations

FUT10 and FUT11 are protein O-fucosyltransferases that modify protein EMI domains

Huilin Hao et al. Nat Chem Biol. 2025 Apr.

Abstract

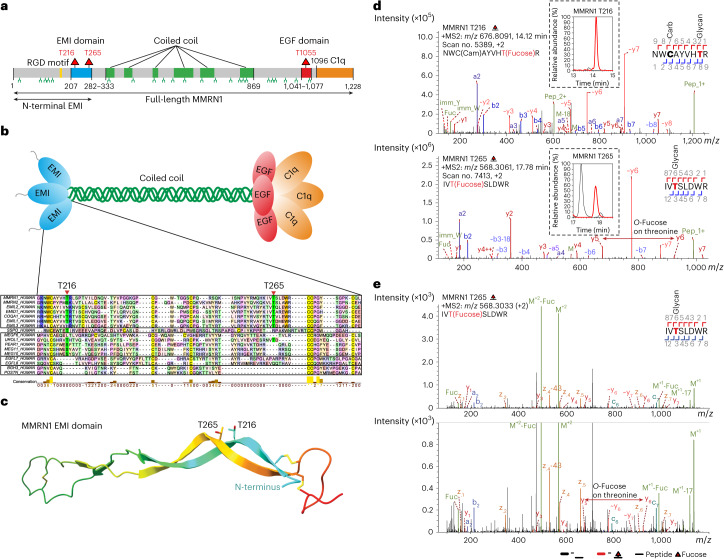
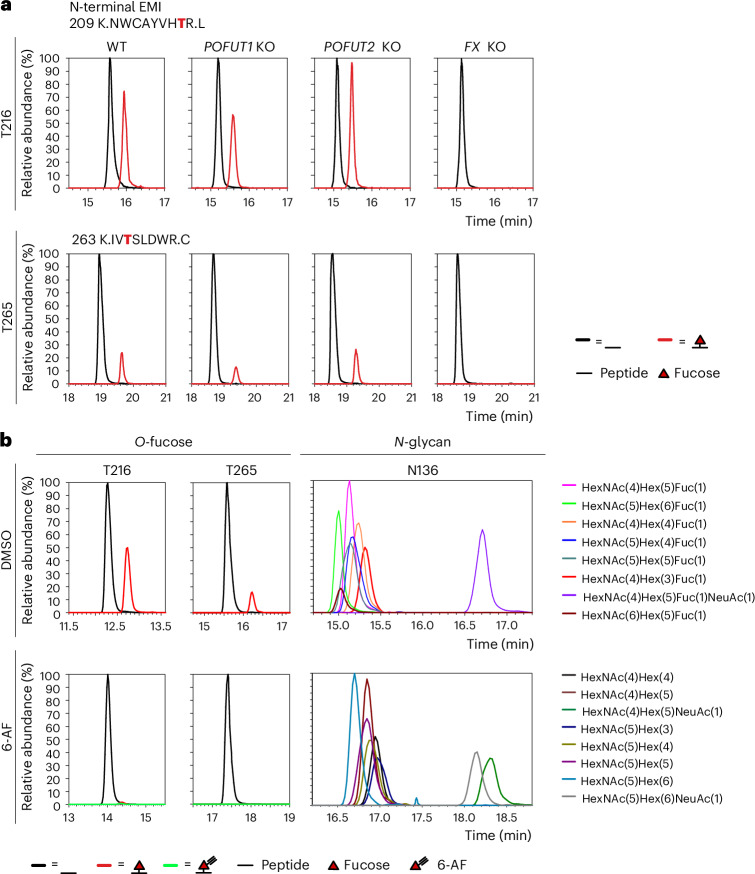
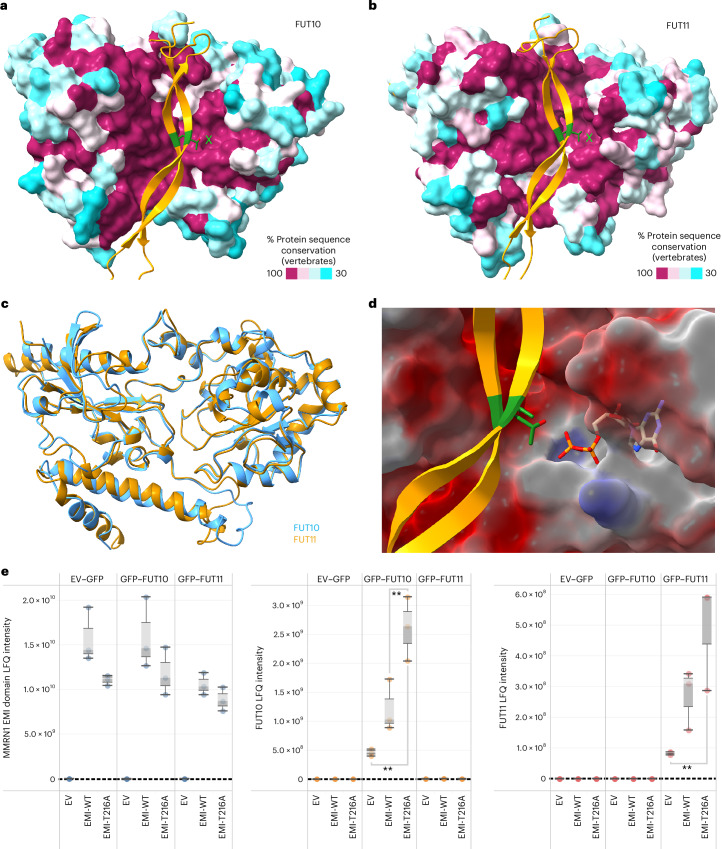
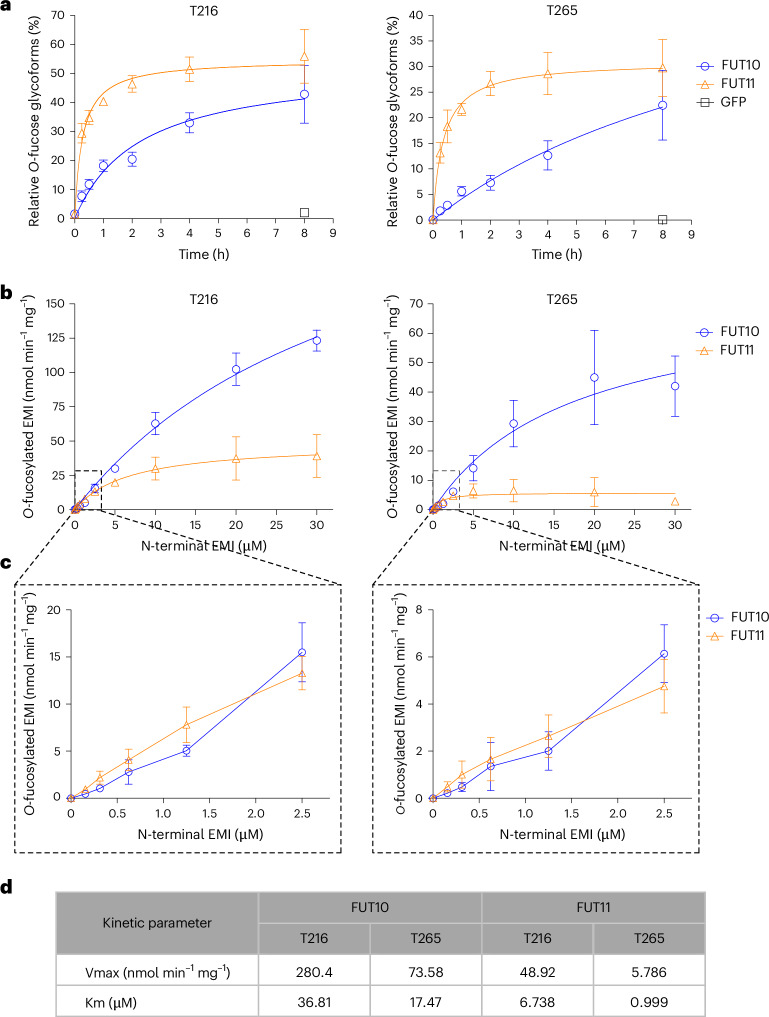
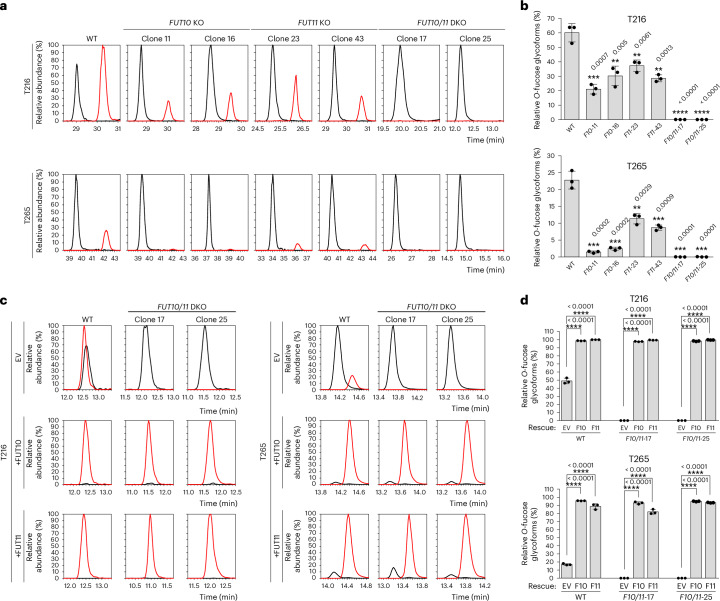
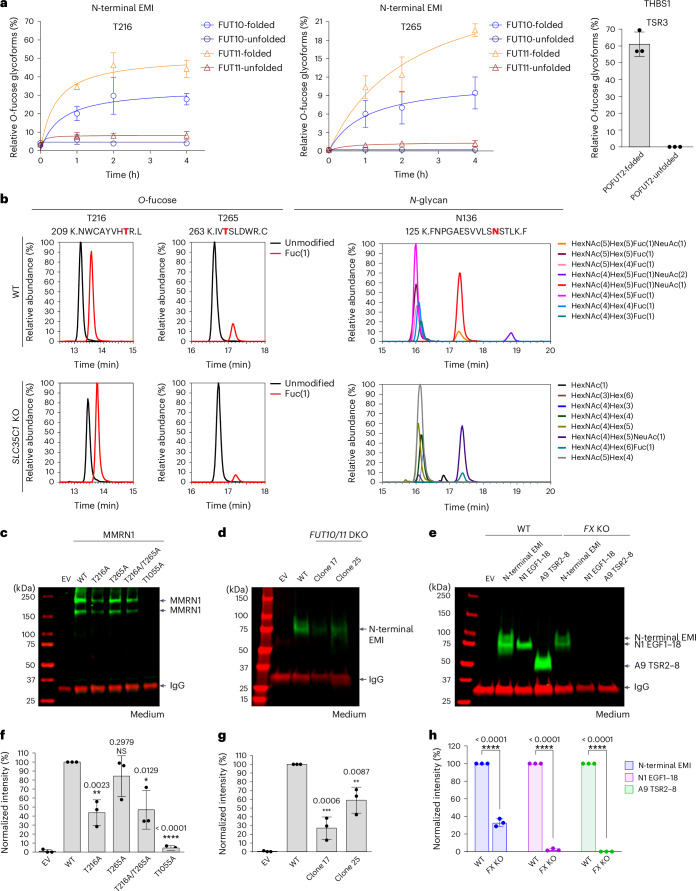
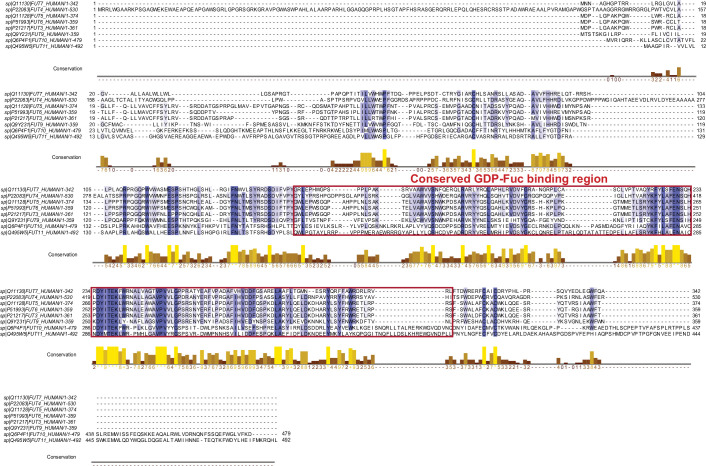
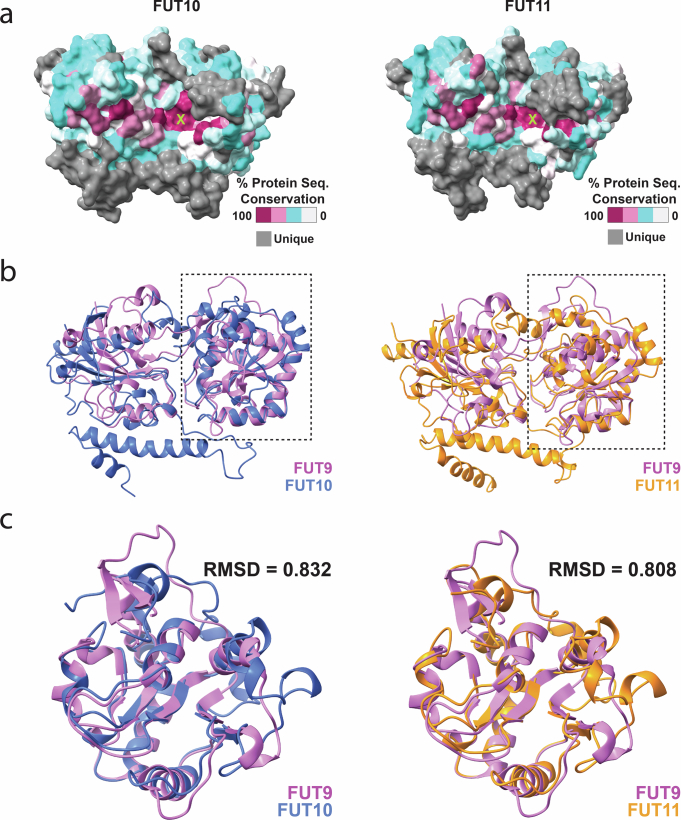
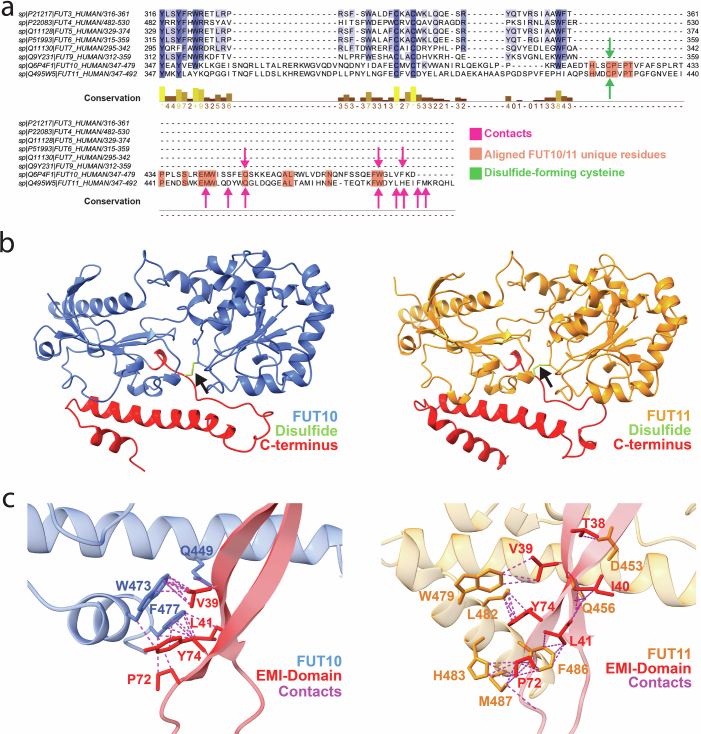
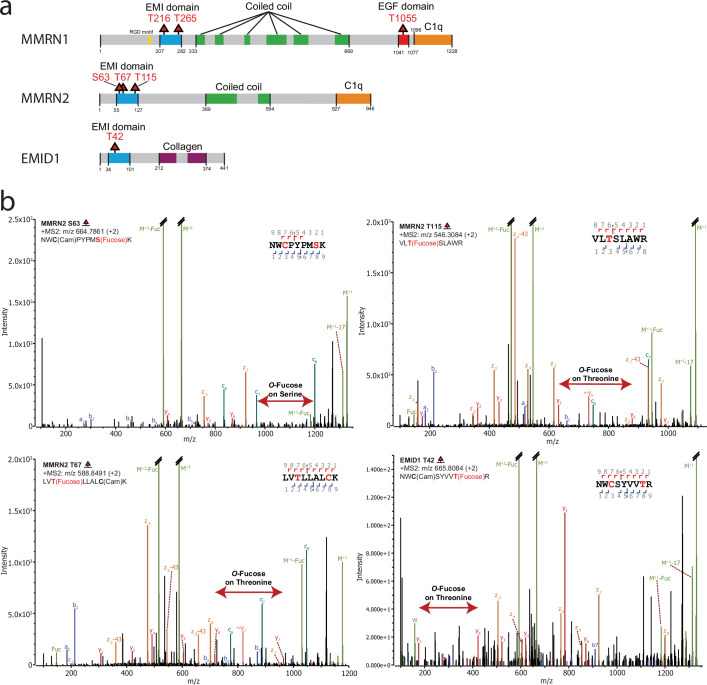
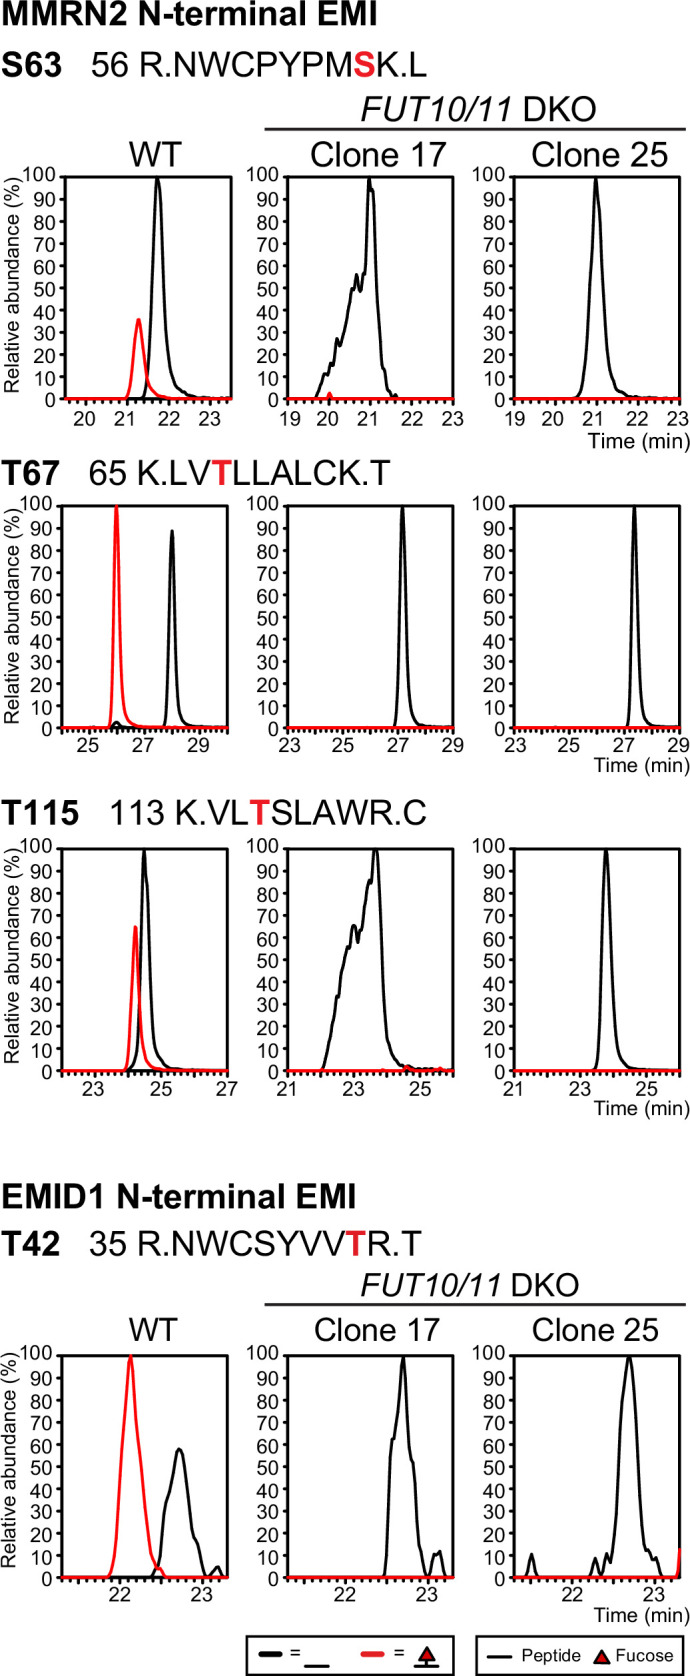
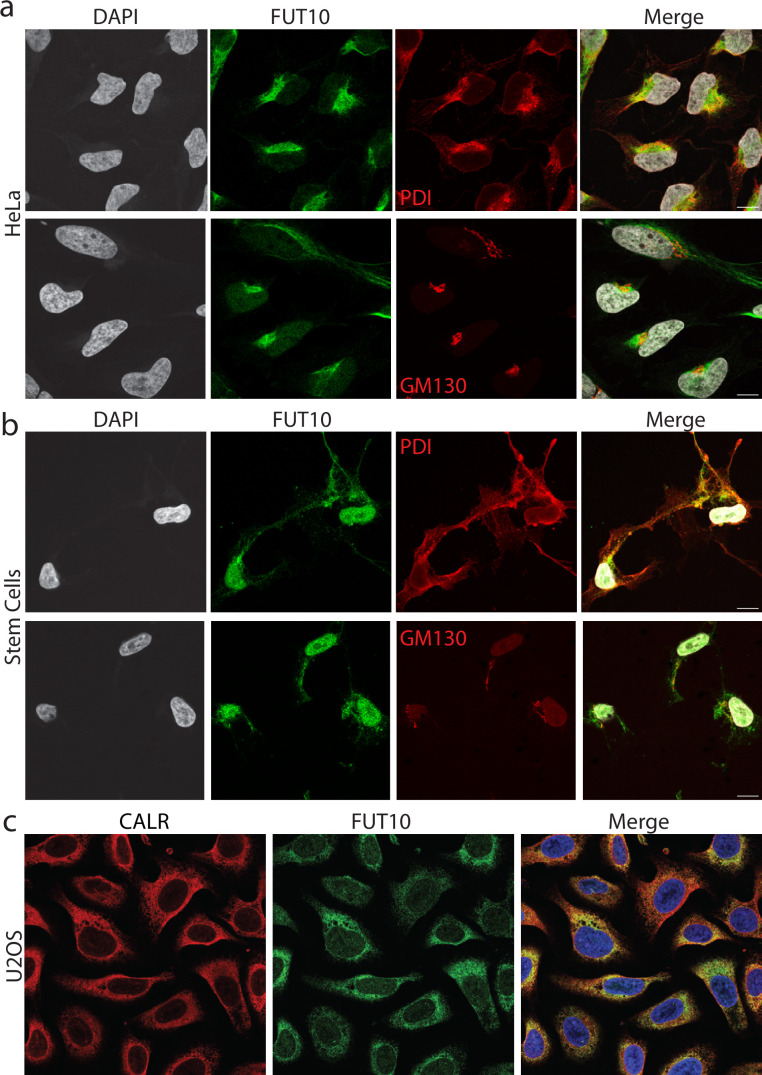
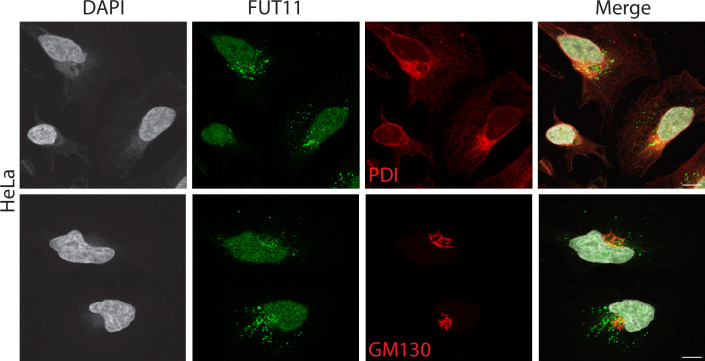
O-Fucosylation plays crucial roles in various essential biological events. Alongside the well-established O-fucosylation of epidermal growth factor-like repeats by protein O-fucosyltransferase 1 (POFUT1) and thrombospondin type 1 repeats by POFUT2, we recently identified a type of O-fucosylation on the elastin microfibril interface (EMI) domain of Multimerin-1 (MMRN1). Here, using AlphaFold2 screens, co-immunoprecipitation, enzymatic assays combined with mass spectrometric analysis and CRISPR-Cas9 knockouts, we demonstrate that FUT10 and FUT11, originally annotated in UniProt as α1,3-fucosyltransferases, are actually POFUTs responsible for modifying EMI domains; thus, we renamed them as POFUT3 and POFUT4, respectively. Like POFUT1/2, POFUT3/4 function in the endoplasmic reticulum, require folded domain structures for modification and participate in a non-canonical endoplasmic reticulum quality control pathway for EMI domain-containing protein secretion. This finding expands the O-fucosylation repertoire and provides an entry point for further exploration in this emerging field of O-fucosylation.


Conflict of interest statement

Competing interests: The authors declare no competing interests.

Figures

Fig. 1
Fig. 1. Two O-fucose sites were identified on the EMI domain of MMRN1.
a, Domain organization of human MMRN1 protein. The positions of O-linked fucosylation and N-glycan sequons are shown as red triangles and green branches, respectively. Protein domains are illustrated: yellow, RGD motif (cell attachment site); blue, EMI domain; green, coiled coil region; red, EGF-like domain; orange, C1q domain. Black arrows indicate the expression constructs used in this study. b, Cartoon of the homotrimer MMRN1 structure with key domains shown. Clustal Omega alignment of all human EMI domain protein sequences colored by residue type. Subgroups with high similarity are bound by black boxes. The O-fucosylated residues in MMRN1 are labeled. c, AlphaFold2 structure of the EMI domain from human MMRN1 protein colored with a rainbow style from the N-terminal side (blue) to the C-terminal side (red). Disulfide bonds are shown, and the O-fucosylated residues are labeled. d, HCD–MS/MS spectra of fucosylated peptides 209NWCAYVHTR217 and 263IVTSLDWR270 that contain the T216 and T265 O-fucose sites in MMRN1 EMI domains. EICs of different glycoforms were inserted for each peptide: red lines, O-fucose modified; black lines, unmodified. The EIC and spectra for T1055 O-fucose modification in MMRN1 EGF domain are in Supplementary Data 1. e, Annotated EAD MS/MS spectra for the O-fucosylated human MMRN1 peptide derived from the platelet releasate containing T265. Human platelet releasates were digested into peptides and analyzed by targeted LC–MS/MS with EAD fragmentation. Ions in the MS/MS spectrum are annotated as c-ions, z-ions, y-ions, b-ions, a-ions, ~y-ions with a neutral loss (for example, whole glycan loss), M (intact precursor), M-Fuc (intact precursor with neutral loss of fucose) or Fuc (fucose oxonium ion). Mass error for fragment matching is less than 20 ppm using the Byonic software package.
Fig. 2
Fig. 2. Neither POFUT1 nor POFUT2 is responsible for the O-fucosylation of MMRN1 EMI domains.
a, EICs of different glycoforms of peptides containing the T216 or T265 O-fucose site from N-terminal EMI produced in HEK293T WT, POFUT1 KO, POFUT2 KO or FX KO cells. EICs of positive controls (mNOTCH1 EGF1–5 for POFUT1-mediated EGF O-fucosylaton and hTHBS1 TSR1–3 for POFUT2-mediated TSR O-fucosylation) are in Supplementary Fig. 2a,b. Spectra for the corresponding ions are in Supplementary Data 1. b, EICs of different glycoforms of peptides containing T216 or T265 O-fucose sites or N136 N-glycan site from N-terminal EMI produced in HEK293T WT cells incubated with DMSO or 6-AF. EICs of positive controls (mNOTCH1 EGF1–5 and hTHBS1 TSR1–3 for 6-AF incorporation) are in Supplementary Fig. 2c,d. Spectra for the corresponding ions are in Supplementary Data 1.
Fig. 3
Fig. 3. Interaction analysis between FUT10 or FUT11 and the EMI domain.
a, AlphaFold2-multimer predicted structure of the human FUT10 protein (residues 81–479) and the human MMRN1 EMI domain (residues 184–282). The EMI domain is shown as a gold cartoon depiction with the O-fucosylated residues shown in dark green. The FUT10 protein is shown as a surface depiction colored by the sequence conservation across vertebrates. The light green X marks the putative GDP-fucose binding active site. b, AlphaFold2-multimer predicted structure of the human FUT11 protein (residues 73–492) and the human MMRN1 EMI domain (residues 184–282). The EMI domain is shown as a gold cartoon depiction with the O-fucosylated residues shown in dark green. The FUT11 protein is shown as a surface depiction colored by the sequence conservation across vertebrates. The light green X marks the putative GDP-fucose binding active site. c, Comparison of the predicted structures for FUT10 and FUT11. d, Docking of GDP into the putative active site of FUT11 using AlphaFold3 (ref. ). The FUT11 protein is shown as a partially transparent surface depiction colored by electrostatic potential (blue, positive; red, negative). The EMI domain is shown as a gold cartoon depiction with the O-fucosylated residues shown in dark green. The GDP structure is shown as an atomic model. e, Boxplots showing label-free quantification (LFQ) intensity of proteins immunoprecipitated with MMRN1 N-terminal EMI-Myc that was either WT or a T216A mutant. These proteins were isolated from HEK293 cells that were transiently transfected with either empty vector (EV) or the N-terminal EMI-expressing vectors, with or without GFP–FUT10 or GFP–FUT11 vector as shown in the top and bottom axis labels (n = 3). For the boxplot, each circle is a biological replicate derived from an individual culture; ** indicates P < 0.01 from a one-way ANOVA; the boxes represent the median/quartiles; and whiskers represent 1.5 × the interquartile range. Co-immunoprecipitation of EMI-Myc with full-length FUT11 protein is presented in Supplementary Fig. 5. Source data
Fig. 4
Fig. 4. FUT10 and FUT11 are POFUTs that are responsible for the O-fucosylation of MMRN1 EMI domains.
a, 0.1 μM purified GFP–FUT10, GFP–FUT11 or GFP (negative control) was incubated with 0.5 μM non-fucosylated N-terminal EMI and 100 μM GDP-fucose for indicated time periods. Reaction products were reduced, alkylated, digested with trypsin and analyzed by nano LC–MS/MS. Relative abundances of O-fucosylation for each reaction were calculated from the EICs of peptides containing T216 or T265 O-fucose site and plotted as time-dependent curves. Data are presented as mean ± s.d. from biological triplicates using three batches of purified enzymes (Supplementary Fig. 8). b, Substrate concentration-dependent kinetics of GFP–FUT10 and GFP–FUT11. 50 nM purified GFP–FUT10/11 was incubated with varied concentrations of non-fucosylated N-terminal EMI, 100 μM Ultra Pure GDP-fucose and 0.3 mM MnCl2 for 15 min. Reaction products were reduced, alkylated, digested with trypsin and analyzed by nano LC–MS/MS. O-fucosylation stoichiometry on T216 site and T265 site was quantified from EICs and converted into product concentration. Kinetic analysis was performed with nonlinear Michaelis–Menten fitting in Prism 7. GDP-fucose concentration-dependent kinetics of GFP–FUT11 are in Supplementary Fig. 14. c, Data points with substrate concentrations ranging from 0 μM to 2.5 μM in b were zoomed in to show the distinct kinetic profiles of GFP–FUT10 and GFP–FUT11 with low substrate concentration. Data are presented as mean ± s.d. from biological triplicates using three batches of purified enzymes (Supplementary Fig. 13). d, Kinetic parameters calculated using the data from b with nonlinear Michaelis–Menten fitting in Prism 7. Source data
Fig. 5
Fig. 5. FUT10 and FUT11 are responsible for EMI O-fucosylation in HEK293T cells.
a, EICs of different glycoforms of peptides containing the T216 or T265 O-fucose site from N-terminal EMI produced in HEK293T WT, FUT10 KO, FUT11 KO or FUT10/11 DKO cells. Red lines, O-fucose modified; black lines, unmodified. b, Relative abundances of O-fucosylated glycoforms in a were quantified. F10-11, FUT10 KO cells-clone 11; F10-16, FUT10 KO cells-clone 16; F11-23, FUT11 KO cells-clone 23; F11-43, FUT11 KO cells-clone 43; F10/11-17, FUT10/11 DKO cells-clone 17; F10/11-25, FUT10/11 DKO cells-clone 25. Statistical analysis was performed with unpaired, two-tailed t-test in Prism 7. **P < 0.01; ***P < 0.001; ****P < 0.0001 compared to control (WT cells). c, EICs of different glycoforms of peptides containing the T216 or T265 O-fucose site from N-terminal EMI produced in HEK293T WT or FUT10/11 DKO cells that co-transfected with plasmids encoding FUT10, FUT11 or EV. Red lines, O-fucose modified; black lines, unmodified. d, Quantified relative abundances of O-fucosylated glycoforms in c. F10, FUT10 plasmid; F11, FUT11 plasmid. Statistical analysis was performed with unpaired, two-tailed t-test in Prism 7. ****P < 0.0001 compared to control (EV). All data are shown as mean ± s.d. from biological triplicates of three individual transfections (Supplementary Figs. 17 and 18). Source data
Fig. 6
Fig. 6. FUT10 and FUT11 require folded EMI structures for modification and function in the ER, participating in a non-canonical ER quality control pathway for EMI domains.
a, POFUT enzymatic assays with folded and unfolded substrates. Left and middle, GFP–FUT10 and GFP–FUT11 with folded or unfolded N-terminal EMI. Right, GFP–POFUT2 with folded or unfolded hTHBS1 TSR3 as a positive control. Relative abundances of O-fucosylated glycoforms were calculated and plotted as time-dependent curves for GFP–FUT10 and GFP–FUT11 or as a bar graph for GFP–POFUT2. Data are shown as mean ± s.d. from biological triplicates using three batches of purified enzymes (Supplementary Fig. 21). b, FUT10 and FUT11 likely function in the ER rather than the Golgi. Spectra for the corresponding ions are in Supplementary Data 1. c, HEK293T cells were transfected with plasmids encoding Myc-tagged MMRN1 WT, MMRN1 T216A, MMRN1 T265A, MMRN1 T216A/T265A, MMRN1 T1055A or EV and IgG (secretion control). Two-day culture medium was collected and analyzed by western blot probed with anti-Myc and anti-human IgG antibodies. d, HEK293T WT or FUT10/11 DKO cells were transfected with plasmids encoding Myc-tagged N-terminal EMI or EV and IgG (secretion control). Two-day culture medium was analyzed by western blot probed with anti-Myc and anti-human IgG antibodies. e, HEK293T WT or FX KO cells were transfected with plasmids encoding Myc-tagged N-terminal EMI, mNOTCH1 EGF1–18, hADAMTS9 TSR2–8 or EV and IgG (secretion control). Cells were cultured for 2 d. Culture medium was analyzed by western blot probed with anti-Myc and anti-human IgG antibodies. N1 EGF1–18, mNOTCH1 EGF1–18; A9 TSR2–8, hADAMTS9 TSR2–8. fh, Bar graphs show quantified band intensity of protein normalized with IgG band intensity obtained in c (f), d (g) and e (h), respectively. All data are shown as mean ± s.d. from biological triplicates of three individual transfections (Supplementary Figs. 22–24). Data from cell lysates for c, d and e are in Supplementary Figs. 22–24. Statistical analysis was performed with unpaired, two-tailed t-test in Prism 7. NS, P > 0.05; *P < 0.1; **P < 0.01; ***P < 0.001; ****P < 0.0001 compared to control (WT cells). NS, not significant. Source data
Extended Data Fig. 1
Extended Data Fig. 1. Protein sequence alignment of human FUT10 and FUT11 with H. pylori FucT.
Clustal Omega alignment of human FUT10 and FUT11 sequences and H. pylori FucT sequence. Pink arrows highlight residues known to be essential for enzymatic activity and GDP-fucose binding in FucT, which are also conserved in both FUT10 and FUT11.
Extended Data Fig. 2
Extended Data Fig. 2. Alignment of human FUT10 and FUT11 AlphaFold2 structures with the crystal structure of H. pylori FucT.
a, AlphaFold2-multimer predicted structures of the human FUT10 (left) and FUT11 (right) proteins, compared to the crystal structure of FucT (PDB: 2NZW) shown in green. Essential residues have been shown in purple. Structures show strong homology within the GDP-fucose binding region but vary more elsewhere in the proteins. b, Highlighting the side chains of residues known to be essential for enzymatic activity and GDP-fucose binding in H. pylori FucT, alongside the aligned residue within human FUT10/11. Residue number is relative to the human FUT10/11 sequences. Side chains are shown to be of similar charge and orientation between each protein.
Extended Data Fig. 3
Extended Data Fig. 3. Protein sequence alignment of human GT10 family fucosyltransferases.
Clustal Omega alignment of all human GT10 family members (FUT3-7, FUT9-11) coloured by conservation percentage. The GDP-fucose binding region showing high conservation across all GT10 proteins has been bound by a red box.
Extended Data Fig. 4
Extended Data Fig. 4. Comparison of FUT10 and FUT11 AlphaFold2 structures with known crystal structure of human FUT9.
a, AlphaFold2-multimer predicted structures of human FUT10 (residues 81-479) and FUT11 (73-492) shown as surface depictions, colored by sequence conservation across human GT10 proteins. Residues colored in grey are areas unique to FUT10 or FUT11. The light green X marks the putative GDP-fucose binding site. b, Comparison of the crystal structure of human FUT9 (PDB: 8D0O) to predicted structures of FUT10 and FUT11 highlight their high structural similarity. The highly conserved GDP-fucose binding domain is bound by a black box. c, The GDP-fucose binding domain was isolated to analyze the high structural conservation in this region. The root mean squared deviation (RMSD) value comparing the structural similarity for either FUT10, or FUT11, against FUT9 is provided.
Extended Data Fig. 5
Extended Data Fig. 5. FUT10 and FUT11 have extended C-terminal regions absent in other human GT10 family proteins.
a, Clustal Omega alignment of the C-terminal region of all human GT10 family proteins (FUT3-7, FUT9-11), colored by conservation percentage. Residues highlighted in red indicate conserved residues found in the extended C-terminal region of FUT10 and FUT11. Predicted contacts (hydrogen bonds, van der Waal interactions) between FUT10/11 and the human MMRN1 EMI domain, as predicted by ChimeraX, are indicated by the pink arrows. Additionally, a disulfide-forming cysteine residue found in the C-terminus unique to FUT10 and FUT11 is indicated by the green arrow. b, AlphaFold2-multimer predicted structures of FUT10 and FUT11 with the extended C-terminal region highlighted in red. A unique disulfide bond absent from all other human GT10 family proteins is indicated by the black arrow. c, Predicted hydrogen bonds and van der Waal interactions between the C-terminus of FUT10/FUT11 and the human MMRN1 EMI domain substrate, are shown in magenta dashed line. Residue numbers shown in blue and orange refer to FUT10 and FUT11 sequences, respectively; red residue numbers refer to the EMI domain sequence.
Extended Data Fig. 6
Extended Data Fig. 6. Annotated EAD MS/MS spectra for the O-fucosylated MMRN2 and EMID1.
a, Domain organization of human MMRN1 protein compared to human MMRN2 and EMID1. The positions of O-linked fucosylation are shown as red triangles. Protein domains are illustrated: blue – EMI domain; green – coiled-coil region; red – EGF-like domain; orange – C1q domain; purple – collagen domain. b, Annotated EAD MS/MS spectra for the O-fucosylated human MMRN2 and EMID1 peptides expressed as FLAG-tagged fusion proteins in HEK293 cells. Eluates from FLAG-immunoprecipitation were trypsin digested into peptides and analyzed by targeted LC-MS/MS with electron activated dissociation (EAD) fragmentation. Ions in the MS/MS spectrum are annotated as either: c-ions, z.-ions, y-ions, bions, a-ions, ~y-ions with a neutral loss (for example whole glycan loss), M (intact precursor), M-Fuc (intact precursor with neutral loss of fucose), Fuc (fucose oxonium ion). Mass error for fragment matching is <20 ppm using the Byonic software package.
Extended Data Fig. 7
Extended Data Fig. 7. FUT10 and FUT11 are responsible for the O-fucosylation of EMI domains in MMRN2 and EMID1.
HEK293T WT and FUT10/11 DKO cells were transfected with constructs encoding the N-terminal EMI of human MMRN2 or EMID1 for 48 h. Proteins were purified from cultured medium and analyzed by nano-LC-MS/MS as described in Methods. EICs of different peptides containing O-fucose modifications were extracted. Red lines, O-fucose modified; black lines, unmodified. Spectra for the corresponding ions are in Supplementary Data 1.
Extended Data Fig. 8
Extended Data Fig. 8. Confocal immunofluorescence microscopy of endogenous FUT10 protein.
HeLa cells (a) or SCTI003-A human induced pluripotent stem cells (b) were stained for either the ER-marker protein disulfide isomerase (PDI) (red), or the cis-Golgi marker (GM130), alongside FUT10 (green) and DNA (DAPI, grey). Stained cells were imaged by confocal microscopy and a single slice is shown (n = 4). Scale bar is 10 μm. c, Confocal immunofluorescence microscopy images (n = 2) obtained from the Human Protein Atlas of human U2OS osteosarcoma cells stained for ether the ER-marker calreticulin (CALR) (red), endogenous FUT10 protein (green) and DNA (DAPI, blue).
Extended Data Fig. 9
Extended Data Fig. 9. Confocal immunofluorescence microscopy of endogenous FUT11 protein.
HeLa cells were stained for either the ER-marker protein disulfide isomerase (PDI) (red), or the cis-Golgi marker (GM130), alongside FUT11 (green) and DNA (DAPI, grey). Stained cells were imaged by confocal microscopy and a single slice is shown (n = 4). Scale bar is 10 μm.

Similar articles

Cited by

References

    1. Becker, D. J. & Lowe, J. B. Fucose: biosynthesis and biological function in mammals. Glycobiology13, 41R–53R (2003). - PubMed
    1. Li, J., Hsu, H. C., Mountz, J. D. & Allen, J. G. Unmasking fucosylation: from cell adhesion to immune system regulation and diseases. Cell Chem. Biol.25, 499–512 (2018). - PubMed
    1. Schneider, M., Al-Shareffi, E. & Haltiwanger, R. S. Biological functions of fucose in mammals. Glycobiology27, 601–618 (2017). - PMC - PubMed
    1. Lombard, V., Golaconda Ramulu, H., Drula, E., Coutinho, P. M. & Henrissat, B. The carbohydrate-active enzymes database (CAZy) in 2013. Nucleic Acids Res.42, D490–D495 (2014). - PMC - PubMed
    1. Oriol, R. & Mollicone, R. Fucosyltransferases 1, 2. GDP-fucose galactoside α2-fucosyltransferases. FUT1 or H blood group, FUT2 or ABH secretor status and Sec1 (FUT1, FUT2, Sec1). In Handbook of Glycosyltransferases and Related Genes 2nd edn (eds Taniguchi, N. et al) 515–530 (Springer, 2014).

LinkOut - more resources