. 2025 Jul;21(7):1046-1057.
doi: 10.1038/s41589-024-01812-0. Epub 2025 Jan 7.

Molecular mechanisms of inverse agonism via κ-opioid receptor-G protein complexes

Affiliations

Molecular mechanisms of inverse agonism via κ-opioid receptor-G protein complexes

Aaliyah S Tyson et al. Nat Chem Biol. 2025 Jul.

Abstract

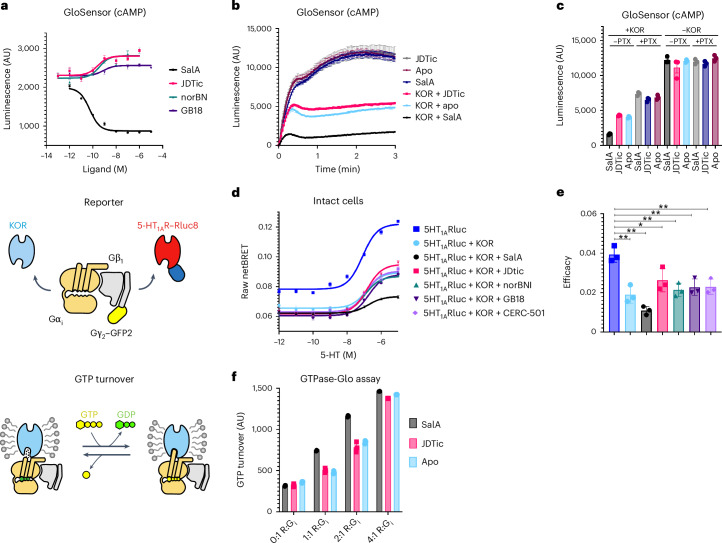
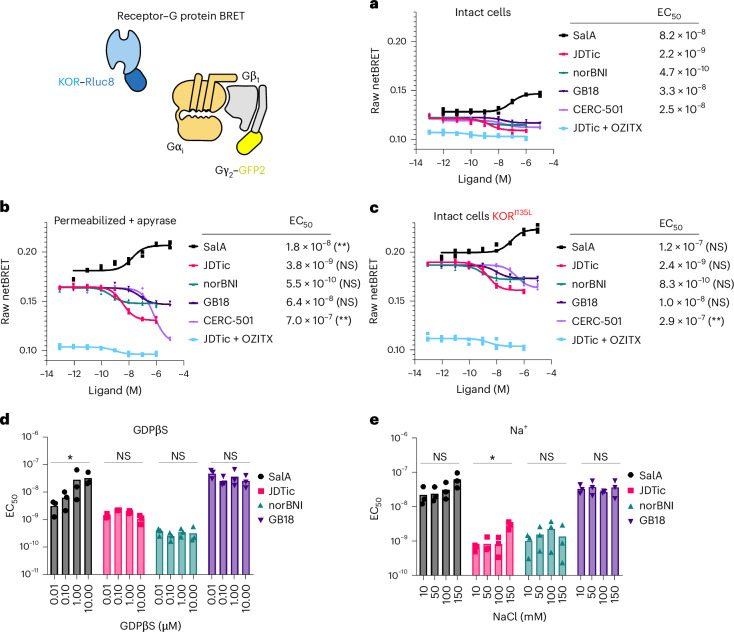
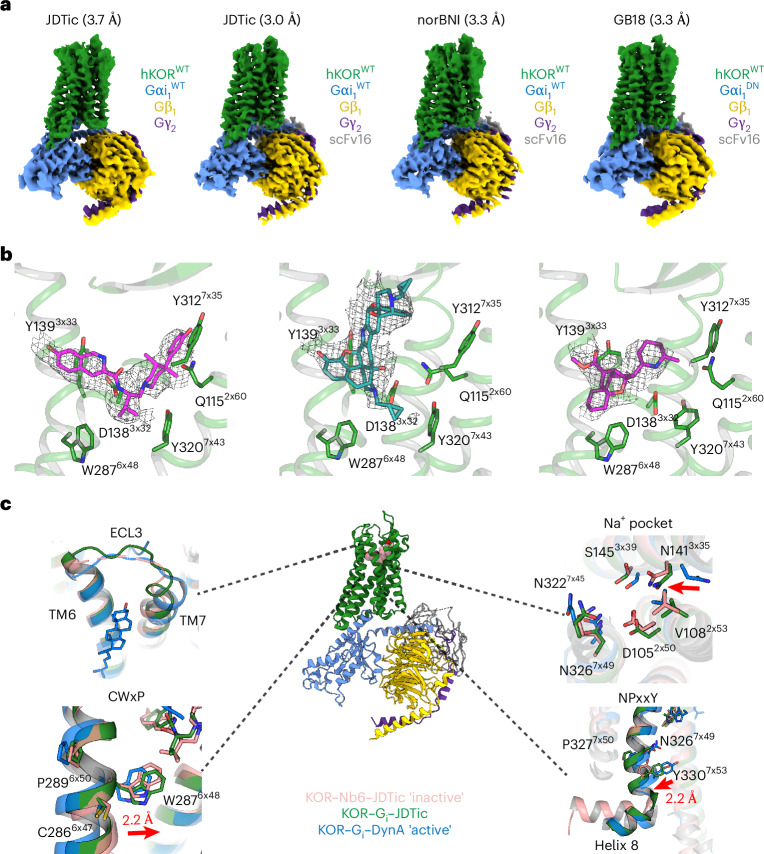
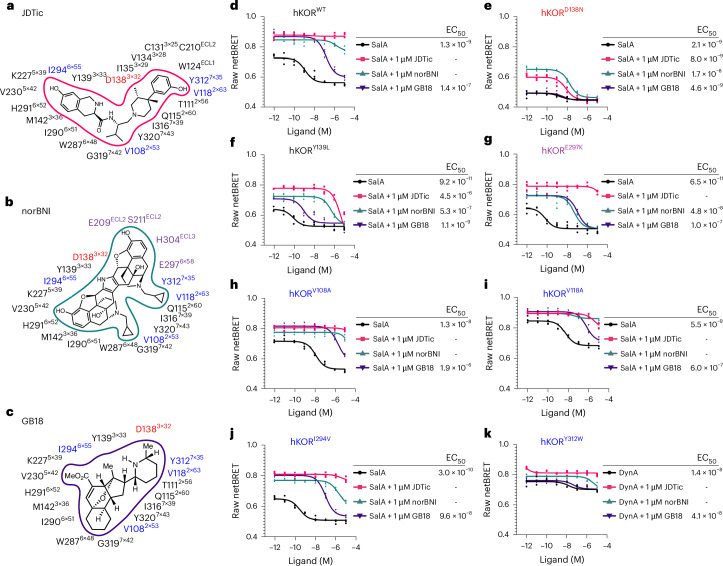
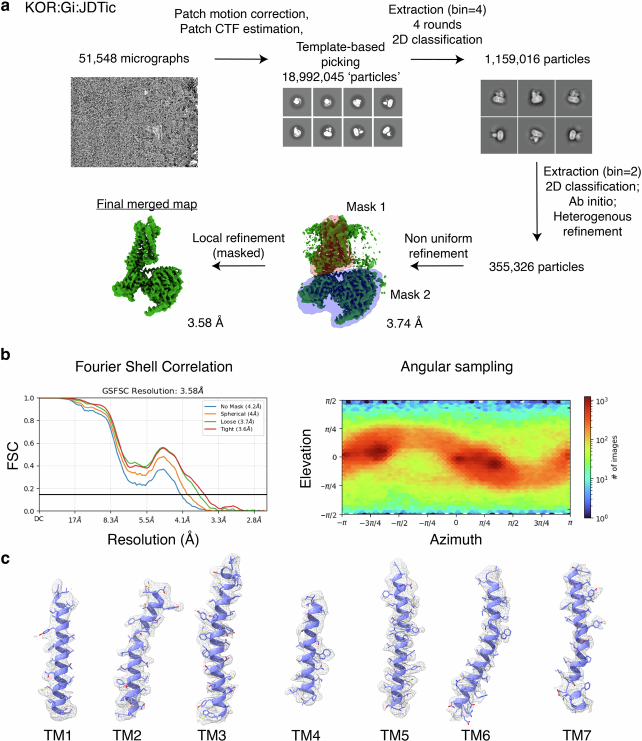
Opioid receptors, a subfamily of G protein-coupled receptors (GPCRs), are key therapeutic targets. In the canonical GPCR activation model, agonist binding is required for receptor-G protein complex formation, while antagonists prevent G protein coupling. However, many GPCRs exhibit basal activity, allowing G protein association without an agonist. The pharmacological impact of agonist-free receptor-G protein complexes is poorly understood. Here we present biochemical evidence that certain κ-opioid receptor (KOR) inverse agonists can act via KOR-Gi protein complexes. To investigate this phenomenon, we determined cryo-EM structures of KOR-Gi protein complexes with three inverse agonists: JDTic, norBNI and GB18, corresponding to structures of inverse agonist-bound GPCR-G protein complexes. Remarkably, the orthosteric binding pocket resembles the G protein-free 'inactive' receptor conformation, while the receptor remains coupled to the G protein. In summary, our work challenges the canonical model of receptor antagonism and offers crucial insights into GPCR pharmacology.


Conflict of interest statement

Competing interests: The authors declare no competing interests.

Figures

Fig. 1
Fig. 1. Basal activity and its role in inverse agonism at KOR.
a, cAMP inhibition assay (GloSensor) confirms inverse agonist activity of JDTic, norBNI and GB18. Data are a global fit of grouped data ±s.e.m. AU, arbitrary units. b, cAMP inhibition assay (GloSensor) to monitor the effect of basal KOR activity in the presence of agonist, inverse agonist and PTX. c, Efficacy bar plots from n = 3 biologically independent replicates of the kinetic GloSensor assay in b. d, Reporter assay (5-HT1AR-Rluc8 and Gαi1βγ–GFP2) in the absence and presence of KORWT. The addition of SalA decreases efficacy and potency of 5-HT, while all tested inverse agonists show minimal changes compared to the apo state. e, Efficacy bar plots from n = 3 biologically independent replicates of the reporter assay. Statistical analysis between groups was performed using a one-way ANOVA test, comparing the efficacy of each condition to that of the 5-HT1AR-Rluc8 control. f, GTPase-Glo assay to monitor GTP hydrolysis rates of recombinantly purified receptor and G protein in detergent micelles. Increasing ratios of receptor–G protein correlate with increased activity, while the addition of an agonist (SalA) and an inverse agonist (JDTic) can increase and modestly decrease GTP turnover rates. All plots are representative of three biologically independent experiments, with each experimental data point collected with three technical replicates. Traces show individual raw data points or the mean of each technical replicate with error bars depicting ±s.e.m., overlaid with nonlinear regression global fits, showing characteristic features for agonist and inverse agonist treatment. Asterisks denote statistical significance; **P < 0.01. Source data
Fig. 2
Fig. 2. BRET sensors reveal that inverse agonists are able to interact with both G protein-free and G protein-coupled KOR.
a, RG BRET (KOR–Rluc8 and Gαi1βγ–GFP2), intact cells. b, RG BRET (KOR–Rluc8 and Gαi1βγ–GFP2), permeabilized cells, nucleotide free. c, RG BRET (KORI135L–Rluc8 and Gαi1βγ–GFP2), intact cells. ac, Dose–response experiments, agonist SalA, inverse agonists JDTic, norBNI, GB18 and CERC-501. BRET signal increases in the presence of agonists and decreases for inverse agonists. ac, Cells coexpressing OZITX were used as a negative control. Plots are representative of three biologically independent experiments, with each data point carried out with three technical replicates. Traces show individual raw data points, overlaid with nonlinear regression global fits. Parentheses indicate unpaired two-tailed Student’s t-test results compared to the results from the corresponding conditions in untreated, intact cells in Fig. 2a. d, RG BRET (KOR–Rluc8 and Gαi1βγ–GFP2), permeabilized cells, nucleotide free: increasing concentrations of GDPβS (10 nM, 100 nM, 1 µM and 10 µM). e, RG BRET (KOR–Rluc8 and Gαi1βγ–GFP2), permeabilized cells, nucleotide free: increasing concentrations of NaCl (10 mM, 50 mM, 100 mM and 150 mM). d,e, Bar plots depict mean EC50 values from n = 3 biologically independent experiments. Unpaired two-tailed Student’s t-tests were conducted to compare nucleotide or Na+ treatment of each ligand. A significance threshold of α = 0.05 was applied for both the one-way ANOVA and the Student’s t-test analyses. Asterisks denote statistical significance; *P < 0.05, **P < 0.01; NS, not significant. Source data
Fig. 3
Fig. 3. Radioligand experiments confirm binding of inverse agonists to KOR–G complexes in native tissue.
Radioligand binding experiments in various buffer conditions were performed to study the effect of nucleotide and Na+ conditions on radioligand binding. a, Schematic representation of rat brain-derived membrane homogenates. b, Saturation binding [3H]JDTic: native rat brain membranes were treated with 0.09–12 nM [3H]JDTic in the presence of buffer, 150 mM NaCl, 10 µM GDPβS or both, showing that the addition of nucleotide does not have any significant effect, while Na+ increases kd. cpm, counts per minute. c, Saturation binding [3H]naltrexone: native rat brain membranes were treated with 0.09–12 nM [3H]naltrexone in the presence of buffer, 150 mM NaCl, 10 µM GDPβS or both. The experiments show that both nucleotide and Na+ influence [3H]naltrexone binding, confirming the presence of receptor–G protein complexes in rat brain membrane preparations. d, Association (kon) assays: rat brain membranes were treated with 1.5 nM [3H]JDTic. e, Dissociation (koff) assays: brain membranes were pre-incubated with 1.5 nM [3H]JDTic, followed by the addition of 10 µM ‘cold’ JDTic. f, Titration: concentration-dependent effects of NaCl and choline chloride in the presence of 1.5 nM [3H]JDTic. g, Titration: concentration-dependent effects of GDPβS and GDPβS with 150 mM NaCl in the presence of 1.5 nM [3H]JDTic. CholCl, choline chloride. All plots are representative of three biologically independent experiments, with each data point carried out with three technical replicates. All data points are plotted as values of specific binding (total binding minus nonspecific binding), and all corresponding error bars represent the mean of each technical replicate ±s.e.m., overlaid with nonlinear regression global fits. Source data
Fig. 4
Fig. 4. Structure determination of inverse agonist-bound KOR–Gi heterotrimer complexes.
a, Overview of high-resolution structures of KOR–Gi complexes, bound to JDTic, norBNI and GB18. h, human. b, Individual ligand densities (sticks with C atoms in magenta, teal or purple, O in red and N in blue), with ligand density (countered at 9 σ) and interacting residues in stick representation. c, Overview of structural features, which deviate from conventional receptor–G protein complexes, highlighting ECL3, Na+ pocket, CWxP and NPxxY motifs and helix 8. Corresponding structures are KOR–Nb6–JDTic (salmon; PDB 6VI4), KOR–Gi–JDTic (green; this work) and KOR–Gi–dynorphin (blue; PDB 8F7W).
Fig. 5
Fig. 5. Mutagenesis of the orthosteric binding pocket at KOR.
Experiments were carried out with WT and mutant KOR, deploying the TRUPATH sensor pair Gαi–Rluc8–Gβ1–Gγ2–GFP2. ac, Schematic depiction of the orthosteric binding pocket of JDTic (a), norBNI (b) and GB18 (c) in KOR–Gi protein complex structures, with corresponding residue numbers involved in interaction with the respective ligand. Red, D138 is highlighted as an important residue of the orthosteric binding pocket; blue, residues proposed to be responsible for selectivity; purple, residues unique to norBNI binding. Me, methyl. dk, Experiments of selected point mutations on ligand potency and efficacy in antagonist mode competing with SalA (dj) and DynA (k) as a reference agonist. All plots are representative of three biologically independent experiments, with each data point carried out with three technical replicates. Traces show individual raw data points, overlaid with nonlinear regression fits, showing characteristic features for agonist and inverse agonist treatment. Source data
Fig. 6
Fig. 6. Proposed model of inhibition at KOR via interaction with G protein-free and receptor–G protein complexes.
a, Schematic highlighting a mixture of microswitch conformations and transmembrane domain (TMD) rearrangements observed in inverse agonist-bound KOR–Gi protein structures. b, Classical model of GPCR antagonism describes steric hindrance of receptor–G protein complexes, resulting in decreased G protein activation. c, Proposed model of inhibition at KOR, where, in the presence of significant levels of basal activity, neutral antagonists have to be able to adopt multiple conformational states. Inverse agonists could potentially achieve negative efficacy by decreasing G protein activation levels by either blocking G protein coupling, GDP release, GTP binding or all of the above.
Extended Data Fig. 1
Extended Data Fig. 1. cAMP-Glosensor and BRET-based assays to monitor cAMP production, and the status of the G protein heterotrimer, or KOR:G protein complex.
a) Kinetic cAMP inhibition assay with increasing concentrations of wildtype KOR plasmid in the absence of ligand (apo), presence of full agonist SalA and inverse agonist JDTic. b) corresponding bar plot of A, showing final concentrations of cAMP among the treatment groups, highlighting that JDTic concentrations never revert cAMP production levels back to baseline. Parenthesis show statistical analysis between groups, performed using a one-way ANOVA test, comparing the final cAMP production levels of JDTic treated conditions to the GloSensor alone control (blue). c) Kinetic cAMP inhibition assay with increasing concentrations of wildtype KOR plasmid (0.5, 1, and 4 µg/ml) to monitor basal activity. d) Kinetic cAMP inhibition assay with increasing concentrations of I135L mutant KOR plasmid (0.5, 1, and 4 µg/ml) to monitor basal activity, showing enhanced constitutive activity. e) TRUPATH, intact cells, confirming inverse agonism of JDTic, norBNI, GB18, CERC-501, compared to full agonist SalA. All plots are representative of three biologically independent experiments, with each experimental data point collected with three technical replicates. Traces show individual raw data points or the mean of each technical replicate with error bars depicting ± s.e.m, overlaid with non-linear regression global fits, showing characteristic features for agonist and inverse agonist treatment. Asterisks denote statistical significance; *P < 0.05, **P < 0.01, ***P < 0.001; ****P < 0.0001; NS represents not significant. Source data
Extended Data Fig. 2
Extended Data Fig. 2. Reporter receptor assay monitors release of heterotrimeric G proteins from KOR to 5-HT1AR.
ae) Reporter assay in intact cells, BRET between reporter 5-HT1AR-Rluc8 and Gαi1βγ-GFP2, wildtype or KORI135L coexpressed, showing 5-HT dose response (+ 1 µM JDTic, norBNI, GB18 or SalA) confirming modulation of interactions between 5-HT1AR-Rluc8 and G protein, through KOR-selective ligands. b) shows reporter assay with KORI135L confirms enhanced basal activity of the mutant. f, g) Control experiments in the absence of KOR expression plasmid, showing no effect of KOR-selective ligands at the 5-HT1AR reporter. All plots are representative of three biologically independent experiments, with each data point carried out with three technical replicates. Traces show individual raw data points, overlaid with non-linear regression fits. Source data
Extended Data Fig. 3
Extended Data Fig. 3. Radioligand binding experiments in KOR expressing HEK293 membranes.
a) Saturation binding [3H]-JDTic: HEK293F membranes expressing human wildtype KOR were treated with 0.09 nM - 12 nM [3H]-JDTic in the presence of buffer, 150 mM NaCl, 10 µM GDPβS or both, showing that none of the treatments result in any significant change in binding of [3H]-JDTic. b) Saturation binding [3H]-Naltrexone: native rat brain membranes were treated with 0.09 nM - 12 nM [3H]-Naltrexone in the presence of buffer, 150 mM NaCl, 10 µM GDPβS or both, showing that both Na+ and GDPβS dampen [3H]-Naltrexone binding to membranes, confirming presence of KOR:G protein complexes. c) Association (kon) assays: HEK293 membranes were treated with 1.5 nM [3H]-JDTic for time points spanning 1 min to 20 mins. d) Dissociation (koff) assays: HEK293 membranes were preincubated with 1.5 nM [3H]-JDTic, followed by the addition of 10 µM ‘cold’ JDTic for between 2 mins and 60 mins. e) Titration: Dose dependent effects of NaCl and CholineCl in the presence of 1.5 nM [3H]-JDTic. All plots are representative of three biologically independent experiments, with each data point carried out with three technical replicates. All data points are plotted as values of specific binding (total binding minus non-specific binding), and all corresponding error bars represent the mean of each technical replicate ± s.e.m, overlaid with non-linear regression fits. Source data
Extended Data Fig. 4
Extended Data Fig. 4. Summary of sequences and biochemistry involved in all structural and functional experiments.
a) Overview of constructs used for structure determination (pFastBac) and functional characterization through BRET and GloSensor assays (pcDNA). b) Size-exclusion chromatography traces of purified samples. Gray bar highlights fractions pooled for final cryoEM samples. c) Purified KOR:G protein complexes used for cryoEM structure determination, confirming the presence of all components (KOR, Gαi, Gβ, Gγ, with and without scFv16). Source data
Extended Data Fig. 5
Extended Data Fig. 5. CryoEM reconstruction of wild-type human KOR in complex with Gαi, in the presence of JDTic.
a) Workflow of cryoEM processing of KOR in complex with JDTic with representative micrograph, picking templates and 2D classes. Data processing was entirely performed in cryoSPARC. After motion correction, CTF estimation and particle picking, the dataset was sorted using 2D classification, followed by 3D ab initio reconstruction and heterogenous refinement for further clean-up of the particle stack. Finally, 3D reconstructions were performed using non-uniform refinement57 and local refinement, which yielded a final map of 3.6 Å resolution. b) Data quality of the final reconstruction, illustrated as a gold-standard fourier shell correlation plot (masked and unmasked) and angular sampling of the final reconstruction. c) Highlighting coulomb potential maps of individual transmembrane domains TM1-TM7.
Extended Data Fig. 6
Extended Data Fig. 6. CryoEM reconstruction of wild-type human KOR in complex with Gαi and scFv16, in the presence of JDTic.
a) Workflow of cryoEM processing of KOR in complex with JDTic with representative micrograph, picking templates and 2D classes. Data processing was entirely performed in cryoSPARC. After motion correction, CTF estimation and particle picking, the dataset was sorted using 2D classification, followed by 3D ab initio reconstruction and heterogenous refinement for further clean-up of the particle stack. Finally, 3D reconstructions were performed using non-uniform refinement57 and local refinement, which yielded a final map of 3.0 Å resolution. b) Data quality of the final reconstruction, illustrated as a gold-standard fourier shell correlation plot (masked and unmasked) and angular sampling of the final reconstruction. c) Highlighting coulomb potential maps of individual transmembrane domains TM1-TM7.
Extended Data Fig. 7
Extended Data Fig. 7. CryoEM reconstruction of wild-type human KOR in complex with Gαi and scFv16, in the presence of norBNI.
a) Workflow of cryoEM processing of KOR in complex with JDTic with representative micrograph, picking templates and 2D classes. Data processing was entirely performed in cryoSPARC. After motion correction, CTF estimation and particle picking, the dataset was sorted using 2D classification, followed by 3D ab initio reconstruction and heterogenous refinement for further clean-up of the particle stack. Finally, 3D reconstructions were performed using non-uniform refinement57 and local refinement, which yielded a final map of 3.3 Å resolution. b) Data quality of the final reconstruction, illustrated as a gold-standard fourier shell correlation plot (masked and unmasked) and angular sampling of the final reconstruction. c) Highlighting coulomb potential maps of individual transmembrane domains TM1-TM7.
Extended Data Fig. 8
Extended Data Fig. 8. CryoEM reconstruction of wildtype human KOR in complex with Gαi and scFv16, in the presence of GB18.
a) Workflow of cryoEM processing of KOR in complex with JDTic with representative micrograph, picking templates and 2D classes. Data processing was entirely performed in cryoSPARC. After motion correction, CTF estimation and particle picking, the dataset was sorted using 2D classification, followed by 3D ab initio reconstruction and heterogenous refinement for further clean-up of the particle stack. Finally, 3D reconstructions were performed using non-uniform refinement57 and local refinement, which yielded a final map of 3.3 Å resolution. b) Data quality of the final reconstruction, illustrated as a gold-standard fourier shell correlation plot (masked and unmasked) and angular sampling of the final reconstruction. c) Highlighting coulomb potential maps of individual transmembrane domains TM1-TM7.
Extended Data Fig. 9
Extended Data Fig. 9. Comparison of microswitch motifs between inverse agonist-bound KOR:G protein complexes.
Overview of structural features, which deviate from conventional ‘active’ receptor:G protein complexes, highlighting ECL3, Na+ pocket, CWxP and NPxxY motifs, and helix 8. Corresponding structures are (salmon) KOR:Nb6:JDTic (PDB: 6VI4), (green) KOR:Gαi:JDTic/norBNI/GB18 (this work), and (blue) KOR:Gαi:dynorphin (PDB: 8F7W).

References

    1. Hauser, A. S., Attwood, M. M., Rask-Andersen, M., Schiöth, H. B. & Gloriam, D. E. Trends in GPCR drug discovery: new agents, targets and indications. Nat. Rev. Drug Discov.16, 829–842 (2017). - PMC - PubMed
    1. Chavkin, C., James, I. F. & Goldstein, A. Dynorphin is a specific endogenous ligand of the κ opioid receptor. Science215, 413–415 (1982). - PubMed
    1. Pasternak, G. & Pan, Y.-X. Mu opioid receptors in pain management. Acta Anaesthesiol. Taiwan49, 21–25 (2011). - PMC - PubMed
    1. Che, T. & Roth, B. L. Structural insights accelerate the discovery of opioid alternatives. Annu. Rev. Biochem.90, 739–761 (2021). - PubMed
    1. Akins, N. S. et al. Alleviation of cocaine withdrawal and pertinent interactions between salvinorin-based antagonists and κ opioid receptor. ACS Chem. Neurosci.14, 958–976 (2023). - PubMed

MeSH terms

LinkOut - more resources