. 2025 Jan 7;21(1):e1012749.
doi: 10.1371/journal.pcbi.1012749. eCollection 2025 Jan.

Aggregating multiple test results to improve medical decision-making

Affiliations

Aggregating multiple test results to improve medical decision-making

Lucas Böttcher et al. PLoS Comput Biol. .

Erratum in

Abstract

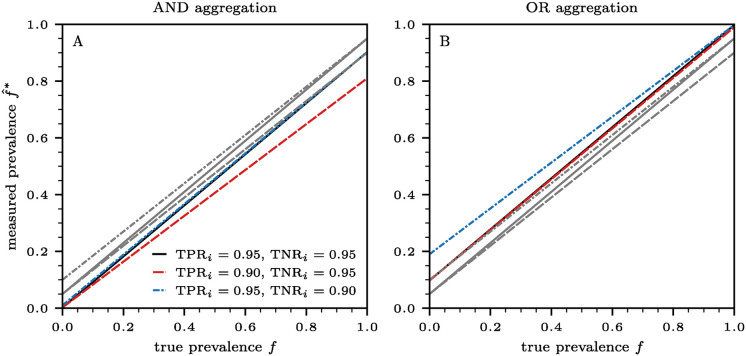
Gathering observational data for medical decision-making often involves uncertainties arising from both type I (false positive) and type II (false negative) errors. In this work, we develop a statistical model to study how medical decision-making can be improved by aggregating results from repeated diagnostic and screening tests. Our approach is relevant to not only clinical settings such as medical imaging, but also to public health, as highlighted by the need for rapid, cost-effective testing methods during the SARS-CoV-2 pandemic. Our model enables the development of testing protocols with an arbitrary number of tests, which can be customized to meet requirements for type I and type II errors. This allows us to adjust sensitivity and specificity according to application-specific needs. Additionally, we derive generalized Rogan-Gladen estimates of disease prevalence that account for an arbitrary number of tests with potentially different type I and type II errors. We also provide the corresponding uncertainty quantification.


Conflict of interest statement

The authors have declared that no competing interests exist.

Figures

Fig 1
Fig 1. Parallel and series testing protocols using two tests.
Positive (+) and negative (−) test outcomes are combined using the two Boolean functions AND (formula image) and OR (formula image
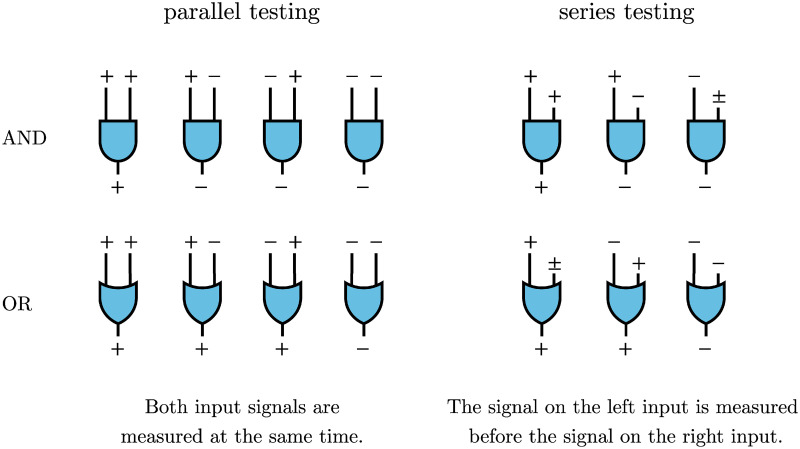
). In parallel testing, both inputs are assessed simultaneously, while in series testing, the left input is examined before the right. Hence, if the initial test in a series protocol yields a negative result with aggregation through an AND gate, the assigned disease status will be negative, irrespective of the second input. In series testing with an OR gate, the assigned disease status will be positive if the first test is positive, regardless of the outcome of the second test.
Fig 2
Fig 2. The ratio of the number of parallel tests to the number of series tests necessary to determine the aggregated output from n = 2 tests as a function of prevalence f.
Results in panels (A) and (B) are based on AND and OR aggregations of two tests, using Eqs (11) and (12), respectively. We consider three different combinations of true positive and true negative rates (solid black lines: TNR1 = 0.95 and TNR1 = 0.95; dashed red lines: TNR1 = 0.90 and TNR1 = 0.95; dash-dotted blue lines: TNR1 = 0.95 and TNR1 = 0.90). The critical values fc for which the ratios in panel (A) are larger than the ratios in panel (B) are given, respectively, by fc = 0.50, 0.47, 0.53. For f < fc greater savings are achieved by utilizing the AND-aggregated series tests, compared to the OR-aggregated series test.
Fig 3
Fig 3. Positive predictive value (PPV) and negative predictive value (NPV) as a function of prevalence f.
The results that we show in panels (A,C) and (B,D) are based on AND and OR aggregations of n = 2 tests, using Eqs (14) and (15), respectively. We denote the sensitivities and specificities of the two tests i ∈ {1, 2} by TNRi and TNRi, respectively. We consider two different combinations of true positive and true negative rates (solid black lines: TNRi = 0.95 and TNRi = 0.95; dashed red lines: TNRi = 0.90 and TNRi = 0.90). As a reference, we also show results for single tests without further aggregation (dash-dotted blue line: TNR = 0.95 and TNR = 0.95; dash-dot-dotted orange line: TNR = 0.90 and TNR = 0.90). These curves are independent of the ordering (parallel or series) method used.
Fig 4
Fig 4. Receiver operating characteristic (ROC) curves for various combinations of tests and aggregation functions.
(A) We consider n = 2 tests and two distinct aggregation functions (disks: AND aggregation; triangles: OR aggregation). (B) We consider n = 3 tests and the same aggregation functions as in panel (A) along with the majority function represented by inverted triangles. Markers in black, blue, and red represent combined tests where the underlying tests i ∈ {1, …, n} have sensitivities (TPRi) and specificities (TNRi) set to 0.8, 0.9, and 0.95, respectively. Dashed lines indicate the sensitivities and false positive rates (i.e., 1 − TNR) of the individual isolated tests. Under AND aggregation, both the sensitivities and false positive rates of the combined tests are smaller than those of the individual tests. The opposite holds for OR aggregation. When considering n = 3 tests, the majority function results in higher sensitivities and smaller false positive rates compared to the individual isolated tests. This function provides a tradeoff between the “all” and “any” characteristics of AND and OR aggregations. The results shown are independent of the ordering (parallel or series) method used. The error bars in both panels represent the bounds defined by the Boole–Fréchet inequalities (see Materials and methods), which apply irrespective of the dependence structure relating the individual tests.
Fig 5
Fig 5. ROC curves associated with the aggregation of three antigen tests (Abbot, Innova, and Siemens).
The sensitivities and specificities of the n = 3 tests are listed in Table 2. (A) The ROC curve associated with the aggregation of the three antigen tests as derived from Eqs (33) and (35). We use Yi ∈ {0, 1} to denote the outcome of test i ∈ {1, 2, 3}. The dashed curve is a visual guide connecting the tests on the ROC curve. (B) A magnified view of the ROC curve without the trivial combined tests that classify all samples as either negative or positive. The error bars indicate the 95% CIs that we generated from 106 samples of beta distributions capturing the 95% CIs of the underlying individual sensitivities and specificities.
Fig 6
Fig 6. Measured prevalence f^* as a function of true prevalence f under the assumption that the measured, error-corrected prevalence f^ in Eq (37) can be identified with the true prevalence f.
The results shown in panels (A) and (B) are based on AND andOR aggregations of two tests i ∈ {1, 2}, respectively. We consider three different combinations of true positive and true negative rates (solid black lines:TNRi = 0.95 and TNRi = 0.95; dashed red lines: TNRi = 0.90 and TNRi = 0.95; dash-dotted blue lines: TNRi = 0.95 and TNRi = 0.90). Grey lines indicate measured prevalences associated with individual tests.
Fig 7
Fig 7. Probability density functions (PDFs) of dependence factors (A) λ11|1(ij) (see Eq (46)) and (B) λ00|0(ij) (see Eq (47)).

Similar articles

  • Signs and symptoms to determine if a patient presenting in primary care or hospital outpatient settings has COVID-19.
    Struyf T, Deeks JJ, Dinnes J, Takwoingi Y, Davenport C, Leeflang MM, Spijker R, Hooft L, Emperador D, Domen J, Tans A, Janssens S, Wickramasinghe D, Lannoy V, Horn SRA, Van den Bruel A; Cochrane COVID-19 Diagnostic Test Accuracy Group. Struyf T, et al. Cochrane Database Syst Rev. 2022 May 20;5(5):CD013665. doi: 10.1002/14651858.CD013665.pub3. Cochrane Database Syst Rev. 2022. PMID: 35593186 Free PMC article.
  • Rapid, point-of-care antigen tests for diagnosis of SARS-CoV-2 infection.
    Dinnes J, Sharma P, Berhane S, van Wyk SS, Nyaaba N, Domen J, Taylor M, Cunningham J, Davenport C, Dittrich S, Emperador D, Hooft L, Leeflang MM, McInnes MD, Spijker R, Verbakel JY, Takwoingi Y, Taylor-Phillips S, Van den Bruel A, Deeks JJ; Cochrane COVID-19 Diagnostic Test Accuracy Group. Dinnes J, et al. Cochrane Database Syst Rev. 2022 Jul 22;7(7):CD013705. doi: 10.1002/14651858.CD013705.pub3. Cochrane Database Syst Rev. 2022. PMID: 35866452 Free PMC article.
  • Measures implemented in the school setting to contain the COVID-19 pandemic.
    Krishnaratne S, Littlecott H, Sell K, Burns J, Rabe JE, Stratil JM, Litwin T, Kreutz C, Coenen M, Geffert K, Boger AH, Movsisyan A, Kratzer S, Klinger C, Wabnitz K, Strahwald B, Verboom B, Rehfuess E, Biallas RL, Jung-Sievers C, Voss S, Pfadenhauer LM. Krishnaratne S, et al. Cochrane Database Syst Rev. 2022 Jan 17;1(1):CD015029. doi: 10.1002/14651858.CD015029. Cochrane Database Syst Rev. 2022. Update in: Cochrane Database Syst Rev. 2024 May 2;5:CD015029. doi: 10.1002/14651858.CD015029.pub2. PMID: 35037252 Free PMC article. Updated.
  • Antibody tests for identification of current and past infection with SARS-CoV-2.
    Fox T, Geppert J, Dinnes J, Scandrett K, Bigio J, Sulis G, Hettiarachchi D, Mathangasinghe Y, Weeratunga P, Wickramasinghe D, Bergman H, Buckley BS, Probyn K, Sguassero Y, Davenport C, Cunningham J, Dittrich S, Emperador D, Hooft L, Leeflang MM, McInnes MD, Spijker R, Struyf T, Van den Bruel A, Verbakel JY, Takwoingi Y, Taylor-Phillips S, Deeks JJ; Cochrane COVID-19 Diagnostic Test Accuracy Group. Fox T, et al. Cochrane Database Syst Rev. 2022 Nov 17;11(11):CD013652. doi: 10.1002/14651858.CD013652.pub2. Cochrane Database Syst Rev. 2022. PMID: 36394900 Free PMC article.
  • The effect of sample site and collection procedure on identification of SARS-CoV-2 infection.
    Davenport C, Arevalo-Rodriguez I, Mateos-Haro M, Berhane S, Dinnes J, Spijker R, Buitrago-Garcia D, Ciapponi A, Takwoingi Y, Deeks JJ, Emperador D, Leeflang MMG, Van den Bruel A; Cochrane COVID-19 Diagnostic Test Accuracy Group. Davenport C, et al. Cochrane Database Syst Rev. 2024 Dec 16;12(12):CD014780. doi: 10.1002/14651858.CD014780. Cochrane Database Syst Rev. 2024. PMID: 39679851 Free PMC article.

Cited by

References

    1. Dinnes J, Sharma P, Berhane S, van Wyk S, Nyaaba N, Domen J, et al. Rapid, point-of-care antigen tests for diagnosis of SARS-CoV-2 infection. Cochrane Database of Systematic Reviews. 2022;7(7). doi: 10.1002/14651858.CD013705.pub3 - DOI - PMC - PubMed
    1. Glaros AG, Kline RB. Understanding the accuracy of tests with cutting scores: The sensitivity, specificity, and predictive value model. Journal of Clinical Psychology. 1988;44(6):1013–1023. doi: 10.1002/1097-4679(198811)44:6<1013::AID-JCLP2270440627>3.0.CO;2-Z - DOI - PubMed
    1. Akobeng AK. Understanding diagnostic tests 1: sensitivity, specificity and predictive values. Acta Paediatrica. 2007;96(3):338–341. doi: 10.1111/j.1651-2227.2006.00180.x - DOI - PubMed
    1. Brohall G, Behre CJ, Hulthe J, Wikstrand J, Fagerberg B. Prevalence of diabetes and impaired glucose tolerance in 64-year-old Swedish women: experiences of using repeated oral glucose tolerance tests. Diabetes Care. 2006;29(2):363–367. doi: 10.2337/diacare.29.02.06.dc05-1229 - DOI - PubMed
    1. Kermani SK, Khatony A, Jalali R, Rezaei M, Abdi A. Accuracy and precision of measured blood sugar values by three glucometers compared to the standard technique. Journal of Clinical and Diagnostic Research. 2017;11(4):OC05. doi: 10.7860/JCDR/2017/23926.9613 - DOI - PMC - PubMed