

Characterizing the services provided by family physicians in Ontario, Canada: A retrospective study using administrative billing data
- PMID: 39775232
- PMCID: PMC11709308
- DOI: 10.1371/journal.pone.0316554
Characterizing the services provided by family physicians in Ontario, Canada: A retrospective study using administrative billing data
Abstract
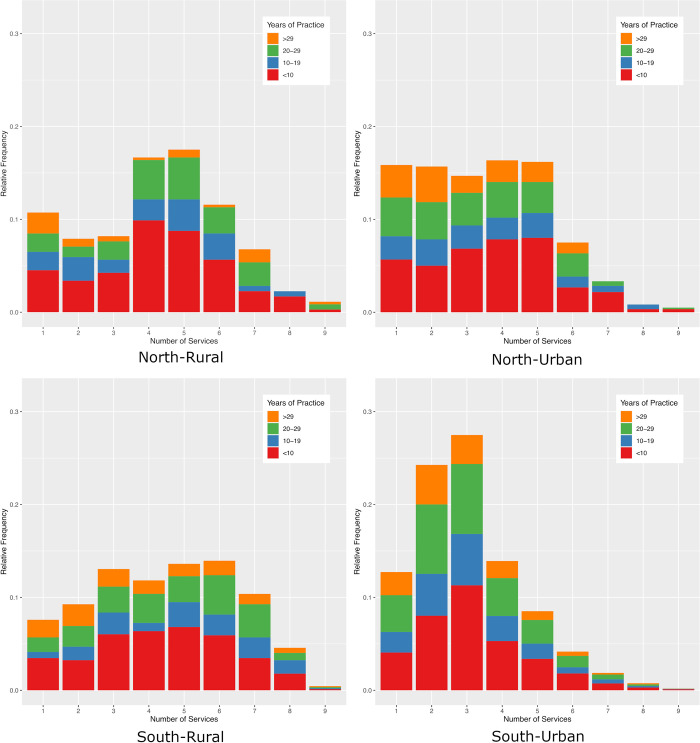
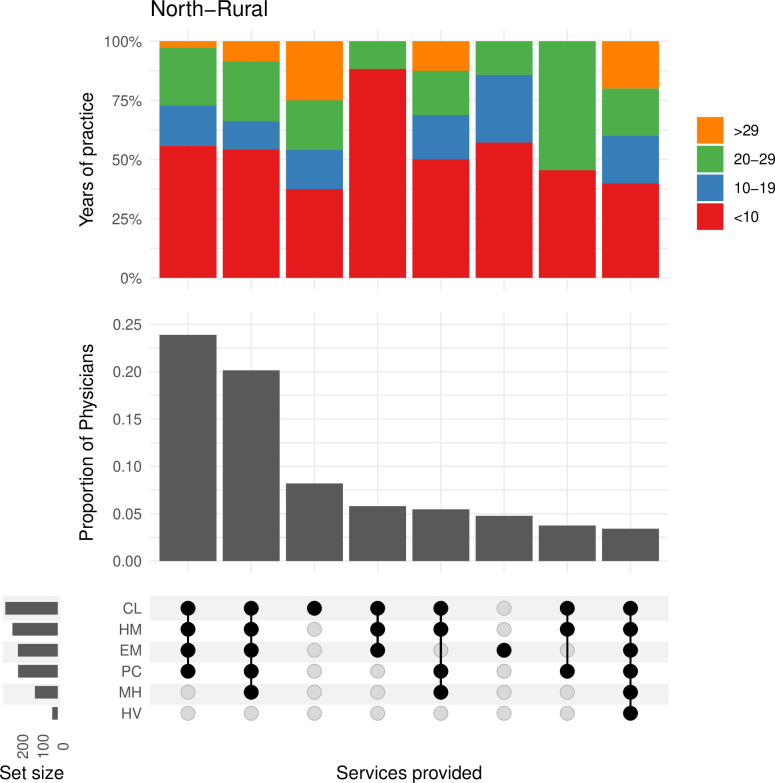
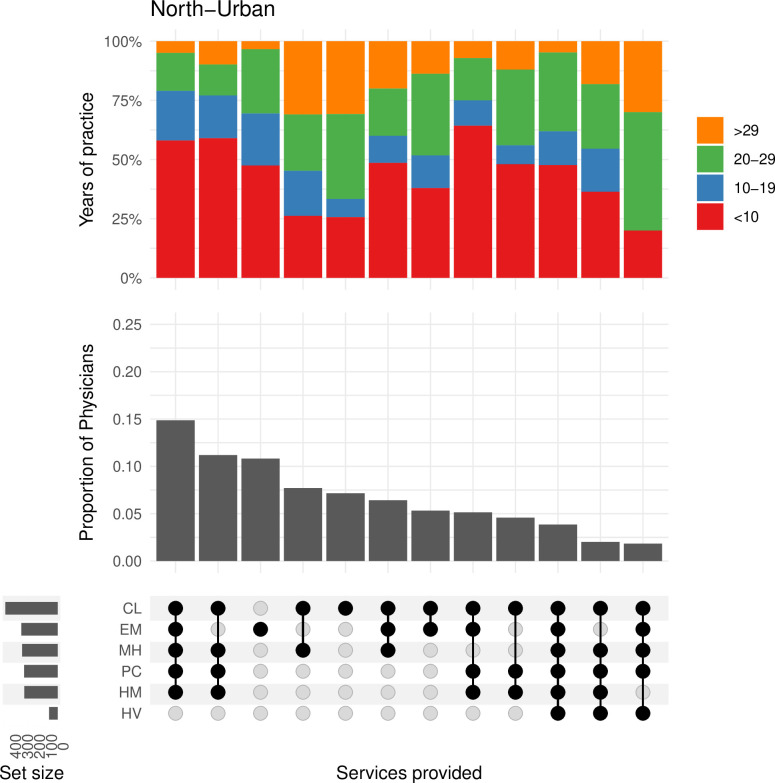
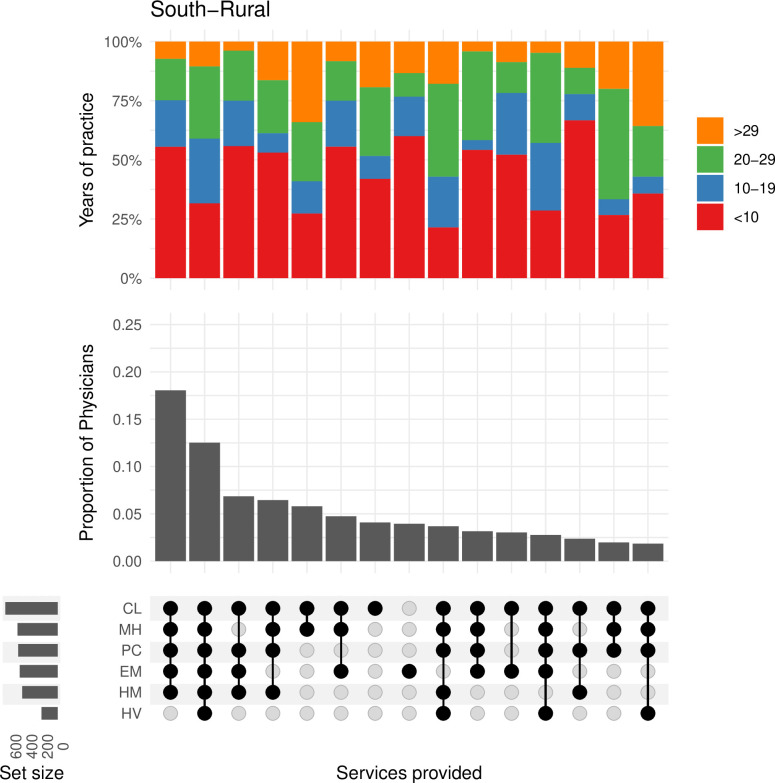
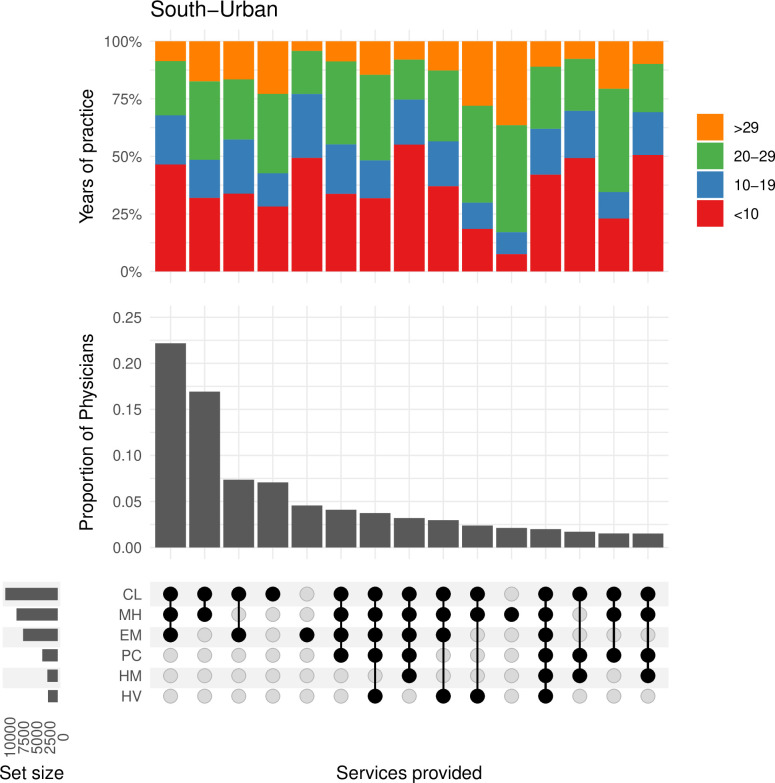
Family physicians in Ontario provide most of the primary care to the healthcare system. However, given their broad scope of practice, they often provide additional services including emergency medicine, hospital medicine, and palliative care. Understanding the spectrum of services provided by family physicians across different regions is important for health human resource planning (HHRP). We investigated the services provided by family physicians in Ontario, Canada using a provincial physician database and administrative physician billing data from 2017. Billing codes were used to define 18 general services that family physicians may provide. We then evaluated variation in the services provided by different physicians based on the physicians' geographic location (north-urban, north-rural, south-urban, and south-rural) and career stage (i.e., years in practice). Ontario had 14,443 family physicians in 2017, with most practicing in urban communities in southern Ontario and only 6.5% practicing in any setting in northern Ontario. In general, rural physicians provided a greater range of services than their urban colleagues. Their practices most often included clinic medicine, mental health services, emergency medicine, palliative care, and hospital medicine. Physicians in urban southern Ontario and those at a more advanced career stage were more likely to provide a narrower range of services. Overall, our findings have the potential to shape HHRP, medical education curriculum development, and clinical services planning in Ontario and elsewhere. Moreover, our results provide policy- and decision-makers with a basis for integrating knowledge of the specific clinical services delivered by family physicians into their future planning, with the goal of ensuring a fit-for-purpose workforce able to meet community healthcare needs.
Copyright: © 2025 Savage et al. This is an open access article distributed under the terms of the Creative Commons Attribution License, which permits unrestricted use, distribution, and reproduction in any medium, provided the original author and source are credited.
Conflict of interest statement
None
Figures
References
-
- Birch S. Health human resource planning for the new millennium: inputs in the production of health, illness, and recovery in populations. Can J Nurs Res 2002;33:109–14. - PubMed
MeSH terms
LinkOut - more resources
Full Text Sources
