Fitness landscapes of human microsatellites
- PMID: 39775235
- PMCID: PMC11734926
- DOI: 10.1371/journal.pgen.1011524
Fitness landscapes of human microsatellites
Abstract
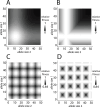
Advances in DNA sequencing technology and computation now enable genome-wide scans for natural selection to be conducted on unprecedented scales. By examining patterns of sequence variation among individuals, biologists are identifying genes and variants that affect fitness. Despite this progress, most population genetic methods for characterizing selection assume that variants mutate in a simple manner and at a low rate. Because these assumptions are violated by repetitive sequences, selection remains uncharacterized for an appreciable percentage of the genome. To meet this challenge, we focus on microsatellites, repetitive variants that mutate orders of magnitude faster than single nucleotide variants, can harbor substantial variation, and are known to influence biological function in some cases. We introduce four general models of natural selection that are each characterized by just two parameters, are easily simulated, and are specifically designed for microsatellites. Using a random forests approach to approximate Bayesian computation, we fit these models to carefully chosen microsatellites genotyped in 200 humans from a diverse collection of eight populations. Altogether, we reconstruct detailed fitness landscapes for 43 microsatellites we classify as targets of selection. Microsatellite fitness surfaces are diverse, including a range of selection strengths, contributions from dominance, and variation in the number and size of optimal alleles. Microsatellites that are subject to selection include loci known to cause trinucleotide expansion disorders and modulate gene expression, as well as intergenic loci with no obvious function. The heterogeneity in fitness landscapes we report suggests that genome-scale analyses like those used to assess selection targeting single nucleotide variants run the risk of oversimplifying the evolutionary dynamics of microsatellites. Moreover, our fitness landscapes provide a valuable visualization of the selective dynamics navigated by microsatellites.
Copyright: © 2024 Haasl, Payseur. This is an open access article distributed under the terms of the Creative Commons Attribution License, which permits unrestricted use, distribution, and reproduction in any medium, provided the original author and source are credited.
Conflict of interest statement
The authors have declared that no competing interests exist.
Figures


Similar articles
-
Microsatellites as targets of natural selection.Mol Biol Evol. 2013 Feb;30(2):285-98. doi: 10.1093/molbev/mss247. Epub 2012 Oct 27. Mol Biol Evol. 2013. PMID: 23104080 Free PMC article.
-
A microsatellite-based analysis for the detection of selection on BTA1 and BTA20 in northern Eurasian cattle (Bos taurus) populations.Genet Sel Evol. 2010 Aug 6;42(1):32. doi: 10.1186/1297-9686-42-32. Genet Sel Evol. 2010. PMID: 20691068 Free PMC article.
-
Searching for evidence of positive selection in the human genome using patterns of microsatellite variability.Mol Biol Evol. 2002 Jul;19(7):1143-53. doi: 10.1093/oxfordjournals.molbev.a004172. Mol Biol Evol. 2002. PMID: 12082133
-
[Human microsatellites: mutation and evolution].Genetika. 2004 Oct;40(10):1301-18. Genetika. 2004. PMID: 15575498 Review. Russian.
-
Microsatellite and trinucleotide-repeat evolution: evidence for mutational bias and different rates of evolution in different lineages.Philos Trans R Soc Lond B Biol Sci. 1999 Jun 29;354(1386):1095-9. doi: 10.1098/rstb.1999.0465. Philos Trans R Soc Lond B Biol Sci. 1999. PMID: 10434312 Free PMC article. Review.
References
MeSH terms
Grants and funding
LinkOut - more resources
Full Text Sources

