. 2024 Dec 30;20(12):e1012715.
doi: 10.1371/journal.pcbi.1012715. eCollection 2024 Dec.

Systematic benchmarking of deep-learning methods for tertiary RNA structure prediction

Affiliations

Systematic benchmarking of deep-learning methods for tertiary RNA structure prediction

Akash Bahai et al. PLoS Comput Biol. .

Abstract

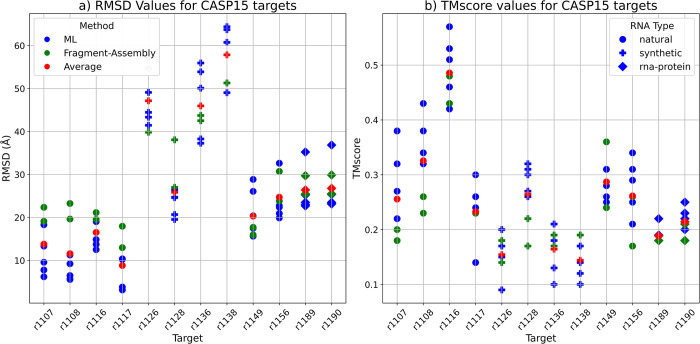
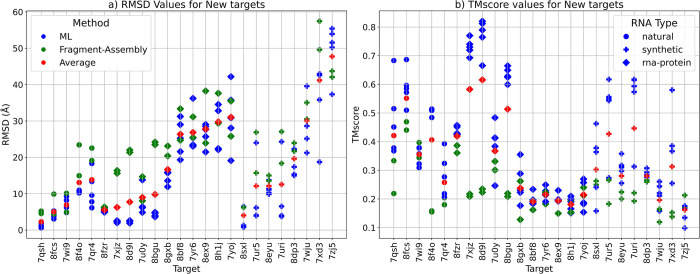
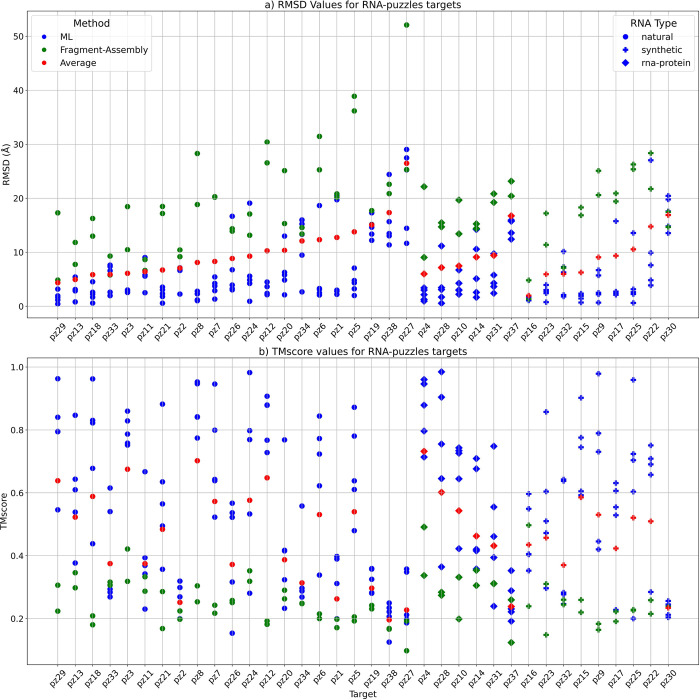
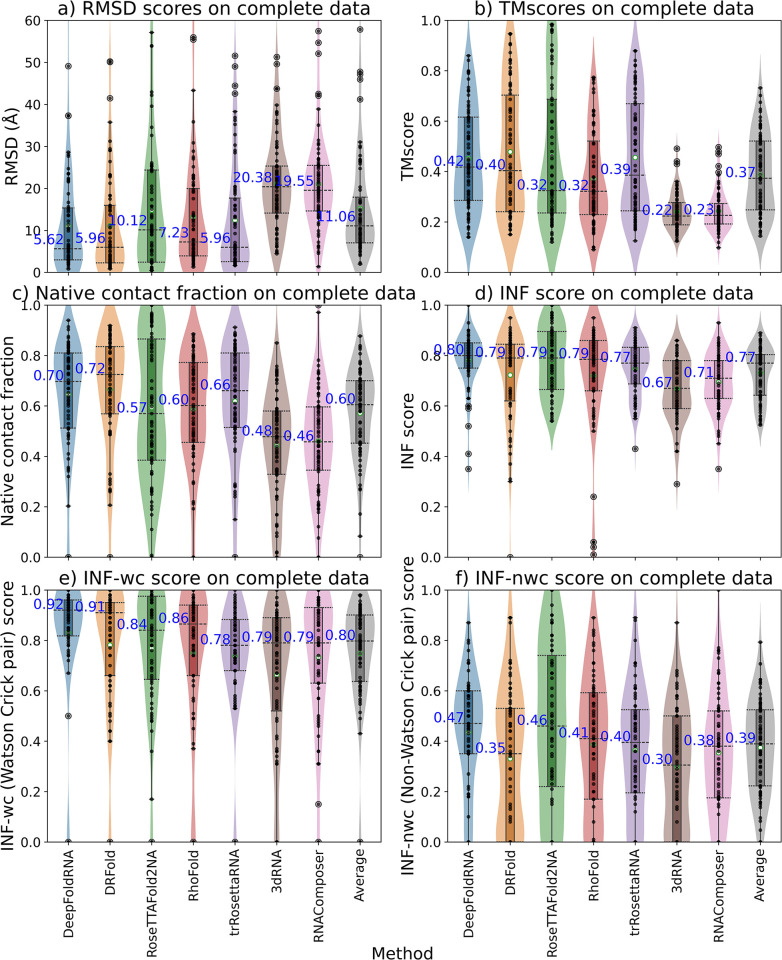
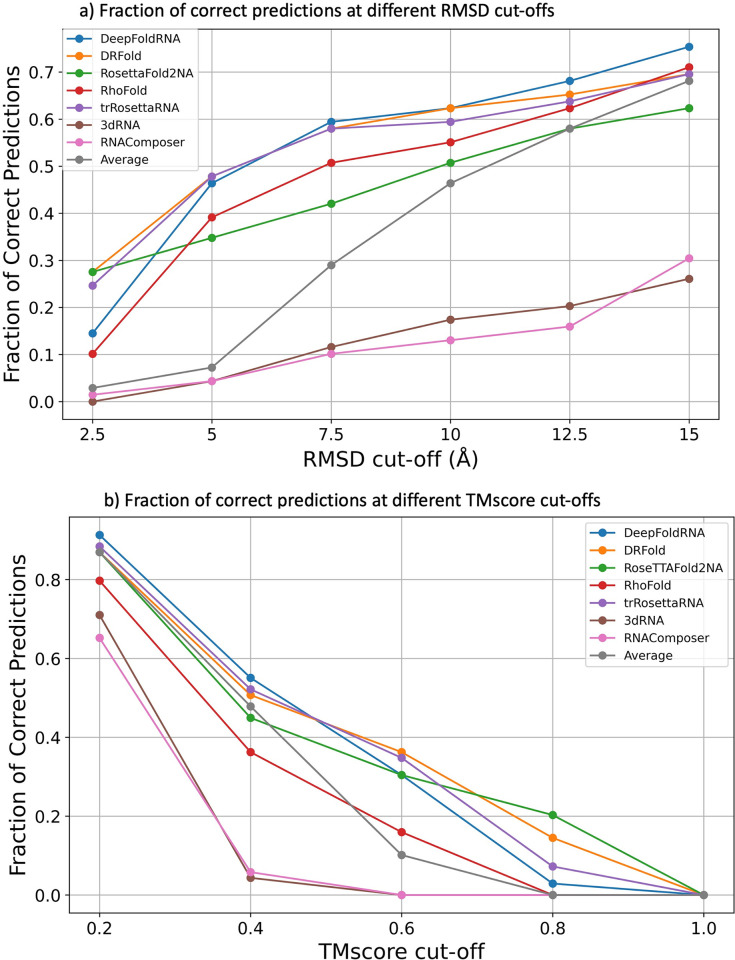
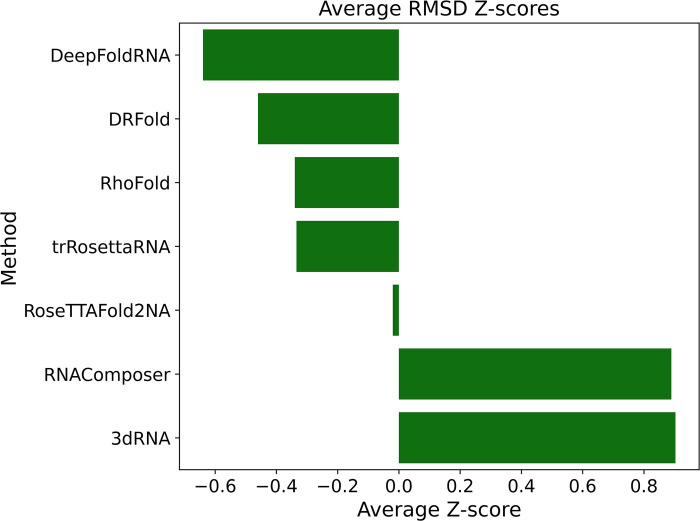
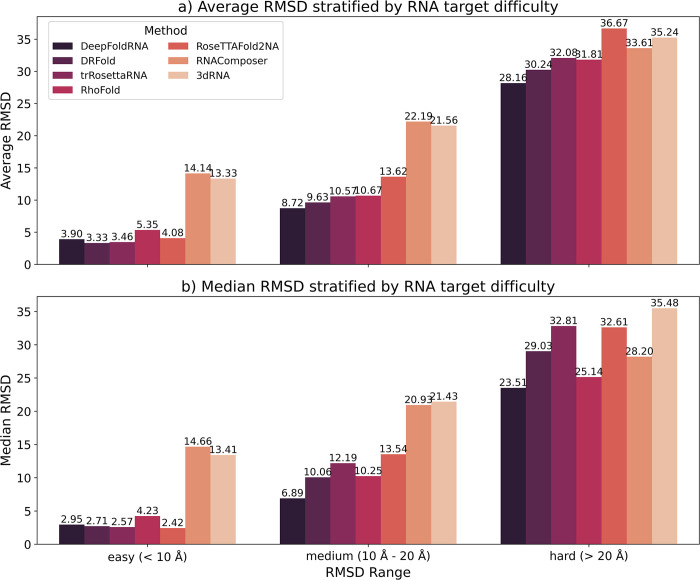
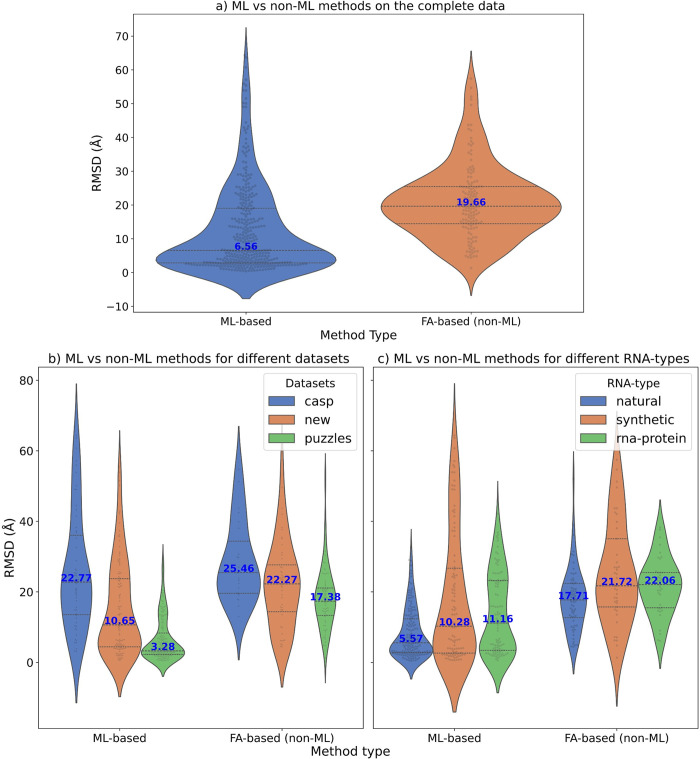
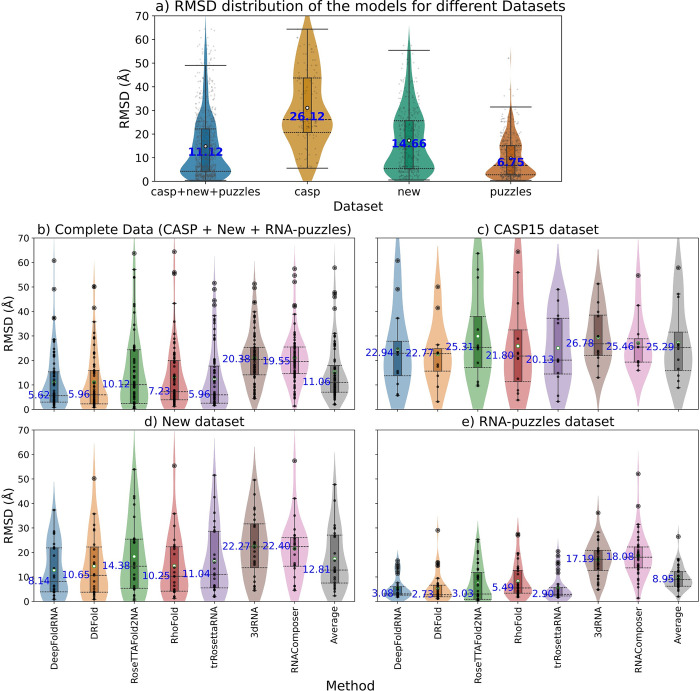
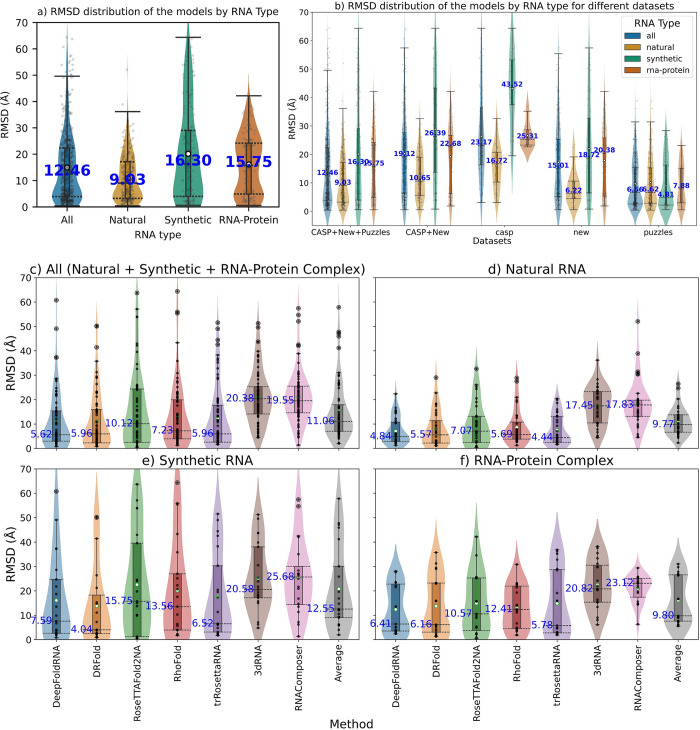
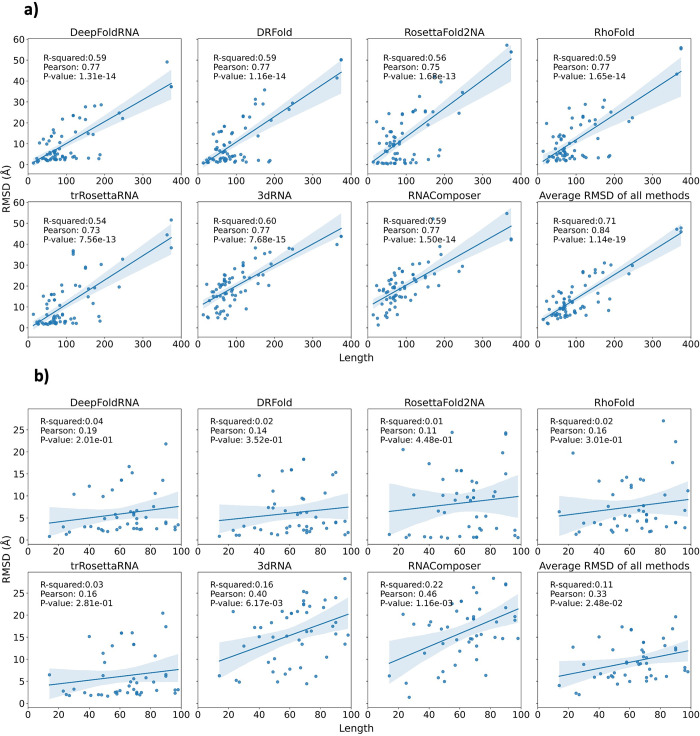
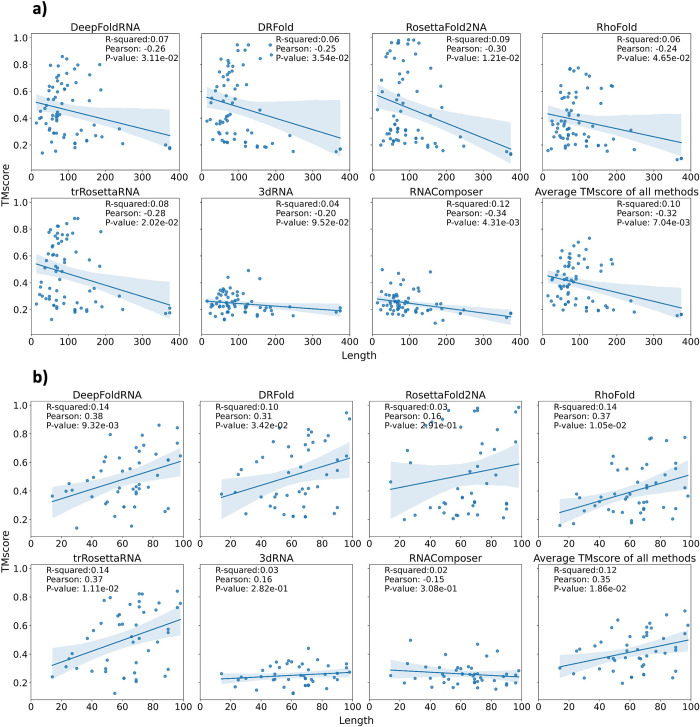
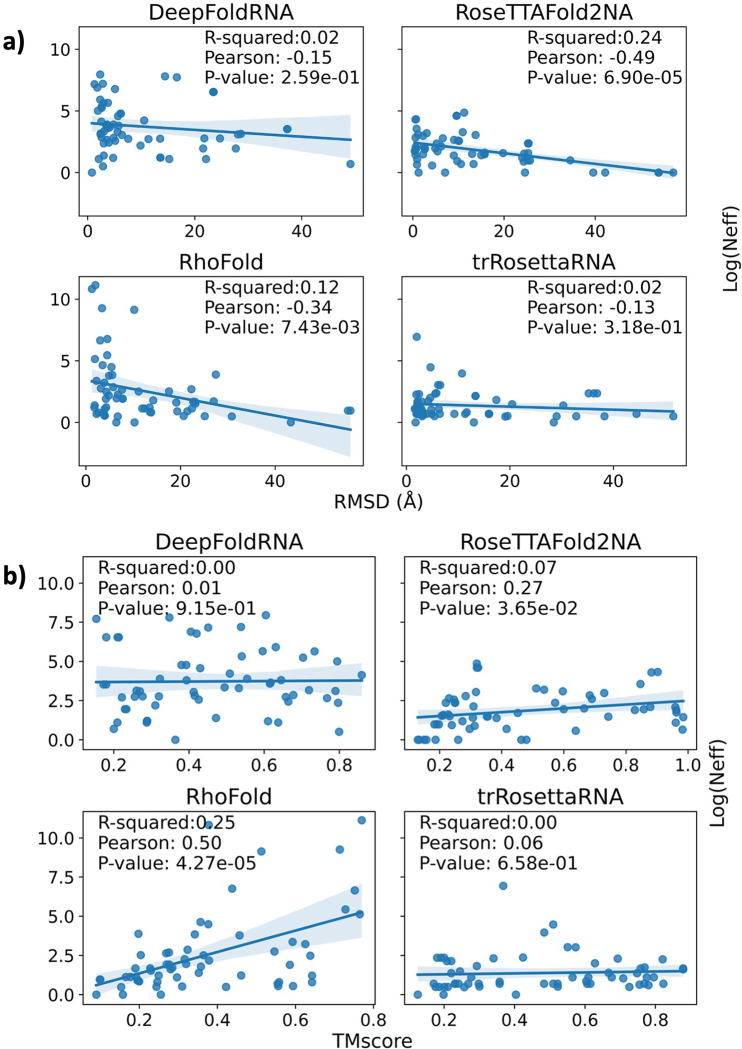
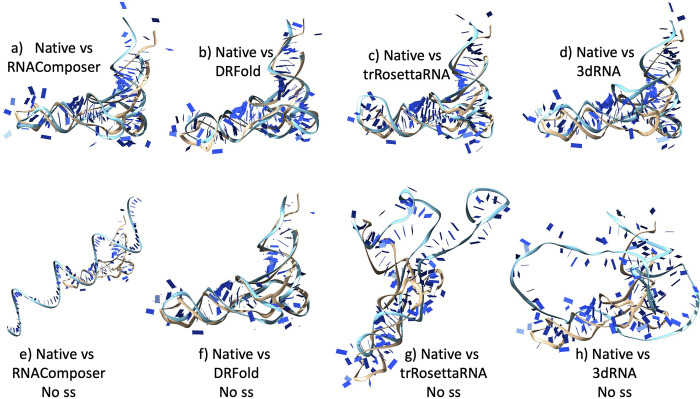
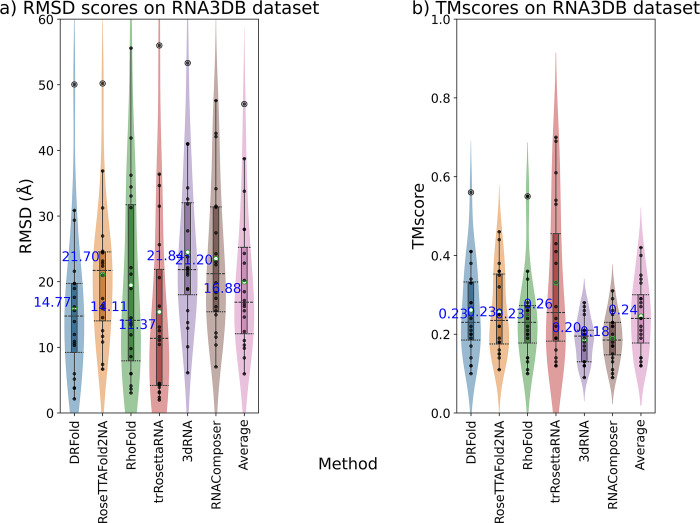
The 3D structure of RNA critically influences its functionality, and understanding this structure is vital for deciphering RNA biology. Experimental methods for determining RNA structures are labour-intensive, expensive, and time-consuming. Computational approaches have emerged as valuable tools, leveraging physics-based-principles and machine learning to predict RNA structures rapidly. Despite advancements, the accuracy of computational methods remains modest, especially when compared to protein structure prediction. Deep learning methods, while successful in protein structure prediction, have shown some promise for RNA structure prediction as well, but face unique challenges. This study systematically benchmarks state-of-the-art deep learning methods for RNA structure prediction across diverse datasets. Our aim is to identify factors influencing performance variation, such as RNA family diversity, sequence length, RNA type, multiple sequence alignment (MSA) quality, and deep learning model architecture. We show that generally ML-based methods perform much better than non-ML methods on most RNA targets, although the performance difference isn't substantial when working with unseen novel or synthetic RNAs. The quality of the MSA and secondary structure prediction both play an important role and most methods aren't able to predict non-Watson-Crick pairs in the RNAs. Overall among the automated 3D RNA structure prediction methods, DeepFoldRNA has the best prediction results followed by DRFold as the second best method. Finally, we also suggest possible mitigations to improve the quality of the prediction for future method development.


Conflict of interest statement

The authors have declared no competing interests exist.

Figures

Fig 1
Fig 1. RMSD and TMscore comparison for the RNA targets in the CASP15 dataset.
Models predicted by Machine-Learning-based (ML-based) methods are coloured in blue, the ones predicted by Fragment-Assembly-based (FA-based) methods are in green and the average RMSD of all models for each target is in red. The shape of the points is based on the RNA type with circle denoting a natural RNA, + denoting a synthetic RNA and a square denoting an RNA-protein complex a) Plot showing the RMSD values in Å for the twelve targets in the CASP15 dataset. For natural RNAs (r1107 and r1108), the ML-based methods (in blue) have much lower RMSD than the average (in red) and the FA-based methods (in green). The best model for each target is the one usually predicted by a ML-method (except for R1126 which is a synthetic target with a length of 363 nucleotides). The average RMSD for most synthetic targets is higher than the natural and RNA-protein complex targets. b) Plot showing the TMscores for the predicted models for each target. TMscore for natural targets (r1107 and r1108) is much higher compared to the synthetic and RNA-protein targets. For the natural targets, ML-predicted models have higher TMscore than the average and the FA-predicted models. Model with the best TMscore for each target is one predicted by a ML-based method (except for r1138 which is a very long synthetic RNA of 720 nucleotides).
Fig 2
Fig 2. Native and predicted models for CASP target R1107.
All the structures were aligned together against the native(b) and then tiled separately to visualize. a) Superimposition of native structure (in beige colour) to the best model (DeepFoldRNA, cyan colour); RMSD = 6.19 Å b) Native structure c) DeepFoldRNA model d) RhoFold model; RMSD = 7.79 Å e) RosettaFold2NA model; RMSD = 9.58 Å f) trRosettaRNA model; RMSD = 13.35 Å g) DRFold model; RMSD = 18.30 Å h) RNAComposer model; RMSD = 19.12 Å i) 3DRNA model; RMSD = 22.54 Å.
Fig 3
Fig 3. Native and predicted models for CASP target R1136.
All the structures were aligned together against the native(a) and then tiled separately to visualize. a) Native structure b) DeepFoldRNA model; RMSD = 37.26 Å c) RhoFold model; RMSD = 55.94 Å d) RosettaFold2NA model; RMSD = 53.88 Å e) trRosettaRNA model; RMSD = 38.27 Å f) DRFold model; RMSD = 50.08 Å g) RNAComposer model; RMSD = 42.49 Å h) 3dRNA model; RMSD = 43.72 Å
Fig 4
Fig 4. RMSD and TMscore comparison for the RNA targets in the New dataset.
Models predicted by Machine-Learning-based (ML-based) methods are coloured in blue, the ones predicted by Fragment-Assembly-based (FA-based) methods are in green and the average RMSD of all models for each target is in red. The shape of the points is based on the RNA type with circle denoting a natural RNA, + denoting a synthetic RNA and a square denoting an RNA-protein complex a) Plot showing the RMSD values in Å for the targets in the New dataset. For most targets, the ML-based methods (in blue) have much lower RMSD than the average (in red) and the FA-based methods (in green). The average RMSD for most synthetic targets is higher than the natural and RNA-protein complex targets. b) Plot showing the TMscores for the predicted models for each target. TMscore for almost all targets for ML-methods (in blue) is higher compared to the Average(in red) and FA-based methods (in green). Model with the best TMscore for each target is one predicted by a ML-based method. The average TMscore for most synthetic targets is higher than the natural and RNA-protein complex targets.
Fig 5
Fig 5. RMSD and TMscore comparison for the RNA targets in the RNA-puzzles dataset.
Models predicted by Machine-Learning-based (ML-based) methods are coloured in blue, the ones predicted by Fragment-Assembly-based (FA-based) methods are in green and the average RMSD of all models for each target is in red. The shape of the points is based on the RNA type with circle denoting a natural RNA, + denoting a synthetic RNA and a square denoting an RNA-protein complex. On average, the performance of most methods on this dataset is much better than on CASP15 or the New dataset, possibly because many targets might have been part of the training set of the ML-methods and also many homologous structures for these targets are available in the PDB. The ML-based methods have the best quality models (low RMSD and High TMscore) and the FA-based methods have the lowest quality models for most targets in this dataset a) Plot showing the RMSD values in Å for the targets in the CASP dataset. For most targets, the ML-based methods (in blue) have much lower RMSD than the average (in red) and the FA-based methods (in green). b) Plot showing the TMscores for the predicted models for each target. TMscore for almost all targets for ML-methods (in blue) is higher compared to the Average(in red) and FA-based methods (in green). Model with the best TMscore for each target is always the one predicted by a ML-based method.
Fig 6
Fig 6. Box and violin plots showing the comparison of all the methods on the combined dataset across multiple metrics.
The methods are on the X-axis and the metrics are on the Y-axis. The Average plot (in grey) is the average of the models predicted by all the methods for a particular target. The median values are labelled with blue text and the whiskers denote the interquartile range a) RMSD distribution of the predicted models by various methods. DeepFoldRNA has the lowest median RMSD (5.62 Å). b) TMscore distribution for the various methods. DeepFoldRNA and DRFold have the highest median TMscore c) Native contact fraction (ncf) of the predicted models by the various methods. DRFold has the highest ncf of 0.72. d) INF score for the various methods. DeepFoldRNA has the highest median INF score (0.80) e) INF-wc score (Watson-Crick pairs) for the various methods. DeepFoldRNA has the highest median score of 0.92. Most methods have a really good INF-wc score (> = 0.8 for most methods) indicating that the canonical Watson-Crick pairs are predicted quite accurately by most methods. Interestingly, for the first time for a metric, a ML-based method i.e. trRosettaRNA has a median score lower than the medians of the Average prediction or FA-based methods (3DRNA, RNAcomposer). This could be because the secondary structure prediction method used by trRosettaRNA might not be as accurate as others. f) INF-nwc score (non-Watson-Crick pairs) for the various methods. DeepFoldRNA has the highest median RMSD of 0.47. None of the methods even have a median score higher than 0.5 indicating that none of the methods are very good at predicting non-canonical base pairing. Interestingly, again this time a ML-based method (DRFold) has a lower median score than the Average as well as median score of RNAComposer (an FA-based method). Usually, DRFold has been the second-best method and close to DeepFoldRNA on most metrics, so this discrepancy might be explained because of its non-reliance on MSA as input to predict the structure, as all other ML-based methods use MSA and they are able to predict non-Watson-Crick pairs more accurately.
Fig 7
Fig 7. Plots showing the performance of various RNA structure prediction methods at different RMSD and TMscore cut-offs.
a) At a RMSD cut-off of 5 Å, DeepFoldRNA, DRFold and trRosettaRNA are able to predict 50% of the targets correctly, which increases to 70–75% on increasing the cut-off to 15 Å. However, RNAComposer and 3DRNA are only able to predict 5% of the targets correctly at 5 Å cut-off and even after increasing the RMSD cut-off for correct predictions to 15 Å, they are only able to predict around 30% of the targets correctly. b) At a TMscore cut-off of 0.4 most ML-based methods are able to predict ~50% targets correctly, while FA-based methods are only able to predict <5% targets correctly. On applying a more stringent cut-off of 0.6 the % of correct predictions for the ML-methods drops below 40% while FA-methods aren’t even able to predict a single model with a TMscore higher than 0.6.
Fig 8
Fig 8. Plot showing the average Z-score of the RMSDs of the predicted structure.
A Z-score < 0 indicates that the prediction is better than the average and Z-score > 0 indicates that the prediction is worse than the average. All the machine-learning-based methods have a Z-score < 0 the two fragment-assembly-based methods have a Z-score > 0. DeepFoldRNA has the lowest Z-score, which indicates that it’s predicted models have the lowest RMSD compared to the average prediction.
Fig 9
Fig 9. Barplots showing the Mean and Median RMSD of the predicted models by each method depending on the target RNA difficulty.
The RNA target difficulty is shown on the X-axis and the Average/Median RMSD is shown on the y-axis. The RNA targets were stratified based on the average of RMSD of all predicted models: easy (average RMSD < 10 Å), medium (average RMSD between 10 Å and 20 Å), and hard (average RMSD > 20 Å). a) Mean RMSD for all the methods stratified by RNA target difficulty. b) Median RMSD for all the methods stratified by RNA target difficulty.
Fig 10
Fig 10. Scatterplot showing the performance comparison of each method against every other method on all the targets.
If a point lies on the red-coloured x = y line, it indicates that the RMSD of the predicted model from both the methods is exactly the same i.e. they have similar prediction performance for that target. Points above that line indicate a higher RMSD for the model predicted by the method on the y-axis (i.e. method on the x-axis is better) and points below that line indicate vice-versa. Most of the ML-based methods have a better performance than the average prediction (last row of plots), while the FA-based methods are much worse than the average prediction (Average vs 3dRNA and Average vs RNAComposer plots in the last row). When compared against all other methods using the RMSDs of the predicted models, DeepFoldRNA is the best method followed by DRFold.
Fig 11
Fig 11. Heatmap showing the correlation between different methods.
All the machine-learning-based methods are very similar to each other with DeepFoldRNA and being DRFold having the highest correlation. The fragment-assembly-based methods (3dRNA and RNAComposer) have comparatively lower correlation with ML-based methods and their highest correlation is with each other.
Fig 12
Fig 12. Heatmap showing the correlation of scoring metrics with each other for all the datasets.
RMSD has a negative correlation with the remaining metrics as expected (lower the RMSD, better the model). The correlation of the other metrics varies a lot depending on the method with RosettaFold2NA-predicted models having the highest correlation between the scoring metrics. Variation in the similarity of the metrics indicate that different metrics judge different aspects of the model quality, underscoring the importance of using multiple metrics to benchmark the methods.
Fig 13
Fig 13. Comparison of ML-based methods to non-ML-based methods.
The median values for each violin plot are labelled in blue. The RMSD (in Å) is shown on the y-axis while the x-axis shows the method type (ml or non-ml). a) Violin plots showing the distribution of the RMSDs of the predicted models for a comparison between ml (DeepFoldRNA, DRFold, trRosettaRNA, RosettaFold2NA, RhoFold) and non-ml (3dRNA, RNAComposer) methods. The median RMSD of ml methods (6.57 Å) is much lower than non-ml methods (19.66 Å). b) Violin plots showing the comparison of ML vs FA-based methods based on different datasets. ML-based methods are clearly better with much lower median RMSD than FA-based methods on the New (10.65 Å vs 22.27 Å) and RNA-puzzles dataset (3.28 Å vs 17.38 Å). ML-based methods are also better than FA-based ones on the CASP15 dataset albeit the difference in median RMSD is not as pronounced (22.77 Å vs 25.46 Å). c) Violin plots showing the comparison of ML vs FA-based methods based on different RNA types. ML-based methods are better with much lower median RMSDs for all RNA types. 5.57 Å vs 17.71 Å for natural, 10.28 Å vs 21.72 Å for synthetic and 11.16 Å vs 22.06 Å for RNA-protein complex targets.
Fig 14
Fig 14. Box and violin plots showing the comparison of the methods based on different datasets.
The median values are labelled with blue text and the whiskers denote the interquartile range a) The datasets are on the X-axis and the RMSD is on the Y-axis. We pooled all the models from different methods datasets together and only compared the RMSD of the models based on their datasets. The median RMSD for the CASP dataset was the highest (26.12 Å), New dataset was in the middle (14.66 Å) and RNA-puzzles had the lowest median RMSD (6.75 Å). b) This plot shows the same comparison, but we look at each method separately. The Average plot (in grey) is the average of the models predicted by all the methods for a particular target. Generally, CASP15 dataset has the highest median RMSD for all methods, New dataset was in the middle and RNA-puzzles dataset has the lowest median RMSD for all the methods. The reason for RNA-puzzles being the easiest is because 35/36 targets are X-ray crystallographic structures and many of the targets were published before 2020, thus they might be included in the training sets of the ML-based methods. CASP dataset is the hardest because most of the targets are synthetic and Cryo-EM structures. The new dataset provides the most realistic performance estimates as it is a well-balanced dataset (comprising all kind of RNAs with representation from both X-ray crystallographic and Cryo-EM structures) and none of its targets are present in the training sets of the ML methods. DRFold has a median RMSD of 2.73 on RNA-puzzles dataset possibly because it has already seen most of the targets in the RNA-puzzles dataset while training thus giving an overinflated performance.
Fig 15
Fig 15. Comparing the prediction performance based on RNA type.
a) Violin plots showing the RMSDs of the models based on the RNA type. Natural targets have the lowest median RMSD (9.03 Å), RNA-protein have the second best (15.75 Å) and synthetic have the highest (16.30 Å). b) Performance difference for different RNA types based on different datasets. For CASP15 dataset, natural have the lowest, RNA-protein have the middle and the synthetic targets have the highest median RMSD. For the new dataset, natural have the lowest (6.22 Å), while RNA-protein and synthetic have similar median RMSDs with synthetic being slightly lower than RNA-protein (18.72 Å for synthetic and 20.38 for RNA-protein). Interestingly for the RNA-puzzles dataset the lowest median RMSD is for the synthetic targets (4.81 Å), while natural RNAs have slightly higher (6.62 Å) and the RNA-protein ones have the highest (7.88 Å). This discrepancy for this dataset is because many of the targets in this dataset are published pre-2020 so they might be present in the training sets of ML-methods thus resulting in an inflated performance (the difficulty of being a synthetic target doesn’t matter because ML-model has already learnt the structure). c) Performance comparison of all the methods separately for different RNA types. For all methods (except DRFold) the natural targets are the easiest to predict, with RNA-protein being more difficult and synthetic being the hardest based on the median RMSD scores.
Fig 16
Fig 16. Correlation between the length of the target RNA and the RMSD.
a) The correlation between the length of the target RNA and the RMSD of the predicted model for all the methods. In this plot RNAs of any length are considered. We observe a positive correlation between the length and the RMSD of the models for all the methods suggesting that longer the RNA, higher the RMSD of the predicted model and hence lower the quality of the predicted model. This shows that predicting the 3D structure of longer RNAs tends to be more challenging than that of shorter RNAs. b) The correlation between the length of the target RNAs and the RMSD of the predicted model for all the methods. In this plot, only RNAs with length < 100 are considered. We observe that the clear positive correlation that we observed in (a) for all models is only present for FA-based methods (3dRNA and RNAComposer) and is also much weaker than the first case. The correlation for ML-based methods is not there anymore. This suggests that on increasing length of the target RNA (up to 100 nucleotides) there isn’t much effect on the quality of the predicted model.
Fig 17
Fig 17. Correlation between the length of the target RNA and the TMScore.
a) The correlation between the length of the target RNA and the TMscore of the predicted model for all the methods. In this plot RNAs of any length are considered. We observe a negative correlation between the length and the TMscore of the models for all the methods suggesting that longer the RNA, lower the TMscore of the predicted model and hence lower the quality of the predicted model. This could possibly be because most ML-methods are trained on RNAs shorter than 200 nucleotides. b) The correlation between the length of the target RNAs and the TMscore of the predicted model for all the methods, in which only RNAs with length < 100 are considered. Contrary to what we expected, the weak negative correlation that we observed in (a) for all models is now a weak positive correlation for most methods. This suggests that on increasing the length of the target RNA (up to 100 nucleotides) the TMscore of the predicted model and hence the quality of the model also increases, which is unexpected, but has been previously reported by the RhoFold paper as well.
Fig 18
Fig 18. Correlation between RMSD/TMscore and the MSA depth.
Scatter plots showing the correlation between RMSD/TMscore and the MSA depth (Log(Neff)) for the four ML-based methods (DeepFoldRNA, RosettaFold2NA, trRosettaRNA, RhoFold) that take MSA as input. DRfold was excluded as it doesn’t take MSA as input. As the methods used by the tools to create the MSA differ, we created separate scatter plots for each of the methods. DeepFoldRNA uses rMSA, RoseTTAFold2NA uses rMSA-lite, trRosettaRNA uses a mix of rMSA and Infernal, while RhoFold only relies on blastN to create the MSA. a) A negative correlation is observed for RoseTTAFold2NA and RhoFold which indicates that models of the targets with higher MSA depth have better quality (lower RMSDs). b) Scatter plots for the four methods between TMscore and the MSA depth (Log(Neff)). A positive correlation is observed for RoseTTAFold2NA and RhoFold which indicates that models of the targets with higher MSA depth have higher TMscore.
Fig 19
Fig 19. Effect of ss on 8FZR model predictions.
Superimposition of the native structure and predicted models of the target 8FZR showing the comparison between the quality of the predicted models by various tools when secondary structure (ss) is provided as input (predicted by the respective prediction method of each tool; SPOT-RNA for trRosettaRNA, RNAfold for RNAComposer and 3dRNA, and PETfold + RNAfold for DRFold) and when no secondary structure input is given. The native structure is shown in the light grey colour and the predicted models are in cyan. The first row of structures i.e. Fig 19a, 19b, 19c, and 19d show the superimposition from the case when secondary structure is provided as input and the bottom row i.e. Fig 19e, 19f, 19g, and h show the superimposition from the scenario when no secondary structure is provided as input. When ss is not provided as input, we can clearly see (in Fig 19e, 19f, 19g, 19h) that the quality of the predicted models by all the methods (except DRFold) is far worse than the models from the first row (in Fig 19a, 19b, 19c, 19d). This indicates that although replacing the predicted ss by extracted ss from native PDBs as input to these tools didn’t improve the quality of the final predicted model substantially, removing the ss as input altogether severely affects the quality of the final predicted model. Therefore, ss still plays a very important role in the accurate determination of the 3D RNA structure. The only method that wasn’t greatly affected by exclusion of ss as input was DRFold (possibly because it’s able to predict the nucleotide pairing and the associated restraints somewhat accurately even in the absence of ss because of how it’s trained the geometrical potentials it uses to fold the RNA; recall that it doesn’t take an MSA as input). The RMSD between the native and modelled structures are as follows: a) 5.70 Å for RNAComposer model b) 4.42 Å for DRFold model c) 5.78 Å for trRosettaRNA model d) 5.52 Å for 3dRNA model e) 59.46 Å for RNAComposer model without ss as input f) 4.63 Å for DRFold without ss as input g) 25.73 Å for trRosettaRNA model without ss as input h) 24.35 Å for 3dRNA model without ss as input.
Fig 20
Fig 20. Box and violin plots showing the benchmarking results on the RNA3DB dataset.
The methods are on the X-axis and the metrics are on the Y-axis. The Average plot (in violet) is the average of the models predicted by all the methods for a particular target. The median values are labelled with blue text and the whiskers denote the interquartile range a) RMSD distribution of the predicted models by various methods. trRosettaRNA has the lowest median RMSD (11.37 Å). b) TMscore distribution for the various methods. trRosettaRNA the highest median TMscore of 0.26.

Similar articles

References

    1. Minchin S, Lodge J. Understanding biochemistry: structure and function of nucleic acids. Essays Biochem. 2019. Oct;63(4):433–56. doi: 10.1042/EBC20180038 - DOI - PMC - PubMed
    1. Assmann SM, Chou HL, Bevilacqua PC. Rock, scissors, paper: How RNA structure informs function. Plant Cell. 2023. Jun 1;35(6):1671–707. doi: 10.1093/plcell/koad026 - DOI - PMC - PubMed
    1. Alberts B, Johnson A, Lewis J, Morgan D, Raff MC, Roberts K, et al.. Molecular biology of the cell. Sixth edition. New York, NY: Garland Science, Taylor and Francis Group; 2015. 1 p.
    1. Ganser LR, Kelly ML, Herschlag D, Al-Hashimi HM. The roles of structural dynamics in the cellular functions of RNAs. Nat Rev Mol Cell Biol. 2019. Aug;20(8):474–89. doi: 10.1038/s41580-019-0136-0 - DOI - PMC - PubMed
    1. Alonso D, Mondragón A. Mechanisms of catalytic RNA molecules. Biochem Soc Trans. 2021. Aug 27;49(4):1529–35. doi: 10.1042/BST20200465 - DOI - PMC - PubMed

LinkOut - more resources