

Screening of serum biomarkers in patients with PCOS through lipid omics and ensemble machine learning
- PMID: 39775242
- PMCID: PMC11706364
- DOI: 10.1371/journal.pone.0313494
Screening of serum biomarkers in patients with PCOS through lipid omics and ensemble machine learning
Abstract
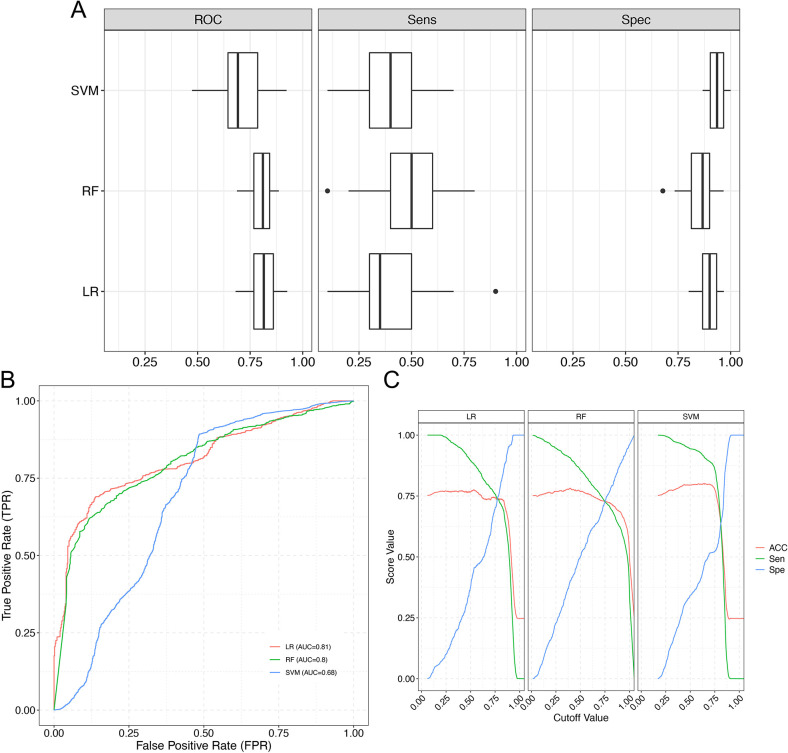
Polycystic ovary syndrome (PCOS) is a primary endocrine disorder affecting premenopausal women involving metabolic dysregulation. We aimed to screen serum biomarkers in PCOS patients using untargeted lipidomics and ensemble machine learning. Serum from PCOS patients and non-PCOS subjects were collected for untargeted lipidomics analysis. Through analyzing the classification of differential lipid metabolites and the association between differential lipid metabolites and clinical indexes, ensemble machine learning, data preprocessing, statistical test pre-screening, ensemble learning method secondary screening, biomarkers verification and evaluation, and diagnostic panel model construction and verification were performed on the data of untargeted lipidomics. Results indicated that different lipid metabolites not only differ between groups but also have close effects on different corresponding clinical indexes. PI (18:0/20:3)-H and PE (18:1p/22:6)-H were identified as candidate biomarkers. Three machine learning models, logistic regression, random forest, and support vector machine, showed that screened biomarkers had better classification ability and effect. In addition, the correlation of candidate biomarkers was low, indicating that the overlap between the selected biomarkers was low, and the combination of panels was more optimized. When the AUC value of the test set of the constructed diagnostic panel model was 0.815, the model's accuracy in the test set was 0.74, specificity was 0.88, and sensitivity was 0.7. This study demonstrated the applicability and robustness of machine learning algorithms to analyze lipid metabolism data for efficient and reliable biomarker screening. PI (18:0/20:3)-H and PE (18:1p/22:6)-H showed great potential in diagnosing PCOS.
Copyright: © 2025 Chen et al. This is an open access article distributed under the terms of the Creative Commons Attribution License, which permits unrestricted use, distribution, and reproduction in any medium, provided the original author and source are credited.
Conflict of interest statement
The authors declare no conflicts of interest.
Figures


Similar articles
-
Lipidomics analysis of human follicular fluid form normal-weight patients with polycystic ovary syndrome: a pilot study.J Ovarian Res. 2021 Oct 13;14(1):135. doi: 10.1186/s13048-021-00885-y. J Ovarian Res. 2021. PMID: 34645507 Free PMC article.
-
Biochemical classification diagnosis of polycystic ovary syndrome based on serum steroid hormones.J Steroid Biochem Mol Biol. 2025 Jan;245:106626. doi: 10.1016/j.jsbmb.2024.106626. Epub 2024 Oct 23. J Steroid Biochem Mol Biol. 2025. PMID: 39448042
-
Ceramide subclasses identified as novel lipid biomarker elevated in women with polycystic ovary syndrome: a pilot study employing shotgun lipidomics.Gynecol Endocrinol. 2020 Jun;36(6):508-512. doi: 10.1080/09513590.2019.1698026. Epub 2019 Dec 3. Gynecol Endocrinol. 2020. PMID: 31793360
-
Anti-müllerian hormone as a diagnostic biomarker for polycystic ovary syndrome and polycystic ovarian morphology: a systematic review and meta-analysis.Fertil Steril. 2024 Oct;122(4):727-739. doi: 10.1016/j.fertnstert.2024.05.163. Epub 2024 Jun 27. Fertil Steril. 2024. PMID: 38944177
-
Unveiling the Role of Artificial Intelligence (AI) in Polycystic Ovary Syndrome (PCOS) Diagnosis: A Comprehensive Review.Reprod Sci. 2024 Oct;31(10):2901-2915. doi: 10.1007/s43032-024-01615-7. Epub 2024 Jun 21. Reprod Sci. 2024. PMID: 38907128 Review.
Cited by
-
Artificial intelligence in polycystic ovarian syndrome management: past, present, and future.Radiol Med. 2025 Jun 23. doi: 10.1007/s11547-025-02032-9. Online ahead of print. Radiol Med. 2025. PMID: 40549330 Review.
-
Diagnosis and Treatment of Adolescent Polycystic Ovary syndrome:A Review.Int J Womens Health. 2025 Feb 19;17:459-474. doi: 10.2147/IJWH.S506498. eCollection 2025. Int J Womens Health. 2025. PMID: 39995885 Free PMC article. Review.
-
Bibliometric analysis of the research on anti-Müllerian hormone and polycystic ovary syndrome: current status, hotspots, and trends.Front Reprod Health. 2025 Apr 24;7:1519249. doi: 10.3389/frph.2025.1519249. eCollection 2025. Front Reprod Health. 2025. PMID: 40342310 Free PMC article.
References
-
- Ma N, Zhou J, Lu W. The Normal Body Mass Index (BMI) of Women with Polycystic Ovary Syndrome (PCOS) was Associated with IVF/ICSI Assisted Conception Outcomes. Clinical and Experimental Obstetrics & Gynecology. 2023;50(11). doi: 10.31083/j.ceog5011228 - DOI
-
- Wright PJ, Corbett CF, Dawson RM, Wirth MD, Pinto BM. Fitness Assessments of Women with Polycystic Ovary Syndrome: A Prospective Process Feasibility Study. Clinical and Experimental Obstetrics & Gynecology. 2023;50(4). doi: 10.31083/j.ceog5004088 - DOI
MeSH terms
Substances
LinkOut - more resources
Full Text Sources
Medical
Research Materials
Miscellaneous
