

Generation of deep learning based virtual non-contrast CT using dual-layer dual-energy CT and its application to planning CT for radiotherapy
- PMID: 39775325
- PMCID: PMC11684624
- DOI: 10.1371/journal.pone.0316099
Generation of deep learning based virtual non-contrast CT using dual-layer dual-energy CT and its application to planning CT for radiotherapy
Abstract
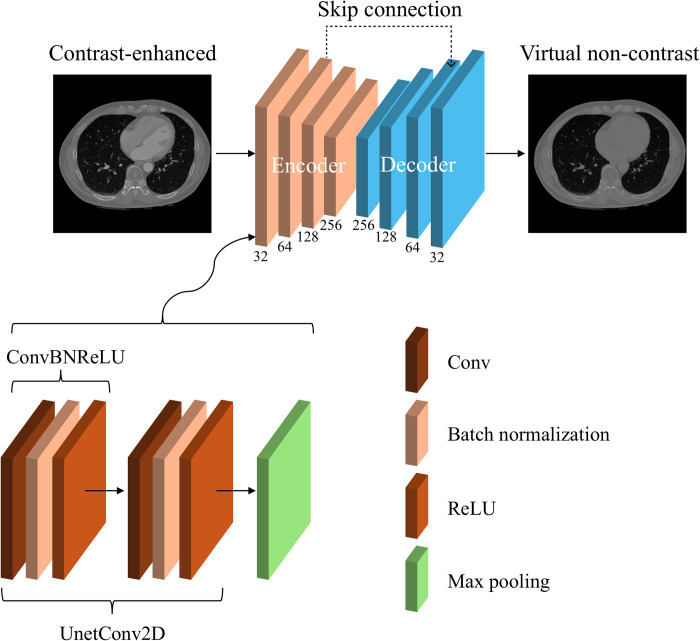
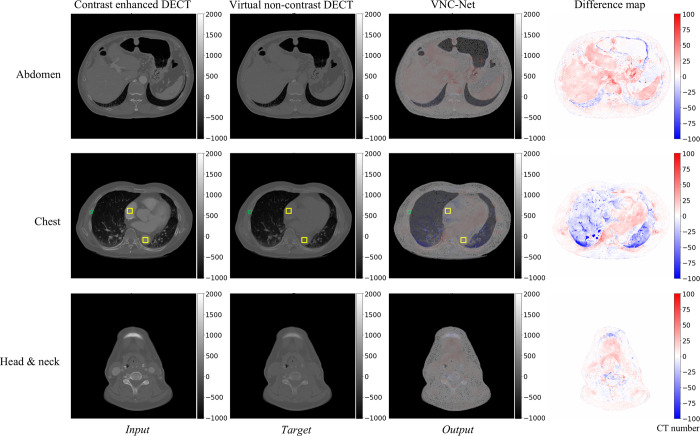
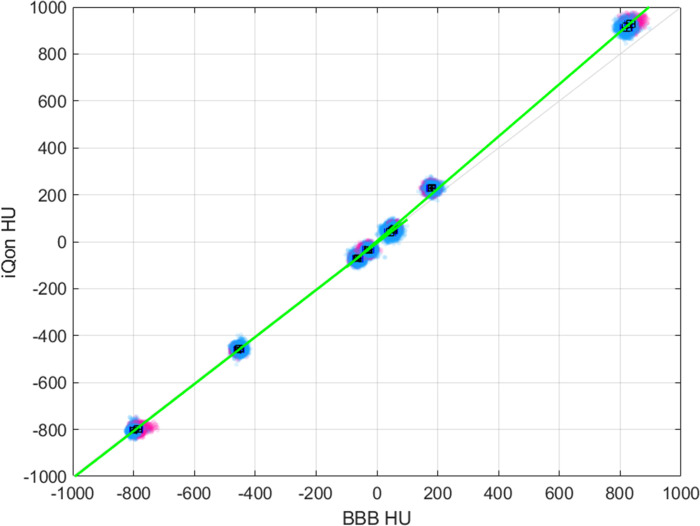
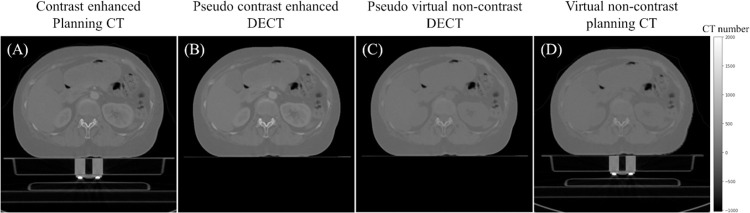
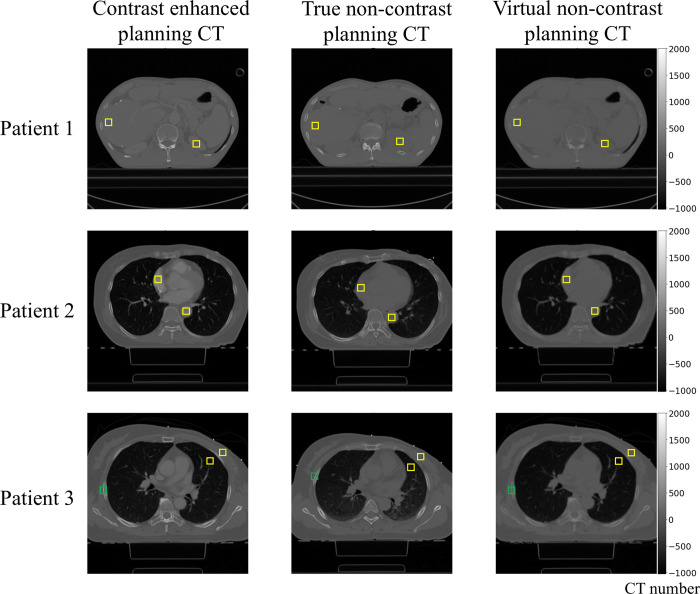
This paper presents a novel approach for generating virtual non-contrast planning computed tomography (VNC-pCT) images from contrast-enhanced planning CT (CE-pCT) scans using a deep learning model. Unlike previous studies, which often lacked sufficient data pairs of contrast-enhanced and non-contrast CT images, we trained our model on dual-energy CT (DECT) images, using virtual non-contrast CT (VNC CT) images as outputs instead of true non-contrast CT images. We used a deterministic method to convert CE-pCT images into pseudo DECT images for model application. Model training and evaluation were conducted on 45 patients. The performance of our model, 'VNC-Net', was evaluated using various metrics, demonstrating high scores for quantitative performance. Moreover, our model accurately replicated target VNC CT images, showing close correspondence in CT numbers. The versatility of our model was further demonstrated by applying it to pseudo VNC DECT generation, followed by conversion to VNC-pCT. CE-pCT images of ten liver cancer patients and ten left-sided breast cancer patients were used. A quantitative comparison with true non-contrast planning CT (TNC-pCT) images validated the accuracy of the generated VNC-pCT images. Furthermore, dose calculations on CE-pCT and VNC-pCT images from patients undergoing volumetric modulated arc therapy for liver and breast cancer treatment showed the clinical relevance of our approach. Despite the model's overall good performance, limitations remained, particularly in maintaining CT numbers of bone and soft tissue less influenced by contrast agent. Future research should address these challenges to further improve the model's accuracy and applicability in radiotherapy planning. Overall, our study highlights the potential of deep learning models to improve imaging protocols and accuracy in radiotherapy planning.
Copyright: © 2024 Kim et al. This is an open access article distributed under the terms of the Creative Commons Attribution License, which permits unrestricted use, distribution, and reproduction in any medium, provided the original author and source are credited.
Conflict of interest statement
The authors have declared that no competing interests exist.
Figures


Similar articles
-
Deep learning-based virtual noncontrast CT for volumetric modulated arc therapy planning: Comparison with a dual-energy CT-based approach.Med Phys. 2020 Feb;47(2):371-379. doi: 10.1002/mp.13925. Epub 2019 Dec 3. Med Phys. 2020. PMID: 31733105
-
A simple algorithm to derive virtual non-contrast electron density from dual-energy computed tomography data for radiotherapy treatment planning.Med Phys. 2025 May;52(5):3107-3116. doi: 10.1002/mp.17648. Epub 2025 Jan 25. Med Phys. 2025. PMID: 39865311 Free PMC article.
-
Quantitative attenuation accuracy of virtual non-enhanced imaging compared to that of true non-enhanced imaging on dual-source dual-energy CT.Abdom Radiol (NY). 2020 Apr;45(4):1100-1109. doi: 10.1007/s00261-020-02415-8. Abdom Radiol (NY). 2020. PMID: 32052130
-
Dual virtual non-contrast imaging: a Bayesian quantitative approach to determine radiotherapy quantities from contrast-enhanced DECT images.Phys Med Biol. 2024 Dec 9;69(24). doi: 10.1088/1361-6560/ad965f. Phys Med Biol. 2024. PMID: 39577082
-
Dual-Energy CT in Breast Cancer: Current Applications and Future Outlooks.Precis Radiat Oncol. 2023 Dec 1;7(4):286-294. doi: 10.1002/pro6.1213. eCollection 2023 Dec. Precis Radiat Oncol. 2023. PMID: 40336872 Free PMC article. Review.
References
-
- Furlow B. Dual-energy computed tomography. Radiol Technol. 2015;86(3):301ct–21ct. - PubMed
-
- Hünemohr N. Dual energy CT as an alternative for ion radiotherapy treatment planning. Ph.D. Thesis, the Ruprecht Karl Heidelberg University. 2014. Available from: https://archiv.ub.uni-heidelberg.de/volltextserver/17936/1/Huenemohr_DEC...
MeSH terms
Substances
LinkOut - more resources
Full Text Sources
Medical
Miscellaneous
