. 2025 Jan 7;20(1):e0316912.
doi: 10.1371/journal.pone.0316912. eCollection 2025.

Effects of the pan-caspase inhibitor Q-VD-OPh on human neutrophil lifespan and function

Affiliations

Effects of the pan-caspase inhibitor Q-VD-OPh on human neutrophil lifespan and function

Lisa Khuu et al. PLoS One. .

Abstract

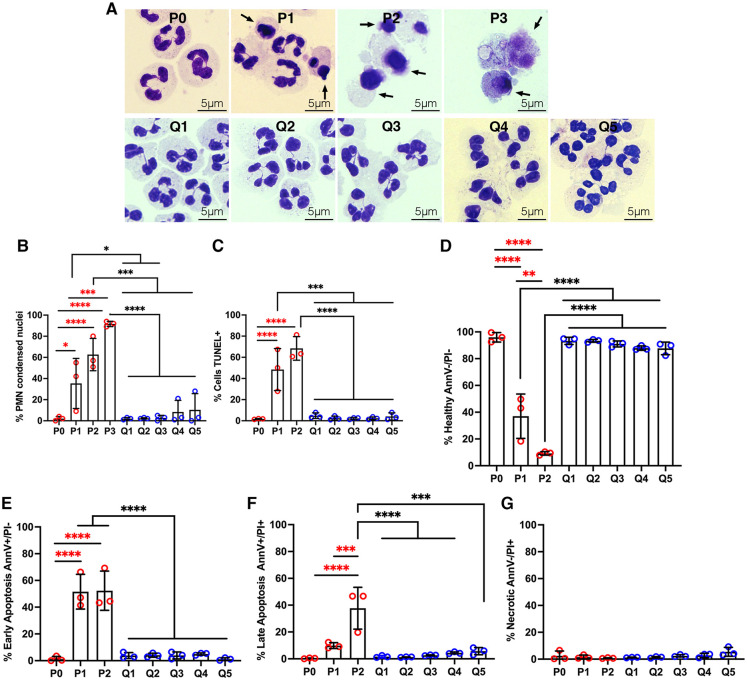
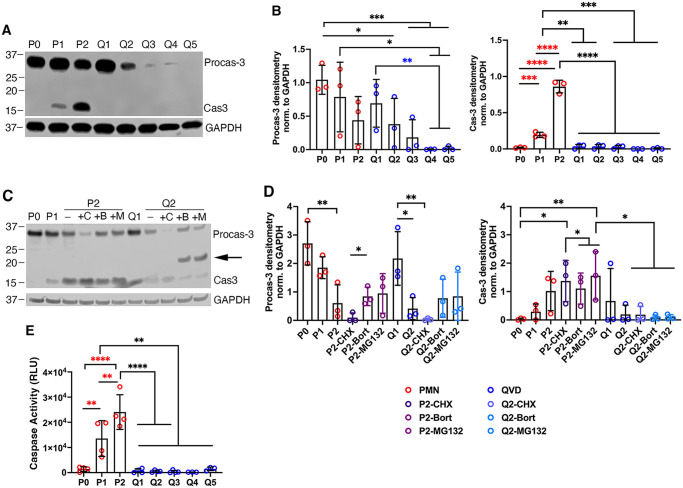
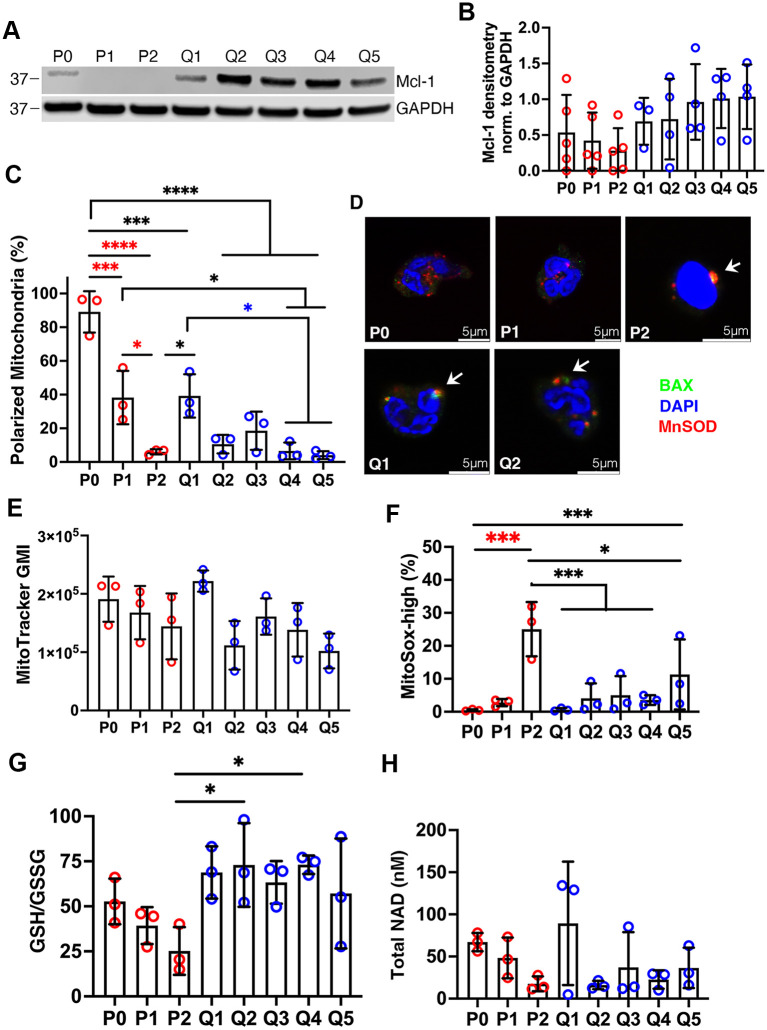
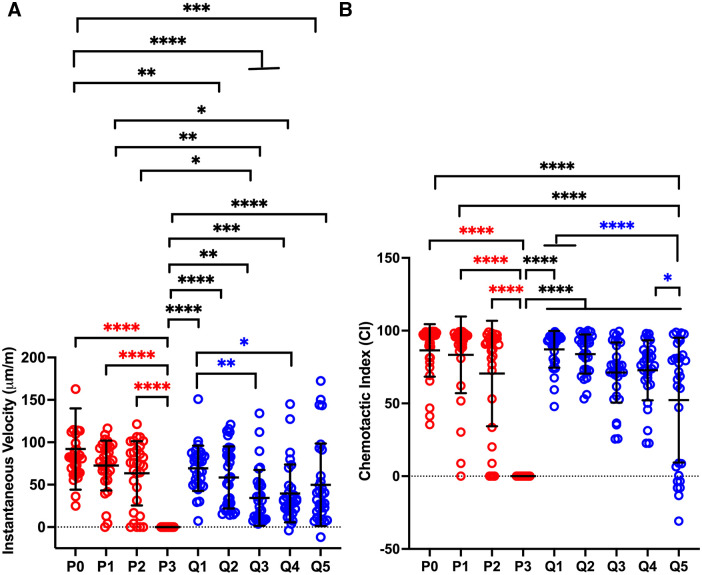
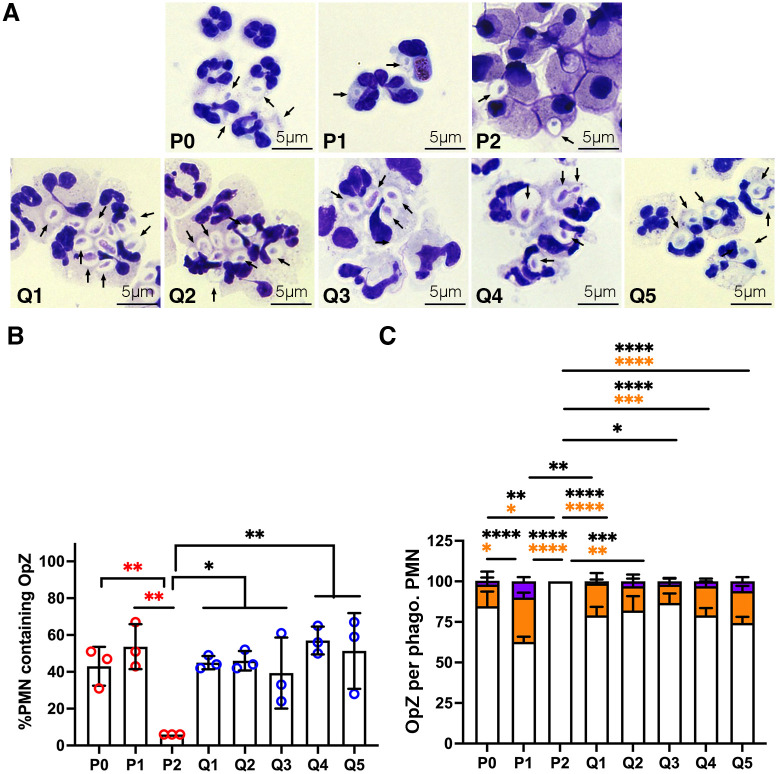
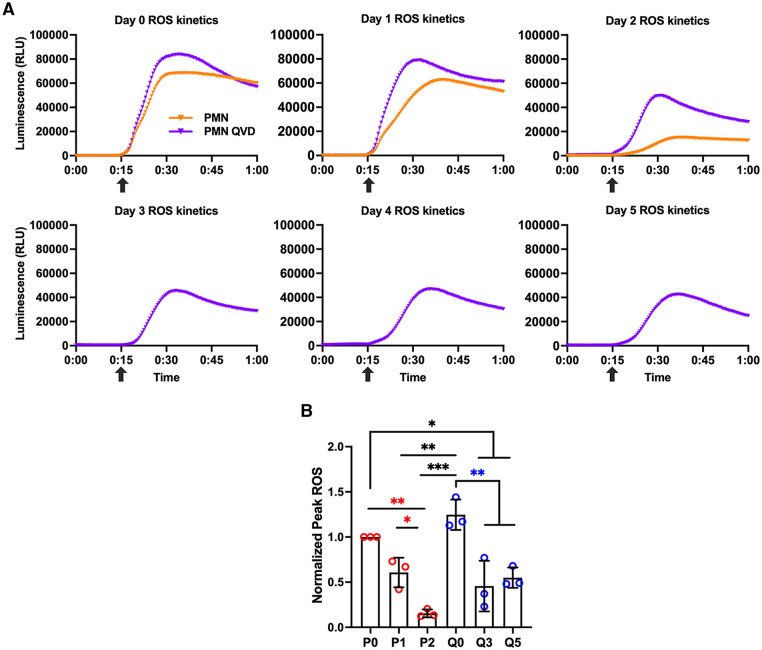
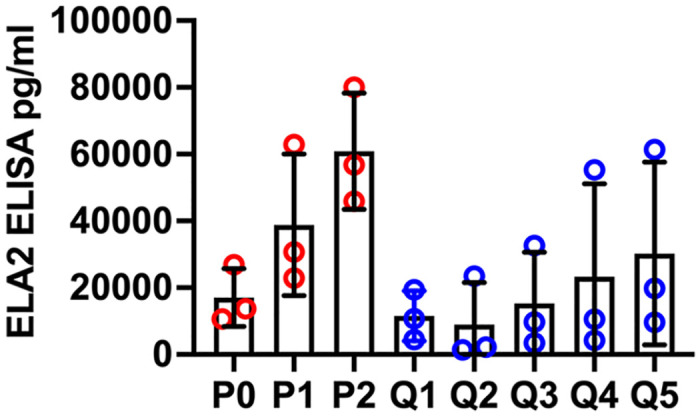
Human neutrophils are abundant, short-lived leukocytes that turn over at a rate of approximately 1011 cells/day via a constitutive apoptosis program. Certain growth factors, inflammatory mediators and infectious agents can delay apoptosis or induce neutrophils to die by other mechanisms. Nonetheless, a large body of data demonstrates that apoptosis of untreated neutrophils typically ensues within 24 hours of cell isolation and in vitro culture. At the molecular level apoptosis is driven by executioner caspase-3, and during this process cell proinflammatory capacity and host defense functions are downregulated. We undertook the current study to determine the extent to which human neutrophil viability and function could be prolonged by treatment with the non-toxic, irreversible, pan-caspase inhibitor Q-VD-OPh. Our data demonstrate that a single 10 μM dose of this drug was sufficient to markedly prolong cell lifespan. Specifically, we show that apoptosis was prevented for at least 5 days as indicated by analysis of nuclear morphology, DNA fragmentation, and phosphatidylserine externalization together with measurements of procaspase-3 processing and caspase activity. Conversely, mitochondrial depolarization declined despite abundant Myeloid Cell Leukemia 1 (MCL-1). At the same time, glutathione levels were maintained and Q-VD-OPh prevented age-associated increases mitochondrial oxidative stress. Regarding functional capacity, we show that phagocytosis, NADPH oxidase activity, chemotaxis, and degranulation were maintained following Q-VD-OPh treatment, albeit to somewhat different extents. Thus, a single 10 μM dose of Q-VD-OPh can sustain human neutrophil viability and function for at least 5 days.


Conflict of interest statement

The authors have declared that no competing interests exist.

Figures

Fig 1
Fig 1. QVD treatment prevents apoptosis for at least 5 days.
Freshly isolated neutrophils (P0), cells aged for 24 or 48 h (P1, P2) and cells treated with QVD for 1–5 days (Q1-Q5) were assayed for hallmarks of apoptosis. (A-B) Nuclear morphology was assayed using Hema-3 staining and light microcroscopy. Representative images are shown in (A). Arrows indicate cells with condensed, apoptotic nuclei. Pooled data in (B) show the percentage of neutrophils with condensed/apoptotic nuclei at each time point and are the mean + SD of three independent experiments performed in triplicate. (C) DNA fragmentation quantified by TUNEL staining at each time point. Data are the mean + SD of three independent experiments. (D-G) Neutrophils were stained with Annexin V-FITC/PI and analyzed by flow cytometry. Graph shows the percentage of healthy cells (Annexin V-/PI-) (D), early apoptotic cells (Annexin V+/PI-) (E), late apoptotic cells (Annexin V+/PI+) (F), and necrotic cells (AnnexinV-/PI+) (G) at each time point and are the the mean + SD of three independent experiments. All data were analyzed by two-way ANOVA with Tukey’s multiple comparisons post-test. *p<0.05, **p<0.01, ***p<0.001, and ****p<0.0001.
Fig 2
Fig 2. QVD inhibits caspase processing and activity and leads to procaspase-3 degradation.
(A-B) Pro- and mature caspase-3 were detected in lysates of fresh (P0), 1–2 day aged (P1, P2) and 1–5 day QVD-treated neutrophils (Q1-Q5) by western blotting with GAPDH as the loading control. Representative blots (A) and densitometric quantitation of procaspase-3 and caspase-3 normalized to GAPDH are shown as the mean + SD of three independent experiments (B). (C-D) Representative caspase-3 immunoblot of fresh (P0), 1–2 day aged (P1-P2) and 1–2 day QVD-treated PMNs (Q1-Q2) that were incubated in the absence or presence of 10 μg/ml cycloheximide (C, CHX), 5 μM bortezomib (B, Bort) or 5 μM MG-132 (M) as indicated, with GAPDH as a loading control (C). Normalized densitometric quantitation is the mean + SD of three independent experiments (D). (E) Combined activity of caspases 1, 3, 5, and 6 in fresh (P0), 1–2 day aged (P1-P2) or 1–5 day QVD-treated (Q1-Q5) PMNs quantified using Caspase-Glo® with luminescence shown in relative light units (RLU). For all graphs, data were analyzed by two-way ANOVA with Tukey’s multiple comparisons post-test.: *p<0.05, **p<0.01, and ***p<0.001, ****p<0.0001.
Fig 3
Fig 3. Differential effects of QVD on mitochondrial integrity, abundance and oxidative stress.
Freshly isolated (P0), 1–2 day aged (P1, P2) and 1–5 day QVD-treated (Q1-Q5) neutrophils were analyzed. (A-B) MCL-1 in neutrophil lysates prepared at the indicated time points was detected by immunoblotting with GAPDH as the loading control. Representative immunoblots are shown in (A) with densitometric quantitation from four independent experiments in (B). (C) PMNs were stained with MitoProbe JC-1 and analyzed via flow cytometry at each time point. Data indicate the percentage of polarized mitochondria. (D) QVD does not prevent BAX translocation to mitochondria. Representative confocal images of control and QVD-treated PMNs were stained to detect BAX (green), the mitochondrial marker MnSOD (red) and DNA (blue). (E) PMNs were stained with MitoTracker Deep Red to quantify total mitochondrial mass as geometric mean intensity (GMI). (F) Neutrophils were stained with MitoSOX™ Red and analyzed by flow cytometry at each time point. The percentage of superoxide-positive mitochondria is shown. (G) Ratios of glutathione (GSH) to glutathione disulfide (GSSG) were quantified using GSH/GSSG-Glo™ Assay kits. (H) Quantitation of total neutrophil NAD. For graphs in C and E-H, data are the mean + SD of three independent determinations and data were analyzed by two-way ANOVA with Tukey’s multiple comparisons post-test. *p<0.05, **p<0.01, ***p<0.001 and ****p<0.0001.
Fig 4
Fig 4. QVD preserves neutrophil chemotaxis to fMLF.
Chemotaxis of fresh (P0), 1–3 day aged (P1-P3) control and 1–5 day QVD-treated (Q1-Q5) PMNs migrating in an fMLF gradient was analyzed with EZ-TAXIScan video imaging. Instantaneous velocities (A) and chemotactic indices (B) of individual cells are shown. Data are the mean + SD of three independent experiments. For all graphs data were analyzed by two-way ANOVA with Tukey’s multiple comparisons post-test. *p<0.05, **p<0.01 ***p<0.001 and ****p<0.0001.
Fig 5
Fig 5. Phagocytic capacity of QVD-treated PMNs is unchanged over 5 days.
At each time point, fresh, aged and QVD-treated neutrophils were fed OpZ particles at a ratio of 4 particles per cell and incubated for 15 min at 37°C with nutation. (A) Representative images of Hema-3-stained control (P0-P2) and QVD-treated (Q1-Q5) PMNs at each time point. Arrows indicate OpZ phagosomes. (B) Quantitation of the percentage of PMNs that ingested OpZ at each time point. Data are the mean + SD of three independent experiments. (C) Quantitation of the number particles in each cell that ingested OpZ. White bars 1–2 OpZ/cell, orange bars 3–4 OpZ/cell, purple bars 5–6 OpZ/cell. For all graphs data were analyzed by two-way ANOVA with Tukey’s multiple comparisons post-test. *p<0.05, **p<0.01, ***p<0.001 and ****p<0.0001.
Fig 6
Fig 6. Respiratory burst capacity is diminished but not absent 3–5 days after QVD treatment.
Oxidant production was detected using the luminol chemiluminescence assay. Responses were measured every 30 sec for 60 min and PMA was added to 200 nM final concentration at 15 min (arrows). (A) Representative data obtained for control and QVD-treated cells on days 0–5 as indicated. Data points are the mean of triplicate technical replicates. (B) Pooled data from three independent experiments show peak ROS normalized to freshly isolated control cells (P0) stimulated with PMA. Data are the mean + SD of three independent experiments and were analyzed by Student’s two-tailed t-test. *p<0.05, **p<0.01 and ***p<0.001.
Fig 7
Fig 7. Quantitation of elastase release.
Release of elastase (ELA2) into the culture medium by fresh (P0), 24-48h aged (P1-P2) or 1–5 day QVD-treated (Q1-Q5) cells was quantified by ELISA. Data are the mean ± SD of three independent experiments and were analyzed by two-way ANOVA with Tukey’s multiple comparisons post-test.

Similar articles

References

    1. McCracken JM, Allen L-AH. Regulation of human neutrophil apoptosis and lifespan in health and disease. J Cell Death. 2014;7:15–23. Epub 2014/10/04. doi: 10.4137/JCD.S11038 . - DOI - PMC - PubMed
    1. Perez-Figueroa E, Alvarez-Carrasco P, Ortega E, Maldonado-Bernal C. Neutrophils: Many Ways to Die. Front Immunol. 2021;12:631821. Epub 20210304. doi: 10.3389/fimmu.2021.631821 . - DOI - PMC - PubMed
    1. Kennedy AD, DeLeo FR. Neutrophil apoptosis and the resolution of infection. Immunol Res. 2009;43(1–3):25–61. doi: 10.1007/s12026-008-8049-6 . - DOI - PubMed
    1. Savill JS, Wyllie AH, Henson JE, Walport MJ, Henson PM, Haslett C. Macrophage phagocytosis of aging neutrophils in inflammation. Programmed cell death in the neutrophil leads to its recognition by macrophages. J Clin Invest. 1989;83(3):865–75. doi: 10.1172/JCI113970 . - DOI - PMC - PubMed
    1. Whyte MK, Meagher LC, MacDermot J, Haslett C. Impairment of function in aging neutrophils is associated with apoptosis. J Immunol. 1993;150(11):5124–34. doi: 10.4049/jimmunol.150.11.5124 - DOI - PubMed

MeSH terms

LinkOut - more resources