. 2024 Dec 30;20(12):e1012816.
doi: 10.1371/journal.ppat.1012816. eCollection 2024 Dec.

Withaferin A inhibits Chikungunya virus nsP2 protease and shows antiviral activity in the cell culture and mouse model of virus infection

Affiliations

Withaferin A inhibits Chikungunya virus nsP2 protease and shows antiviral activity in the cell culture and mouse model of virus infection

Kiran Bala Sharma et al. PLoS Pathog. .

Abstract

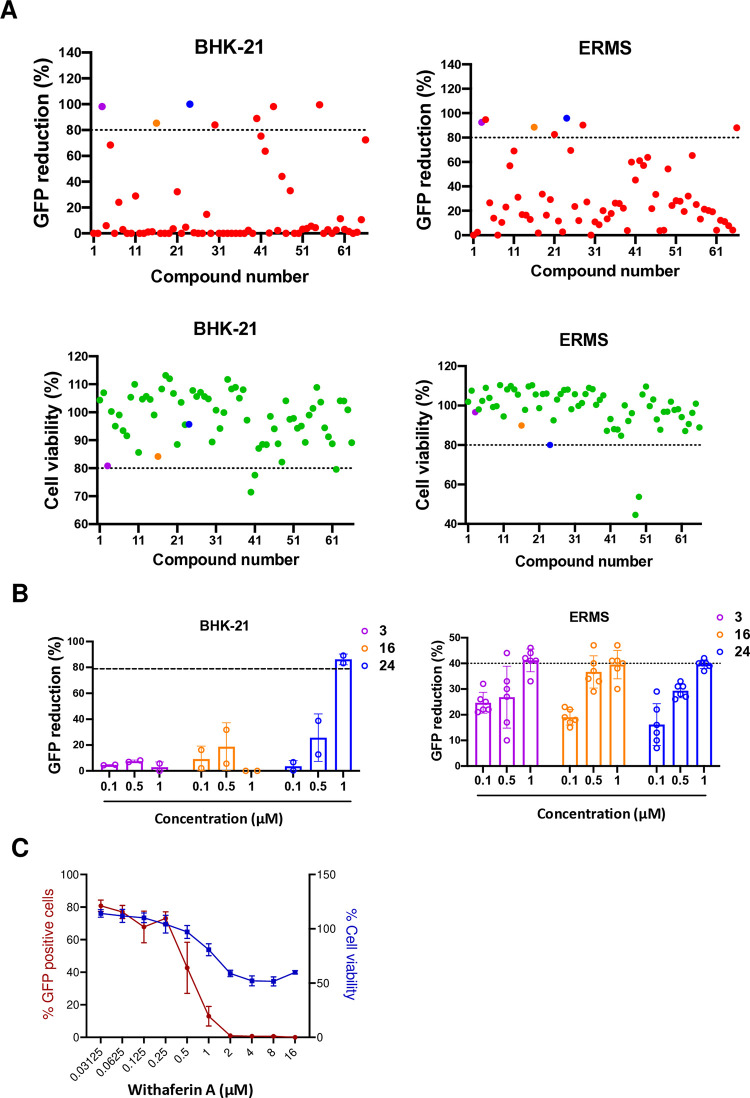
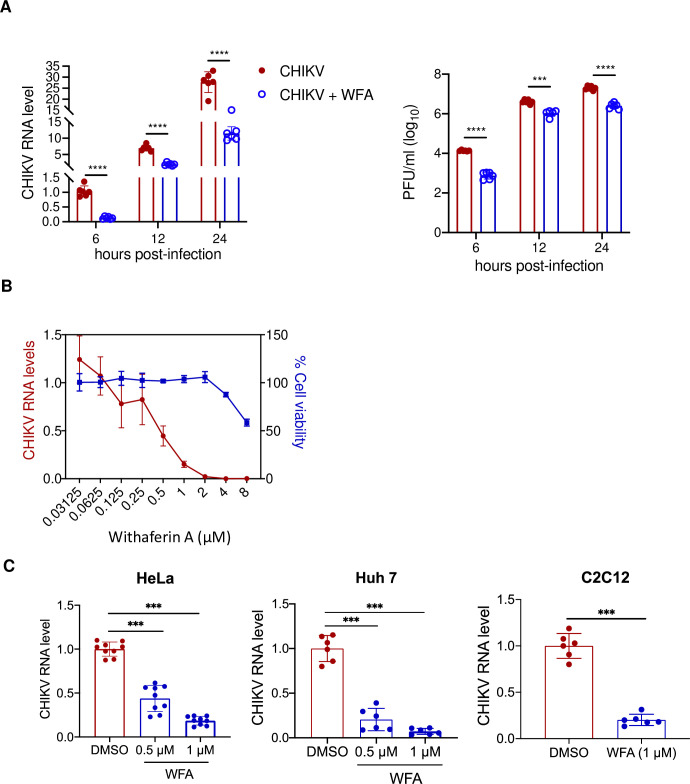
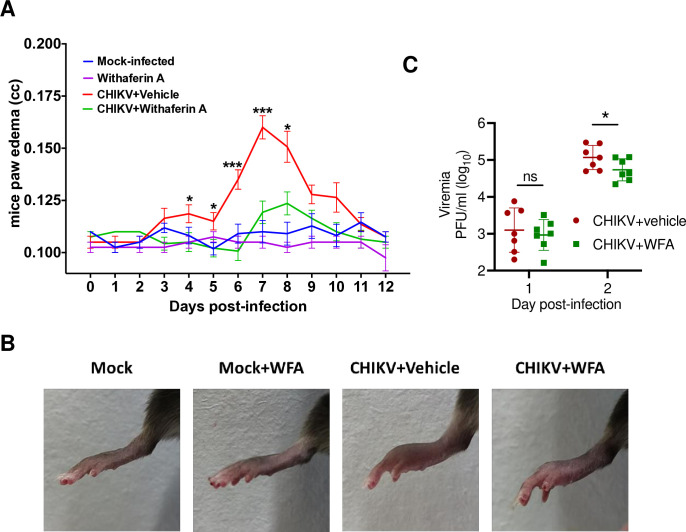
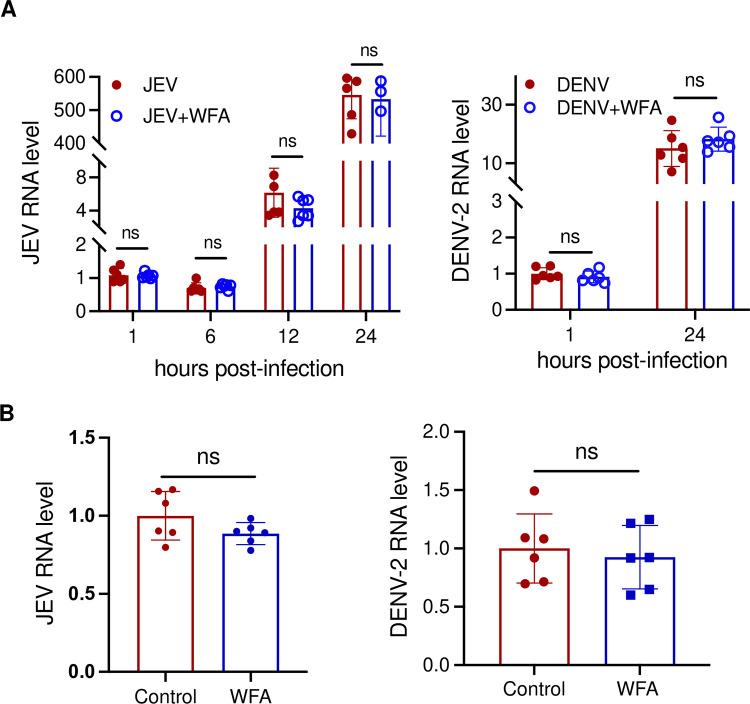
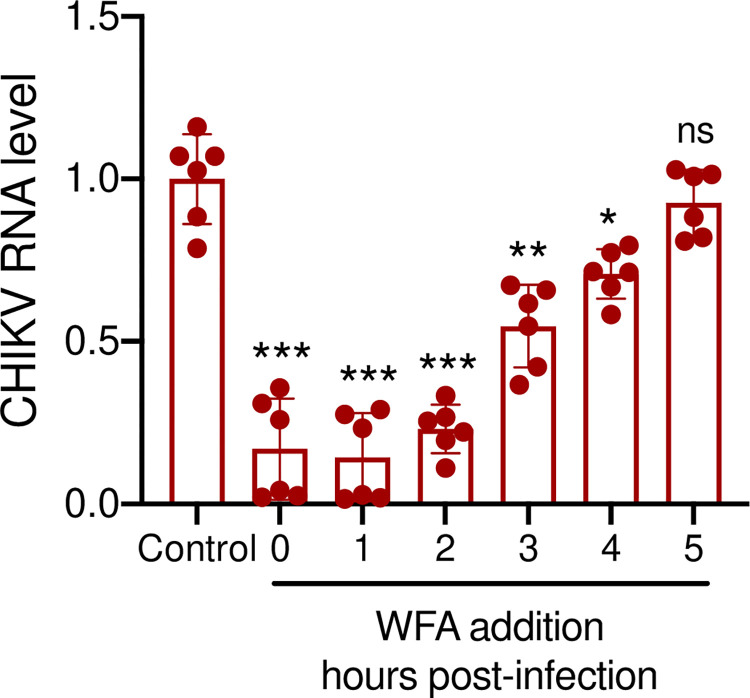
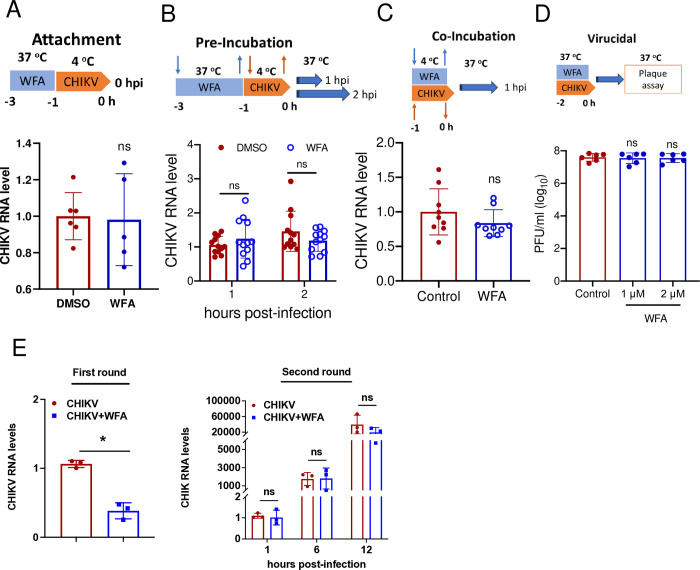
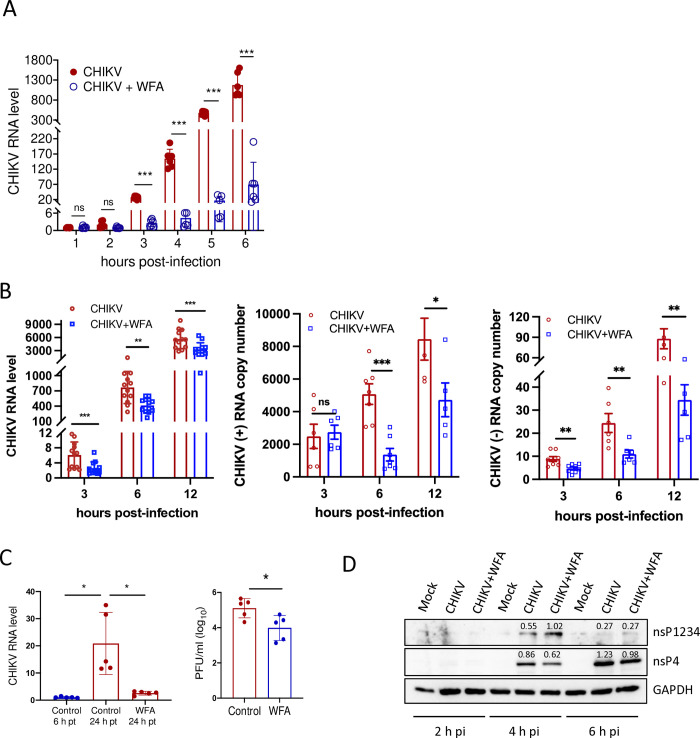
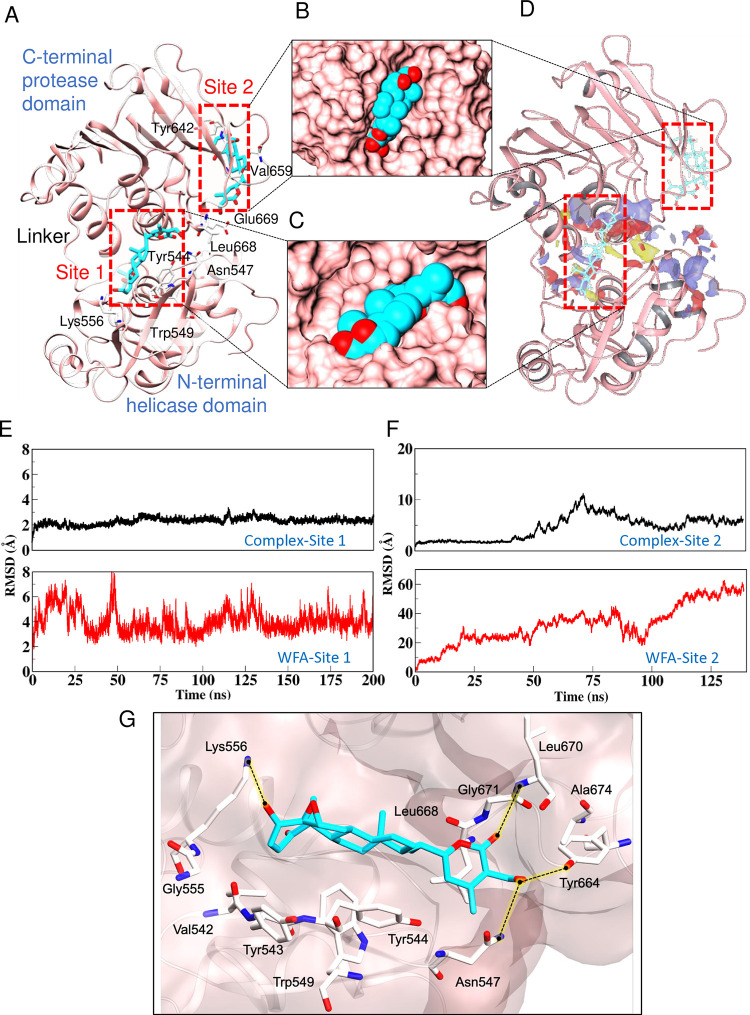
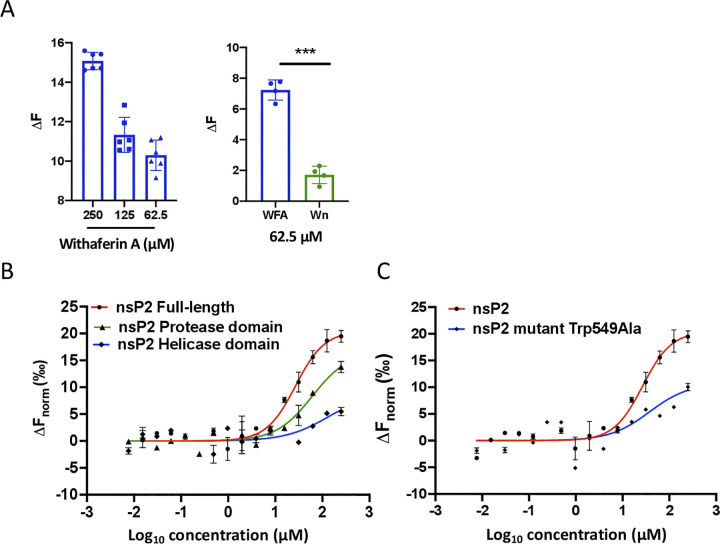
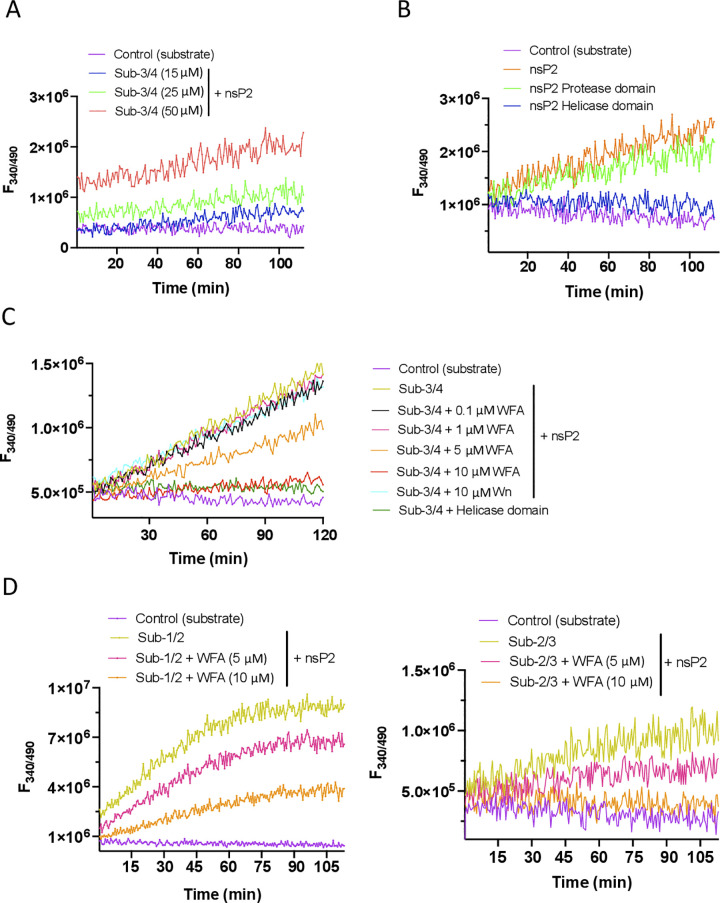
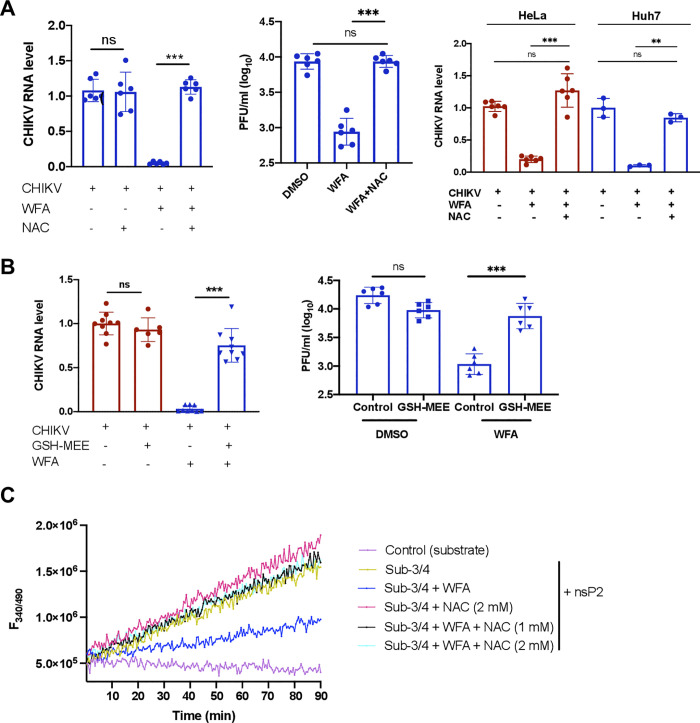
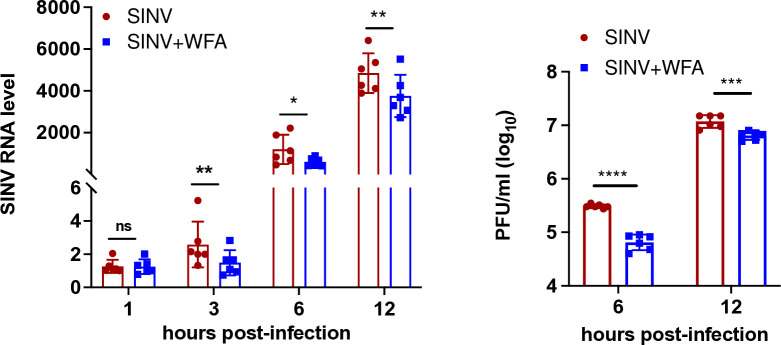
Chikungunya virus (CHIKV) is a mosquito-transmitted alphavirus causing fever, myalgia, and debilitating joint swelling and pain, which in many patients becomes chronic. The frequent epidemics of CHIKV across the world pose a significant public health burden necessitating the development of effective antiviral therapeutics. A cellular imaging-based high-content screening of natural compounds identified withaferin A (WFA), a steroidal lactone isolated from the plant Withania somnifera, as a potent antiviral against CHIKV. In the ERMS cells, WFA inhibited CHIKV replication early during the life cycle by binding the CHIKV non-structural protein nsP2 and inhibiting its protease activity. This inhibited the viral polyprotein processing and the minus-sense viral RNA synthesis. WFA mounted the nsP2 protease inhibitory activity through its oxidising property as the reducing agents N-acetylcysteine and Glutathione-monoethyl ester effectively reversed the WFA-mediated protease inhibition in vitro and abolished the WFA-mediated antiviral activity in cultured cells. WFA inhibited CHIKV replication in the C57BL/6 mouse model of chikungunya disease, resulting in significantly lower viremia. Importantly, CHIKV-infected mice showed significant joint swelling which was not seen in WFA-treated mice. These data demonstrate the potential of WFA as a novel CHIKV antiviral.


Conflict of interest statement

The authors have declared that no competing interests exist.

Figures

Fig 1
Fig 1. Screening of the natural compounds for the CHIKV antiviral activity.
(A) BHK-21 or ERMS cells were seeded in a 96-well plate and infected with CHIKV-GFP at 0.1 or 5 MOI for 20 or 32 h, respectively and treated with DMSO (vehicle control) or the test compounds. The top panels show the CHIKV replication inhibition as per cent GFP reduction using different compounds at 10 μM concentration. The bottom panels show the percentage of cell viability for each compound. (B) BHK-21 or EMRS cells were seeded in a 96-well plate and infected with CHIKV-GFP at 0.1 or 5 MOI for 20 or 32 h, respectively and treated with the indicated concentrations of different compounds. The bar graphs show the CHIKV replication inhibition as per cent GFP reduction for the selected compounds at lower concentrations of 0.1, 0.5, and 1.0 μM. (C) BHK-21 cells were infected with CHIKV-GFP (0.1 MOI) and treated with different concentrations of WFA. The dose-response curve demonstrating the per cent GFP and per cent cell viability at different WFA concentrations at 24 h pi is shown.
Fig 2
Fig 2. Anti-CHIKV activity of WFA in different cell lines.
(A) ERMS cells were infected with CHIKV at 1 MOI. At 0 h pi, the cell culture medium was supplemented with WFA (1 μM) or the vehicle DMSO (control). The total RNA was isolated at different times pi to quantify the intracellular viral RNA levels by qRT-PCR. The relative levels of the CHIKV RNA are shown in the left panel, where the CHIKV RNA level at 6 h pi in the control was taken as 1. The culture supernatant from the CHIKV-infected cells was collected, and the virus titers determined by the plaque assay are shown in the right panel. (B) ERMS cells infected with CHIKV (1 MOI) were treated with different concentrations of WFA. The cells were processed at 6 h pi for the intracellular viral RNA quantitation by qRT-PCR and cell viability by the MTT assay. The line graph demonstrating the relative viral RNA levels and per cent cell viability at the indicated WFA concentrations is shown. The viral RNA levels and per cent cell viability were normalized to the respective vehicle-only controls. (C) HeLa, Huh7, or C2C12 cells were infected with CHIKV (MOI 1) in the presence of WFA or DMSO (vehicle control), and the total RNA was isolated at 6 h pi. The relative CHIKV RNA levels determined by qRT-PCR are presented where the level of CHIKV RNA in the control cells was taken as 1. The student’s t-test was used to calculate the p values; *p<0.05, **p<0.01, ***p<0.001.
Fig 3
Fig 3. WFA antiviral activity in the mouse model of CHIKV infection.
C57BL/6 mice of 12 weeks of age were mock-infected or infected sub-cutaneous with 104 PFU of CHIKV and treated with vehicle alone or WFA (5 mg/kg) given intra-peritoneal twice a day. The first dose of WFA was delivered 4 h pi. The mice in all 4 groups were followed for 2 weeks, and the paw edema was measured daily using a digital plethysmometer. (A) A line graph demonstrating the mouse paw edema on different d pi is presented. The Boneforreni post hoc test, followed by a two-sided independent t-test, was used to calculate the p values: *p<0.0332, **p<0.0021, ***p<0.0002, ****p<0.0001. (B) The representative images showing the footpad swelling observed in different treatment groups at 7 d pi are presented. (C) The CHIKV load in the mouse serum at 1 and 2 d pi, as determined by the plaque assay, is shown. The student’s t-test was used to calculate the p values: *p<0.05, **p<0.01, ***p<0.001, ns = not significant.
Fig 4
Fig 4. Antiviral activity of WFA is CHIKV specific.
(A) ERMS cells were infected with JEV (MOI 1) or DENV-2 (MOI 5) in the presence of 1 μM WFA or DMSO (control). The total RNA was extracted at different times pi, and the relative level of the viral RNA was determined by qRT-PCR. The virus RNA level at 1 h pi in the control cells was taken as 1. (B) HeLa cells were infected with JEV (MOI 1) or DENV-2 (MOI 5) in the presence of 1 μM WFA or DMSO (control). The total RNA was extracted at 24 h pi, and the relative level of viral RNA was determined by qRT-PCR. The virus RNA level at 24 h pi in the control cells was taken as 1. The student’s t-test was used to calculate the p values: *p<0.05, **p<0.01, ***p<0.001, ns = not significant.
Fig 5
Fig 5. WFA restricts CHIKV replication at the early stage of replication.
ERMS cells were infected with CHIKV (1 MOI) and incubated with 1 μM WFA at different time points after the infection. The control CHIKV-infected cells were incubated with DMSO. The cells were harvested at 6 h pi, and the total RNA was extracted. The qRT-PCR was used to determine the CHIKV RNA levels. The relative viral RNA levels are shown. The CHIKV RNA level at 6 h pi in the control cells was taken as 1. The viral RNA level in the control (DMSO-treated) cells was compared with those treated with WFA at different time points. The student’s t-test was used to calculate the p values; *p<0.05, **p<0.01, ***p<0.001, ns = not significant.
Fig 6
Fig 6. WFA does not affect CHIKV binding and entry into the cells.
(A) ERMS cells were incubated with 1 μM WFA or DMSO (as the vehicle control) for 2 h at 37°C. The cells were then incubated for 1 h with CHIKV (MOI 1) on ice to allow the virus attachment but not its uptake. The cells were washed with ice-cold PBS, and the total RNA was extracted. The qRT-PCR was used to determine the level of CHIKV RNA. The relative levels of CHIKV RNA are plotted where CHIKV RNA in the control cells was taken as 1. (B) ERMS cells were incubated with 1 μM WFA or DMSO (as the vehicle control) for 2 h at 37°C. The cells were washed with PBS and then incubated for 1 h with CHIKV (MOI 1) on ice to allow the virus attachment. The cells were incubated for 1 or 2 h at 37°C for viral uptake and then treated with trypsin to remove uninternalized particles. The cells were then washed with PBS, and the total RNA was extracted. The qRT-PCR was used to determine the level of CHIKV RNA. The relative levels of CHIKV RNA are shown where CHIKV RNA in the control cells was taken as 1. (C) ERMS cells were co-incubated with 1 μM WFA and CHIKV (MOI 1) for 1 h at 4°C and incubated for 1h at 37°C for viral uptake. The control cells were incubated with DMSO and CHIKV. The cells were treated with trypsin to remove the uninternalized virion particles. The cells were then washed with PBS, and the total RNA was extracted. The qRT-PCR was used to determine the level of CHIKV RNA. The relative levels of CHIKV RNA are shown where CHIKV RNA in the control cells was taken as 1. (D) For the virucidal assay, CHIKV and WFA (1 or 2 μM) were incubated at 37°C for 2 h. The control had the virus incubated with DMSO. The viral infectivity was determined by the plaque assay. (E) For the first round of infection, ERMS cells were incubated with CHIKV (MOI 0.1) for 1 h. Following this, the cells were incubated with the culture medium supplemented with WFA (1 μM) or the vehicle DMSO (control). The culture supernatant was collected at 12 h pi for determining the virus titers and cells were harvested for the viral RNA quantitation (left panel). For the second round of infection, ERMS cells were infected (MOI 0.1) with the virus collected at 12 h pi from the first round. The culture supernatant and the cells were harvested at different times pi to determine the CHIKV RNA levels (right panel). The student’s t-test was used to calculate the p values; *p<0.05, **p<0.01, ***p<0.001, ns = not significant.
Fig 7
Fig 7. WFA affects CHIKV RNA synthesis and polyprotein processing.
(A) ERMS cells were infected with CHIKV (1 MOI) and incubated with 1 μM WFA. The control CHIKV-infected cells were incubated with DMSO. The cells were harvested at different time intervals, and total RNA was extracted. The qRT-PCR was used to determine the CHIKV RNA levels. The relative viral RNA levels are shown. The CHIKV RNA level at 1 h pi in the control cells was taken as 1. (B) ERMS cells were infected with CHIKV (MOI 1) and incubated with 1 μM WFA. The control CHIKV-infected cells were incubated with DMSO. The cells were harvested at different time intervals, and total RNA was extracted. The qRT-PCR was used to determine the CHIKV RNA levels. The relative viral RNA levels are shown in the left panel. The CHIKV RNA level at 1 h pi in the control cells was taken as 1. The CHIKV plus- and minus-sense RNA copy numbers were determined using a standard curve and qRT-PCR, and shown in the middle and right panels, respectively. (C) ERMS cells were transfected with 200 ng of CHIKV RNA, and 6 h later, cells were treated with WFA (1 μM) or DMSO (control). The cells and culture supernatants were harvested 24 h post-transfection (pt) to determine the intracellular CHIKV RNA levels by qRT-PCR (left panel) and the extracellular virus titer by the plaque assay (right panel). The relative RNA levels are plotted where the virus RNA level in the control cells at 6 h pt was taken as 1. (D) ERMS cells were mock infected or infected with CHIKV (1 MOI). The virus-infected cells were incubated with 1 μM WFA. The control CHIKV-infected cells were incubated with DMSO. The cells were harvested at different time points and the cell lysates were western blotted with nsP4 antibody. GAPDH was used as the loading control. The relative band intensity compared to the GAPDH band was measured using the ImageJ software and indicated over the band. The student’s t-test was used to calculate the p values; *p<0.05, **p<0.01, ***p<0.001, ns = not significant.
Fig 8
Fig 8. WFA binding to CHIKV nsP2 in silico.
(A) The CHIKV nsP2 protein is rendered in the cartoon representation and coloured in pink, while WFA is shown in the liquorice representation and coloured atom-wise as C: cyan, and O: red. The binding of WFA at Site 1 and Site 2 is shown. (B-C) The insets show the WFA atomic fitting in the respective pocket; the protein is rendered in the surface view in the pink colour and WFA is shown in the vdW representation. (D) The SiteMap analysis on the CHIKV nsP2 protease. (E-F) The RMSD plots of the WFA-CHIKV complex and WFA at Site 1 and Site 2 from the MD analysis are shown. (G) The interaction map of WFA with the Site 1 residues lining within 4.0 Å is shown. The residues are shown in the liquorice representation and coloured atom-wise as C: white, N: blue, and O: red. The black dotted lines with yellow background represent the hydrogen bonds. The protein is shown in the Quick surf representation.
Fig 9
Fig 9. WFA binds to CHIKV nsP2 in vitro.
(A) Microscale thermophoresis was used to study the binding of the labelled CHIKV nsP2 protein (1 μM) with different concentrations of WFA or Wn. The bar graphs display the fluorescence change (ΔF) obtained on nsP2 binding with different concentrations of WFA or Wn in reference to the unbound protein state in the buffer. The left panel shows the nsP2 binding with different WFA concentrations. The right panel shows nsP2 binding with WFA and Wn at the indicated concentration. The student’s t-test was used to calculate the p value; ***p<0.001. (B) To examine the binding and determine the equilibrium dissociation constant between CHIKV nsP2, its protease and helicase domains, and WFA, 1 μM labelled protein was titrated with different concentrations of WFA ranging from 250 to 0.03 μM. (C) To study the effect of the nsP2 mutation on WFA binding 1 μM labelled protein was titrated with different concentrations of WFA. For the binding affinity analysis, ligand-dependent changes in temperature-related intensity change (TRIC) https://nanotempertech.com/nanopedia/tric/are plotted as Fnorm values against the WFA concentrations in a dose-response curve. The Fnorm values are plotted as parts per thousand (‰).
Fig 10
Fig 10. WFA inhibits the protease activity of CHIKV nsP2.
A FRET-based protease assay was used to study the nsP2 protease activity. (A) The real-time profile of the proteolytic assay is presented using 1 μM nsP2 protein with different concentrations of the fluorogenic peptide substrate (Sub-3/4). The fluorescence was monitored every 40 sec. (B) The real-time profile of the proteolytic assay is presented using 1 μM each of the nsP2 protein, or its protease and helicase domains with 25 μM fluorogenic peptide substrate Sub-3/4. The fluorescence was monitored every 40 sec. (C) The real-time profile of the proteolytic assay was obtained using different concentrations of WFA or Wn with 1 μM nsP2 and 25 μM peptide substrate Sub-3/4. A proteolytic assay with 1 μM CHIKV nsP2 helicase domain and 25 μM peptide substrate was also performed as the control. The fluorescence was monitored every 30 sec. (D) The real-time fluorescence profile of CHIKV nsP2 (1 μM) protease assay with different concentrations of WFA and 25 μM fluorogenic peptide substrates (Sub-1/2, Sub-2/3). The fluorescence was recorded every 30 sec. For every assay, the background fluorescence of the substrate peptide was monitored without the enzyme and shown as control (substrate).
Fig 11
Fig 11. Reducing agents reverse WFA-mediated antiviral activity.
(A) ERMS, HeLa or Huh7 cells were infected with CHIKV at 1 MOI. At 0 h pi, cells were incubated with WFA (1 μM) or the vehicle DMSO (control) in the presence or absence of NAC (3 mM) for 6 h. The total RNA isolated from ERMS cells was used to quantify the intracellular viral RNA levels by qRT-PCR (left panel). The culture supernatant from the CHIKV-infected ERMS cells was collected, and the virus titers were determined by the plaque assay (middle panel). The total RNA isolated from HeLa and Huh7 cells was used to quantify the intracellular viral RNA levels by qRT-PCR (right panel). (B) ERMS cells were infected with CHIKV at 1 MOI. At 0 h pi, cells were incubated with WFA (1 μM) or the vehicle DMSO (control) in the presence or absence of GSH-MEE (3 mM) for 6 h. The total RNA isolated from ERMS cells was used to quantify the intracellular viral RNA levels by qRT-PCR (left panel). The culture supernatant from the CHIKV-infected ERMS cells was collected, and the virus titers were determined by the plaque assay (right panel). (C) The real-time fluorescence profile of CHIKV nsP2 (1 μM) protease assay with 5 μM WFA and 25 μM peptide substrate in the presence or absence of NAC at the indicated concentration was recorded every 30 sec. In the control (substrate) assay, the background fluorescence of the substrate peptide was monitored without the enzyme. The student’s t-test was used to calculate the p values; *p<0.05, **p<0.01, ***p<0.001, ns = not significant.
Fig 12
Fig 12. Replication of SINV in presence of WFA.
ERMS cells were infected with SINV (MOI 1) in the presence of 1 μM WFA or DMSO (control). The cells and culture supernatants were harvested at different times pi. The total RNA was extracted from the cells, and the relative level of the viral RNA was determined by qRT-PCR. The virus RNA level at 1 h pi in the control cells was taken as 1. The relative viral RNA levels are shown in the left panel. The right panel shows the SINV titers. The viral RNA levels and titers in the control cells were compared with those in the WFA-treated cells. The student’s t-test was used to calculate the p values; *p<0.05, **p<0.01, ***p<0.001, ns = not significant.

Similar articles

Cited by

References

    1. Weaver SC, Chen R, Diallo M. 2020. Chikungunya Virus: Role of Vectors in Emergence from Enzootic Cycles. Annu Rev Entomol 65:313–332. doi: 10.1146/annurev-ento-011019-025207 - DOI - PubMed
    1. Bartholomeeusen K, Daniel M, LaBeaud DA, Gasque P, Peeling RW, Stephenson KE, Ng LFP, Arien KK. 2023. Chikungunya fever. Nat Rev Dis Primers 9:17. doi: 10.1038/s41572-023-00429-2 - DOI - PMC - PubMed
    1. Azar SR, Campos RK, Bergren NA, Camargos VN, Rossi SL. 2020. Epidemic Alphaviruses: Ecology, Emergence and Outbreaks. Microorganisms 8. doi: 10.3390/microorganisms8081167 - DOI - PMC - PubMed
    1. de Lima Cavalcanti TYV, Pereira MR, de Paula SO, Franca RFO. 2022. A Review on Chikungunya Virus Epidemiology, Pathogenesis and Current Vaccine Development. Viruses 14. - PMC - PubMed
    1. ECDC. 2023. European Centre for Disease Prevention and Control. https://www.ecdc.europa.eu/. Accessed

MeSH terms