Identification of markers correlating with mitochondrial function in myocardial infarction by bioinformatics
- PMID: 39775580
- PMCID: PMC11684664
- DOI: 10.1371/journal.pone.0316463
Identification of markers correlating with mitochondrial function in myocardial infarction by bioinformatics
Abstract
Background: Myocardial infarction (MI), one of the most serious cardiovascular diseases, is also affected by altered mitochondrial metabolism and immune status, but their crosstalk is poorly understood. In this paper, we use bioinformatics to explore key targets associated with mitochondrial metabolic function in MI.
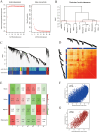
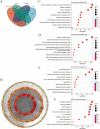
Methods: The datasets (GSE775, GSE183272 and GSE236374) were from National Center for Biotechnology Information (NCBI) Gene Expression Omnibus (GEO) in conjunction with mitochondrial gene data that were downloaded from the MitoCarta 3.0 database. Differentially expressed genes (DEGs) in the dataset were screened by ClusterGVis, Weighted Gene Co-Expression Network Analysis (WGCNA) and GEO2R, and functional enrichment was performed by Gene Set Enrichment Analysis (GSEA) and Kyoto Encyclopedia of Genomes (KEGG). Then mitochondria-associated DEGs (MitoDEGs) were obtained. Protein-protein interaction (PPI) networks were constructed to identify central MitoDEGs that are strongly associated with MI. The Cytoscape and miRWalk databases were then used to predict the transcription factors and target miRNAs of the central MitoDEG, respectively. Finally, the mouse model has been established to demonstrate the expression of MitoDEGs and their association with cardiac function.
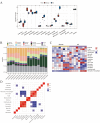
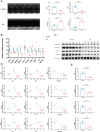
Results: MitoDEGs in MI were mainly involved in mitochondrial function and adenosine triphosphate (ATP) synthesis pathways. The 10 MI-related hub MitoDEGs were then obtained by eight different algorithms. Immunoassays showed a significant increase in monocyte macrophage and T cell infiltration. According to animal experiments, the expression trends of the four hub MitoDEGs (Aco2, Atp5a1, Ndufs3, and Ndufv1) were verified to be consistent with the bioinformatics results.
Conclusion: Our study identified key genes (Aco2, Atp5a1, Ndufs3, and Ndufv1) associated with mitochondrial function in myocardial infarction.
Copyright: © 2024 Kuang et al. This is an open access article distributed under the terms of the Creative Commons Attribution License, which permits unrestricted use, distribution, and reproduction in any medium, provided the original author and source are credited.
Conflict of interest statement
The authors have declared that no competing interests exist.
Figures


Similar articles
-
Exploring the role of mitochondrial metabolism and immune infiltration in myocardial infarction: novel insights from bioinformatics and experimental validation.Front Immunol. 2025 May 27;16:1543584. doi: 10.3389/fimmu.2025.1543584. eCollection 2025. Front Immunol. 2025. PMID: 40496861 Free PMC article.
-
Identification of immune-related mitochondrial metabolic disorder genes in septic shock using bioinformatics and machine learning.Hereditas. 2024 Nov 28;161(1):49. doi: 10.1186/s41065-024-00350-y. Hereditas. 2024. PMID: 39609718 Free PMC article.
-
Role of mitochondrial metabolic disorder and immune infiltration in diabetic cardiomyopathy: new insights from bioinformatics analysis.J Transl Med. 2023 Feb 1;21(1):66. doi: 10.1186/s12967-023-03928-8. J Transl Med. 2023. PMID: 36726122 Free PMC article.
-
Comprehensive bioinformatics analysis and experimental verification identify mitochondrial gene Dgat2 as a novel therapeutic biomarker for myocardial ischemia-reperfusion.Front Endocrinol (Lausanne). 2025 May 29;16:1539646. doi: 10.3389/fendo.2025.1539646. eCollection 2025. Front Endocrinol (Lausanne). 2025. PMID: 40510478 Free PMC article.
-
Screening mitochondria-related biomarkers in skin and plasma of atopic dermatitis patients by bioinformatics analysis and machine learning.Front Immunol. 2024 May 7;15:1367602. doi: 10.3389/fimmu.2024.1367602. eCollection 2024. Front Immunol. 2024. PMID: 38774875 Free PMC article.
References
-
- Ong SB, Hernández-Reséndiz S, Crespo-Avilan GE, Mukhametshina RT, Kwek XY, Cabrera-Fuentes HA, et al.. Inflammation following acute myocardial infarction: Multiple players, dynamic roles, and novel therapeutic opportunities. Pharmacology & therapeutics. 2018;186:73–87. Epub 2018/01/14. doi: 10.1016/j.pharmthera.2018.01.001 . - DOI - PMC - PubMed
MeSH terms
Substances
LinkOut - more resources
Full Text Sources
Medical
Miscellaneous

