

High Content Image Analysis of Cellular Responses of the Murine J774A.1 Cell Line and Primary Human Cells Alveolar Macrophages to an Extended Panel of Pharmaceutical Agents
- PMID: 39775613
- PMCID: PMC11785622
- DOI: 10.1007/s11095-024-03806-y
High Content Image Analysis of Cellular Responses of the Murine J774A.1 Cell Line and Primary Human Cells Alveolar Macrophages to an Extended Panel of Pharmaceutical Agents
Abstract
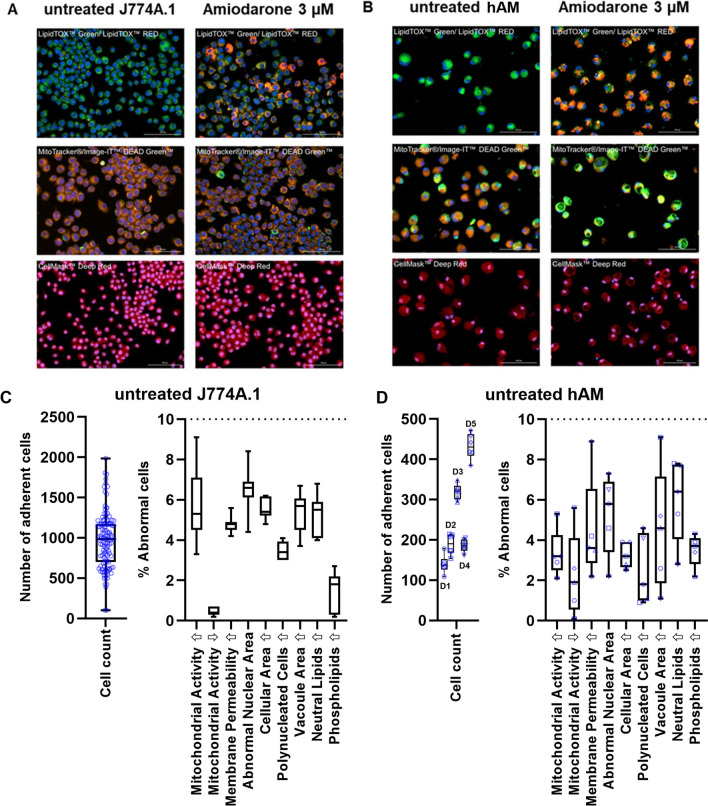
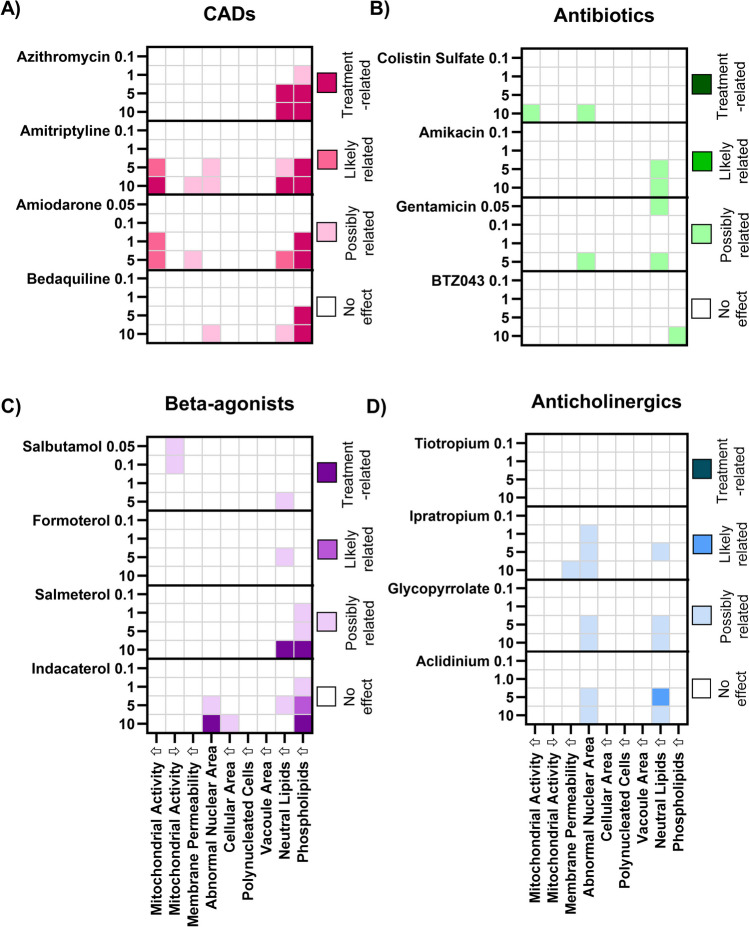
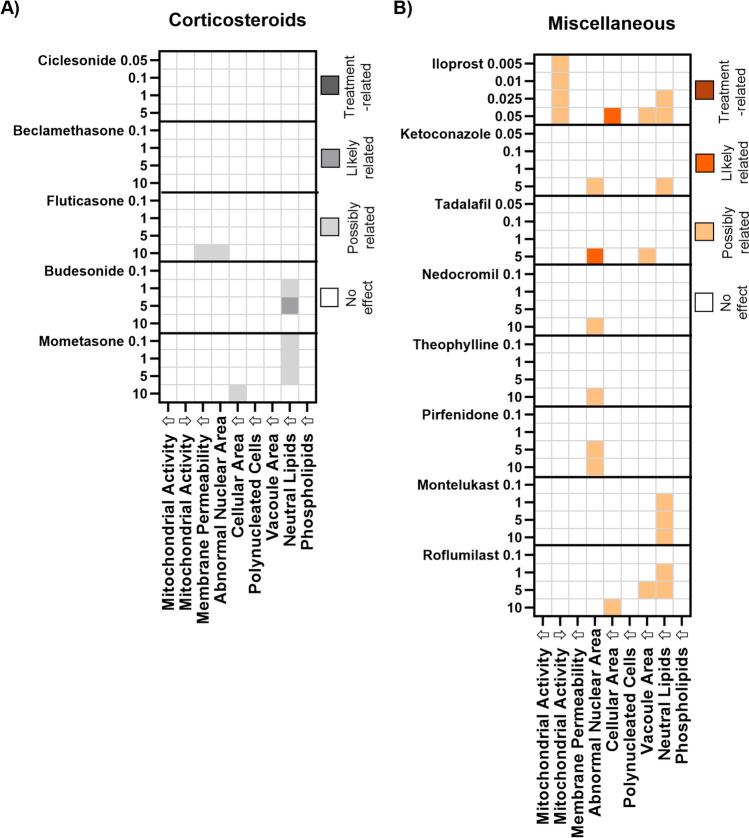
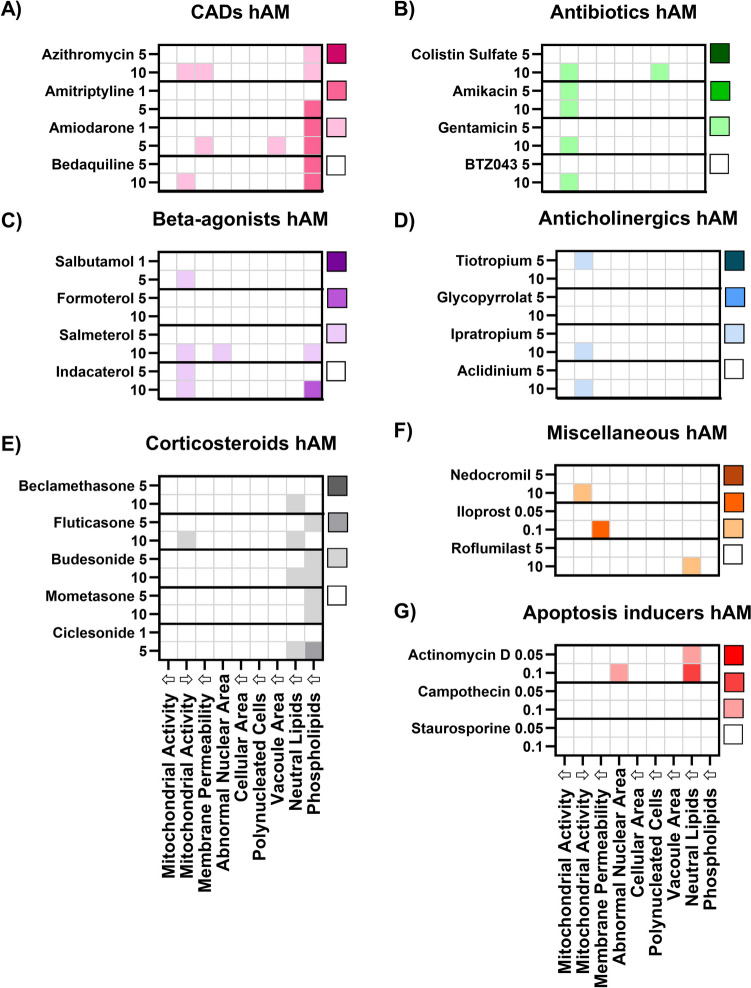
Introduction: In vitro screening of macrophages for drug-induced effects, such as phospholipidosis, is useful for detecting potentially problematic compounds in the preclinical development of oral inhaled products. High-content image analysis (HCIA) is a multi-parameter approach for cytotoxicity screening. This study provides new insights into HCIA-derived response patterns of murine J774A.1 cells and primary human alveolar macrophages (hAM).
Methods: Several compounds were compared with reference groups (cationic amphiphilic drugs and apoptosis inducers) at different concentrations (0.01 to 10 µM). After incubation, cells were stained with fluorescence markers and HCIA was performed (Cytation™ 5 Cell Imaging System). Ten parameters were analysed: non-adherent cells, increased or reduced mitochondrial activity, membrane permeability, cell area, nuclear area, polynucleated cells, vacuole area, neutral and phospholipid content. A new system of response categorisation was developed for data analysis.
Results: Murine J774A.1 cells exhibited a drug-induced response pattern that was distinct to the corresponding pattern of hAM cells. Comparison with the literature revealed that primary cells (rat or human origin) have similar response patterns, while cell lines (mouse, rat or human) exhibited a different response pattern. Hierarchical clustering revealed toxicologically aligned clusters of compounds, suggesting potential use for understanding mechanisms of drug effects in cell lines and primary cells.
Conclusions: Valuable information for selecting a suitable cell type for HCIA screening of macrophage responses to drug compounds is provided. All cell types were suitable for screening drug-induced phospholipidosis. Still, human primary alveolar macrophages responded differently to drug treatment compared to macrophage cell lines and may be required to evaluate broader response-patterns and mechanisms of toxicity.
Keywords: cationic amphiphilic drugs; drug-induced phospholipidosis; high-content image analysis; human primary alveolar macrophages.
© 2025. The Author(s).
Conflict of interest statement
Declarations. Conflict of Interest: No authors have a conflict of interest to declare.
Figures


Similar articles
-
Profiling alveolar macrophage responses to inhaled compounds using in vitro high content image analysis.Toxicol Appl Pharmacol. 2023 Sep 1;474:116608. doi: 10.1016/j.taap.2023.116608. Epub 2023 Jun 28. Toxicol Appl Pharmacol. 2023. PMID: 37385476
-
Morphometric Characterization of Rat and Human Alveolar Macrophage Cell Models and their Response to Amiodarone using High Content Image Analysis.Pharm Res. 2017 Dec;34(12):2466-2476. doi: 10.1007/s11095-017-2176-5. Epub 2017 May 24. Pharm Res. 2017. PMID: 28540501 Free PMC article.
-
Different Sensitivity of Macrophages to Phospholipidosis Induction by Amphiphilic Cationic Drugs.Int J Mol Sci. 2020 Nov 9;21(21):8391. doi: 10.3390/ijms21218391. Int J Mol Sci. 2020. PMID: 33182310 Free PMC article.
-
Significance of particle parameters in the evaluation of exposure-dose-response relationships of inhaled particles.Inhal Toxicol. 1996;8 Suppl:73-89. Inhal Toxicol. 1996. PMID: 11542496 Review.
-
Screening for the drug-phospholipid interaction: correlation to phospholipidosis.ChemMedChem. 2009 Aug;4(8):1224-51. doi: 10.1002/cmdc.200900052. ChemMedChem. 2009. PMID: 19551800 Review.
References
-
- Jones MC, Jones SA, Riffo-Vasquez Y, Spina D, Hoffman E, Morgan A, et al. Quantitative assessment of nanoparticle surface hydrophobicity and its influence on pulmonary biocompatibility. J Control Release. 2014;183(1):94–104. 10.1016/j.jconrel.2014.03.022. - PubMed
-
- Forbes B, O’Lone R, Allen PP, Cahn A, Clarke C, Collinge M, et al. Challenges for inhaled drug discovery and development: Induced alveolar macrophage responses. Adv Drug Deliv Rev. 2012;2014(71):15–33. 10.1016/j.addr.2014.02.001. - PubMed
-
- Enlo-Scott Z, Bäckström E, Mudway I, Forbes B. Drug metabolism in the lungs: opportunities for optimising inhaled medicines. Expert Opin Drug Metab Toxicol. 2021;17(5):611–25. 10.1080/17425255.2021.1908262. - PubMed
-
- Hoffman E, Urbano L, Martin A, Mahendran R, Patel A, Murnane D, et al. Profiling alveolar macrophage responses to inhaled compounds using in vitro high content image analysis. Toxicol Appl Pharmacol. 2023;474:116608. Available from: https://linkinghub.elsevier.com/retrieve/pii/S0041008X23002478. - PubMed
-
- Greaves P. Histopathology of Preclinical Toxicity Studies. Third edit. Elsevier; 2007. Available from: https://linkinghub.elsevier.com/retrieve/pii/B9780444527714X50007
MeSH terms
Substances
Grants and funding
LinkOut - more resources
Full Text Sources
