Observational Study
. 2025 Jan 8;20(1):e0317056.
doi: 10.1371/journal.pone.0317056. eCollection 2025.

Mesothelial cell responses to acute appendicitis or small bowel obstruction reactive ascites: Insights into immunoregulation of abdominal adhesion

Affiliations
Observational Study

Mesothelial cell responses to acute appendicitis or small bowel obstruction reactive ascites: Insights into immunoregulation of abdominal adhesion

Melissa A Hausburg et al. PLoS One. .

Abstract

Previous abdominal surgery (PAS) increases risk of small bowel obstruction (SBO) due to adhesions, and appendectomy (appy) is an independent risk factor for abdominal adhesion-related complications. Peritoneal inflammation, e.g., acute appendicitis (AA), causes formation of reactive ascitic fluid (rA) that activates peritoneum surface mesothelial cells (MCs) to form adhesions. Pathologic adhesions may arise if restoration of MC-regulated fibrinolysis and secretion of glycocalyx (GCX) are disrupted. Proteins affecting these processes may originate from peritoneal rA. This is a prospective observational IRB-approved study at three Level 1 trauma centers where rA is collected prior to surgical intervention for non-perforated AA or adhesiolysis for SBO. Samples from 48 appy and 15 SBO patients were used to treat human MCs and subjected to quantification of 85 inflammatory mediators. Results were compared between patients with surgically naïve abdomens (naïve) and patients with >1 PAS. Select rA caused MCs to form clusters of fibroblastic cells, extracellular matrix fibers (FIB), and secretion of GCX. PAS and naïve patient rA fluids were clustered into "fiber-GCX" (FIB-GCX) groups: highFIB-highGCX, highFIB-lowGCX, noFIB-highGCX, noFIB-lowGCX, and noFIB-noGCX. Between groups, 26 analytes were differentially abundant including innate immune response, wound healing, and mucosal defense proteins. Factors that contributed to the differences between groups were rA-induced highFIB and history of PAS. Overall, PAS patient rA showed a muted immune response compared to rA from naïve patients. Our data suggest that abdominal surgery may negatively impact future immune responses in the abdomen. Further, quantifying immunomodulators in peritoneal rA may lead to the development a personalized approach to post-surgical adhesion treatment and prevention.


Conflict of interest statement

The authors have declared that no competing interests exist.

Figures
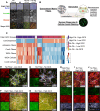
Fig 1
Fig 1. Patient rA treatment of MCs initiates formation of distinct phenotypes based on production of ECM fibers and glycocalyx secretion.
(A and D–J) Fluorescent images of cells stained with wheat germ agglutinin-594 (WGA 594): red, concanavalin A-488 (ConA 488): green, Hoechst (nuclei): blue, and Phalloidin-647: white (H–J only). (A) Brightfield and fluorescent images of MCs after 24h of culturing in 2% Control medium, human serum (HS), or with rA fluid from two patients. The rA fluid on the left initiates the MCs to produce ECM fibers while the other does not. To aid in visualization of the ECM fibers, MCs in this panel were fixed and digested for 10min with hyaluronidase prior to staining. (B) Overview of the parameters that were evaluated and scored to categorize the patient rA-fluids based on the observed phenotypes displayed by treated MCs. ECM fibers were scored by brightfield microscopy. Cellular dispersion of Hoechst-stained nuclei and lectin GCX staining were scored by fluorescence microscopy (C). Heatmap of phenotype scores showing five fiber-GCX categories that 58 patient rA fluids were assigned where each column corresponds to one patient sample. Above the heatmap are boxes colored to illustrate the groups that the fluids were assigned: dark purple–high fiber-high GCX, white–high fiber-low GCX, purple–No fiber-high GCX, pink–no fiber-low GCX, and yellow–no fiber-no GCX. Each row of the heatmap shows z-scored results from at least three independent experiments where scores were averaged or added together for ECM fiber scoring. (D–G) Panels with representative images of fiber (FIB)-GCX categories: (D) noFIB-lowGCX, (E) noFIB-noGCX, (F) highFIB-highGCX, and (G) noFIB-highGCX. (H–J) Panels with representative images of FIB-GCX categories after a 30min hyaluronidase digestion that allowed for staining of f-actin: (H) highFIB-highGCX, (I) noFIB-highGCX, and (J) noFIB-lowGCX. White inset boxes indicate zoomed regions within each panel of images, and white scale bars show 100μm.
Fig 2
Fig 2. PAS patient rA shows differential abundance in 9 immunomodulator proteins when compared to rA fluid collected from naïve patients.
(A) Flow-chart depicting decisions points leading to inclusion of 54 patient rA samples in the immunomodulator analysis down from the original 63-patient cohort. Five rA samples from the 63-patient cohort were toxic to MCs following 48-h of treatment and were excluded from further analysis. Thus, 57-patient rA samples were characterized, as illustrated in Figs 1 and S2, into 5 distinct FIB-GCX groups based on scoring of rA-treated MCs. Of the FIB-GCX groups, the highFIB-lowGCX group did not contain over 3 rA samples in our primary variable of interest, patient history of PAS; thus, this group was excluded from further analysis. Immunomodulator analysis of the 54-patient cohort consisted of quantification of 71 cytokines and chemokines and 14 soluble receptors. (B) Volcano plot with immunomodulators that were fold-regulated >|2|-fold (vertical dashed lines) graphed with -log10 transformed FDR-adjusted q-values<0.05 (horizontal dashed line) in PAS versus naïve patient rA. (C) Heatmap showing the z-scored concentrations of the proteins depicted in B in each individual patient rA displayed as columns. The rectangles above the heatmap show which group each individual sample is assigned. PAS (black) and naïve (yellow) patient samples are separated by a dashed line. The second row of rectangles shows the assigned FIB-GCX group based on cellular scoring depicted in Fig 1. PAS rA elicited either highFIB-highGCX (dark purple) or noFIB-lowGCX (magenta); whereas the naïve samples were assigned to 4 different groups: highFIB-highGCX (dark purple), noFIB-highGCX (medium purple), noFIB-lowGCX (magenta), or noFIB-noGCX (orange). The black arrowed-bracket delineates the group of PAS-highFIB-highGCX patient samples that showed a high level of congruence in immunomodulator concentration between the samples.
Fig 3
Fig 3. Immunomodulators differ between PAS-Fiber-GCX groups.
(A) Heatmap showing 33 immunomodulators that significantly differed in PAS-Fiber-GCX samples (Kruskal Wallis; P<0.05). Asterisks mark 26 proteins that have at least one significant Dunn’s pairwise comparison between PAS-Fiber-GCX groups. Yellow boxes delineate nodes of hierarchical clustering that separated three major heatmap cluster patterns. Heatmap cluster patterns as calculated using the sum of the median protein concentrations within each hierarchical cluster for each separate PAS-Fiber-GCX group. (B–D) Boxplots of the IQR and median pg/ml (horizontal line) of three proteins significantly more abundant in PAS-highFIB-highGCX. (B) Boxplot graph depicting the median (IQR) of CTACK, which is 1 of 4 (CTACK, IL-1RA, IP-10, and sCD40L) immunomodulators that show the most significant number of pairwise comparisons between groups. (B and C) CTACK and 6CKine are significantly more abundant in PAS-highFIB-highGCX compared to naïve-highFIB-highGCX, naïve-noFIB-lowGCX, and naïve-noFIB-noGCX groups. (D) In PAS-highFIB-highGCX, SDF-1 is more abundant compared to naïve-highFIB-highGCX, naïve-noFIB-highGCX, and naïve-noFIB-noGCX. FDR-adjusted q-value symbols: *** FDR<0.001; ** FDR<0.01; * FDR≤0.05).
Fig 4
Fig 4. Immunomodulators with the topmost significant differences between PAS-Fiber-GCX groups.
(A-E) Boxplot graphs depicting the median (IQR) of immunomodulators that comprise the topmost number of significant pairwise comparisons between groups. (A-C) RANTES, IL-1RA, and IL-10, each show 6 significant group-to-group comparisons. (B, C) PAS-highFIB-highGCX vs naïve-noFIB-highGCX, naïve-noFIB-noGCX, and naïve-noFIB-lowGCX are the 3 group-to-group comparisons with the topmost number of significantly differently abundant immunomodulators and have two proteins in common between them: (B) IL-1RA and (C) IL-10 Amongst the comparisons between naïve-highFIB-highGCX vs naïve-noFIB-noGCX, naïve-noFIB-highGCX, and naïve-noFIB-lowGCX, one protein was in common: (D) MIP-1β. (B, E, F) Out of 4 (CTACK, IL-1RA, IP-10, and sCD40L), 3 immunomodulators that show the most significant (lowest FDR) pairwise comparisons between groups, (B) IL-1RA, (E) IP-10, and (F) sCD40L. FDR-adjusted q-value symbols: *** FDR<0.001; ** FDR<0.01; * FDR≤0.05.
Fig 5
Fig 5. Pathway analysis shows predicted inhibition of pro- and anti-inflammatory pathways in PAS-highFIB-highGCX when compared to naïve-noFIB-GCX samples.
(A) Heatmap of “activation z-scores” for the pathways with the strongest predictions based on the directionality of the molecules within the comparison groups. Signaling pathways with activation z-scores of < -2 (purple) are predicted to be inactive or suppressed; activation z-scores of > 2 (orange) are predicted to be activated; squares with grey dots mark pathways with weak prediction z-scores between -2 and 2. Yellow boxes highlight PAS-highFIB-highGCX versus naïve-noFIB-highGCX, which had 4 predictions with activation z-scores < -2. (B) Four-way Venn diagram depicting the representation of immunomodulators found to be differentially abundant between PAS-Fiber-GCX groups in the following IPA signaling pathways: “Pathogen-Induced Cytokine Storm” (black oval), “Wound Healing” (yellow oval), “Communication between Innate and Adaptive Immune Cells” (cyan oval), and Interleukin-10 signaling (magenta oval). (C-G) Boxplots depicting the median pg/ml (IQR) of IL-6 (C), IL-8 (D), IL-18 (E), IL-1α (F), and TNF (G). FDR-adjusted q-value symbols: *** FDR<0.001; ** FDR<0.01; * FDR≤0.05. Note: Kruskal-Wallis statistical analysis of IL-6 showed an unadjusted P = 0.031; however, none of the Dunn’s pwc FDR adjusted q values were <0.05).

References

    1. Ellis H. The clinical significance of adhesions: focus on intestinal obstruction. Eur J Surg Suppl. 1997;(577):5–9. Epub 1997/01/01. - PubMed
    1. Menzies D, Ellis H. Intestinal obstruction from adhesions‐‐how big is the problem? Ann R Coll Surg Engl. 1990;72(1):60–3. Epub 1990/01/01. ; PubMed Central PMCID: PMC2499092. - PMC - PubMed
    1. Moris D, Chakedis J, Rahnemai-Azar AA, Wilson A, Hennessy MM, Athanasiou A, et al.. Postoperative Abdominal Adhesions: Clinical Significance and Advances in Prevention and Management. J Gastrointest Surg. 2017;21(10):1713–22. Epub 2017/07/08. doi: 10.1007/s11605-017-3488-9 . - DOI - PubMed
    1. Gomez-Gil V, Pascual G, Garcia-Honduvilla N, Rodriguez M, Bujan J, Bellon JM. Characterizing omental adhesions by culturing cells isolated from a novel in vivo adhesion model. Wound Repair Regen. 2009;17(1):51–61. Epub 2009/01/21. doi: 10.1111/j.1524-475X.2008.00441.x . - DOI - PubMed
    1. Mockl L. The Emerging Role of the Mammalian Glycocalyx in Functional Membrane Organization and Immune System Regulation. Front Cell Dev Biol. 2020;8:253. Epub 20200415. doi: 10.3389/fcell.2020.00253 ; PubMed Central PMCID: PMC7174505. - DOI - PMC - PubMed

Publication types

MeSH terms