. 2025 Jan 2;66(1):12.
doi: 10.1167/iovs.66.1.12.

Chronic Jet Lag Disrupts Circadian Rhythms and Induces Hyperproliferation in Murine Lacrimal Glands via ROS Accumulation

Affiliations

Chronic Jet Lag Disrupts Circadian Rhythms and Induces Hyperproliferation in Murine Lacrimal Glands via ROS Accumulation

Shenzhen Huang et al. Invest Ophthalmol Vis Sci. .

Abstract

Purpose: Chronic jet lag (CJL) is known to disrupt circadian rhythms, which regulate various physiological processes, including ocular surface homeostasis. However, the specific effects of CJL on lacrimal gland function and the underlying cellular mechanisms remain poorly understood.

Methods: A CJL model was established using C57BL/6J mice. Extraorbital lacrimal glands (ELGs) were collected at 3-hour intervals for RNA extraction and high-throughput RNA sequencing. Circadian transcriptomic profiles were analyzed, and functional annotations were performed. Hydrogen peroxide levels and total antioxidant capacity in tear fluid were measured using chemometric assays. Immunofluorescence was used to assess cell proliferation, apoptosis, immune cell infiltration in ELGs, and reactive oxygen species (ROS) accumulation. The potential therapeutic effects of alpha-lipoic acid (ALA) on CJL-induced oxidative stress and pathological changes in ELGs were also investigated.

Results: CJL significantly disrupted locomotor activity, altered body temperature rhythms, and modified diurnal oscillations in ELGs. Transcriptomic analysis revealed extensive changes in rhythmic gene expression, phase shifts, and pathway clustering in response to CJL. The disruption of the core circadian clock transcription was associated with ELG hyperproliferation and increased ROS accumulation. tert-Butyl hydroperoxide promoted ELG cell proliferation, and ALA effectively reduced ROS levels and mitigated CJL-induced hyperproliferation.

Conclusions: These findings uncover novel molecular pathways affected by CJL and highlight the potential of antioxidant therapies, such as ALA, in preserving ocular surface health under conditions of circadian rhythm disruption.


Conflict of interest statement

Disclosure: S. Huang, None; W. Zhang, None; M. Ba, None; S. Xuan, None; D. Huang, None; D. Qi, None; X. Pei, None; D. Lu, None; Z. Li, None

Figures

Figure 1.
Figure 1.
Experimental design and analytical flow. (A) A schematic representation of CJL protocol. Mice were subjected to an 8-hour phase advance on Mondays and an 8-hour phase delay on Thursdays over 12 weeks to simulate CJL. The treatment groups included NC, CJL, NC+t-BHP, and CJL+ALA. (B) Bioinformatics and validation of ELG transcript analysis. ELG tissues were collected at eight ZT points (ZT0, ZT3, ZT6, ZT9, ZT12, ZT15, ZT18, and ZT21) from both the NC and CJL-treated groups. Additionally, tissues were collected at four ZT points (ZT0, ZT6, ZT12, and ZT18) from the NC+t-BHP and CJL+ALA groups. The collected samples underwent comprehensive analyses, including the assessment of physiological parameters, transcriptome profiling, and functional and histological evaluations.
Figure 2.
Figure 2.
CJL treatment disrupts physiological parameters and reduces tear secretion in mice. (A) Changes in weight of mice treated with NC and CJL. N = 24 individual mice per group. (B, C) Water intake (B) and pellet intake (C) in NC and CJL-treated mice. Six cages were used for alternate testing, with each cage containing six mice. (DG) Locomotor activity (D, E) and core body temperature (F, G) of NC and CJL-treated mice during day (ZT0–Z12) and night (ZT12–ZT24). N = 3 mice per group. (H) Photograph of the mouse tear secretion test. (I) Mouse tear secretion in NC and CJL-treated mice at ZT0, ZT6, ZT12, and ZT18. N = 6 mice per group at each ZT. (J) ELG cell size in NC and CJL-treated groups at ZT0, ZT6, ZT12, and ZT18. N = 3 mice per group at each ZT. (K) Representative immunohistochemical images showing ELG cell size in NC and CJL-treated mice at ZT6. Scale bar: 20 µm. *P < 0.05, **P < 0.01, ***P < 0.001; ns, not significant.
Figure 3.
Figure 3.
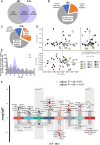
CJL treatment alters the transcriptomic profile of mouse ELGs, highlighting significant differential gene expression. (A) Venn diagram displaying the intersection of gene sets derived from RNA-seq analysis of ELGs in NC and CJL-treated mice. N = 24 individual mice per group. (B, C) Representation of the transcriptome profile in ELGs of NC mice (B) and CJL-treated mice (C), displayed through pie charts. N = 24 individual mice per group. (D) PCA scatterplot highlighting the segregation of NC and CJL-treated mice across PC1, PC2, and PC3 dimensions. Three mice were analyzed per group at different ZTs. (E) Distribution of peak gene numbers observed in ELGs of NC and CJL-treated mice at various ZTs. Three mice were sampled per group across the different ZTs. (F) Visualization of DEGs between ELGs of NC and CJL-treated mice via a volcano plot. The x-axis represents the ZTs, and the y-axis indicates the fold change (FC). Red and gray dots signify adjusted P < 0.01 and P ≥ 0.01 genes, respectively. N = 24 individual mice per group.
Figure 4.
Figure 4.
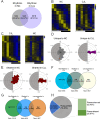
CJL treatment disrupts circadian gene expression in ELGs, leading to phase shifts and loss of rhythmicity. (A) Venn diagram illustrating the proportions of unique and shared rhythmic genes in ELGs between NC and CJL treatments. N = 24 individual mice per group. (B, C) Heatmaps displaying the oscillatory expression patterns of shared rhythmic genes in NC ELGs (B) and CJL-treated ELGs (C) at different ZTs. The heatmaps depict changes in rhythmic gene expression profiles across eight time points within a 24-hour cycle for NC (left in B, right in C) and CJL-treated (right in B, left in C) ELGs. Yellow indicates high gene expression, and blue indicates low gene expression, normalized within ±2. (D, E) Phase analysis of oscillatory genes unique to NC ELGs (left in D), CJL-treated ELGs (right in D), or shared between NC and CJL-treated ELGs (E). Gray shading represents dark cycles. N = 24 individual mice per group. (F) Venn diagram showing the overlap of rhythmic genes in NC ELGs with non-rhythmic genes and genes expressed at low levels in CJL-treated ELGs. N = 24 individual mice per group. (G) Venn diagram illustrating the overlap of rhythmic genes in CJL-treated ELGs with non-rhythmic genes and genes expressed at low levels in NC ELGs. N = 24 individual mice per group. (H) Pie charts depicting the proportional changes in phase shifts of rhythmic genes in NC and CJL-treated ELGs. N = 24 individual mice per group.
Figure 5.
Figure 5.
CJL treatment induces significant phase shifts and disrupts circadian rhythm pathway clustering in mouse ELG. (A) Phase shifts for significantly phase-clustered pathways (Q < 0.05) of circadian rhythm genes in mouse ELGs. (B, C) Phase-clustered REACTOME Biological Oxidations pathways in NC mouse ELGs (B) and CJL-treated mouse ELGs (C). Individual gene names are depicted where space permits, with larger font sizes indicating greater contribution to the overall phase clustering of a pathway.
Figure 6.
Figure 6.
CJL alters circadian gene clustering and disrupts key KEGG pathways in mouse ELGs. (A, B) Z-scores of temporal gene expression for distinct enriched cluster 1, unique to NC and CJL-treated ELGs, are presented alongside the top 10 KEGG pathways identified for each condition. (C, D) Z-scores of temporal gene expression for distinct enriched cluster 2, unique to NC and CJL-treated ELGs, are shown, accompanied by the top 10 KEGG pathways for each condition. (E, F) Z-scores of temporal gene expression for distinct enriched cluster 3, unique to NC and CJL-treated ELGs, are illustrated, along with the top 10 KEGG pathways identified for each condition. (G, H) Z-scores of temporal gene expression for distinct enriched cluster 4, unique to NC and CJL-treated ELGs, are displayed, with the corresponding top 10 KEGG pathways for each condition. Each analysis includes data from N = 3 individual mice per group at different ZT points.
Figure 7.
Figure 7.
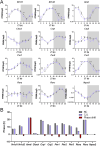
CJL disrupts circadian transcription of core clock genes in murine ELGs, inducing significant phase shifts. (A) The effects of CJL treatment on circadian transcription of canonical clock genes in murine ELGs. Expression patterns of 12 core clock genes, including Nr1d1 (also known as REV-ERBα), Nr1d2 (also known as REV-ERBβ), Clock, Per1, Per2, Per3, Arntl (also known as Bmal1), Cry1, Cry2, Npas2, Rora, and Rorc, over a 24-hour cycle in both NC and CJL groups of ELGs. The x-axis represents the sampled time points, and the y-axis shows gene expression levels at specific ZTs. Gray shading indicates dark cycles. The study included three animals per sampling time, sampled every 3 hours, with statistical significance indicated by *P < 0.05, **P < 0.01, and ***P < 0.001 between groups at each time point. Arntl (NC ELGs: F = 61.910, P < 0.001; CJL-treated ELGs: F = 50.884, P < 0.001), Clock (NC: F = 4.833, P < 0.01; CJL: F = 19.341, P < 0.001), Cry1 (NC: F = 22.234, P < 0.001; CJL: F = 20.518, P < 0.001), Cry2 (NC: F = 8.705, P < 0.001; CJL: F = 12.071, P < 0.001), Npas2 (NC: F = 13.768, P < 0.001; CJL: F = 21.612, P < 0.001), Per1 (NC: F = 9.476, P < 0.001; CJL: F = 7.688, P < 0.001), Per2 (NC: F = 115.864, P < 0.001; CJL: F = 60.760, P < 0.001), Per3 (NC: F = 112.806, P < 0.001; CJL: F = 169.501, P < 0.001), Rora (NC: F = 1.981, P > 0.05; CJL: F = 7.754, P < 0.001), Rorc (NC: F = 16.346, P < 0.001; CJL: F = 87.852, P < 0.001), Nr1d1 (NC: F = 131.634, P < 0.001; CJL: F = 113.192, P < 0.001), and Nr1d2 (NC: F = 107.188, P < 0.001; CJL: F = 67.203, P < 0.001). (B) Phases and phase shifts of 12 core circadian clock genes in the ELGs of NC and CJL-treated mice. The phases of 12 core circadian clock genes were determined using the JTK_CYCLE algorithm. To evaluate the phase shifts induced by CJL treatment, the phase values of the core clock genes in the CJL group were subtracted from the corresponding phase values of the same genes in the NC group. This analysis enabled a direct comparison of phase alterations in core clock genes between the two treatment conditions, highlighting the impact of CJL on the temporal coordination of circadian gene expression.
Figure 8.
Figure 8.
CJL promotes cell proliferation and apoptosis in mouse ELGs by disrupting cell cycle and apoptosis-related genes. (A) KEGG pathway enrichment analysis of DEGs between the NC and CJL-treated groups in mouse ELGs (Q < 0.05). (B) GSEA enrichment plots showing the activation of cell cycle–associated pathways in CJL-treated mouse ELGs. (CE) Heatmaps of diurnal expression for cell cycle (C), cell proliferation (D), and cell apoptosis (E) between the NC and CJL-treated mouse ELGs. (FI) Representative images and quantification of Ki67 (F, H) and TUNEL (G, I) fluorescence in NC and CJL-treated mouse ELGs. Scale bar: 20 µm.***P < 0.001.
Figure 9.
Figure 9.
CJL increases oxidative stress and DNA damage in mouse ELGs by elevating ROS and γ-H2Ax levels. (A) Heatmaps show daily gene expression patterns of ROS-responsive genes, comparing the NC group with the CJL-treated group in murine ELGs. (B) KEGG pathway enrichment analysis of ROS-responsive genes between the NC and CJL-treated groups in mouse ELGs (Q < 0.05). (C) H2O2 levels of the TF at ZT6 and ZT18 between the NC and CJL-treated groups. ***P < 0.001. (D) Total antioxidant capacity in the TF at ZT6 and ZT18 in the NC and CJL-treated groups. ***P < 0.001. (E, F) Representative images and quantifications of ROS levels at ZT6 and ZT18 in NC and CJL-treated mouse ELGs. Scale bar: 50 µm. ***P < 0.001. (G, H) Representative images and quantifications of γ-H2Ax levels at ZT6 and ZT18 in NC and CJL-treated mouse ELGs. Scale bar: 20 µm. *P < 0.05, ***P < 0.001.
Figure 10.
Figure 10.
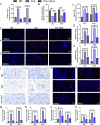
CJL alters the immune transcriptome and induces hyperinflammation in ELGs. (A) Heatmaps displaying daily gene expression patterns of immune-related DEGs in the ELGs of NC and CJL-treated mice, highlighting changes in immune transcriptome dynamics. (B) KEGG pathway enrichment analysis of immune-related DEGs between the NC and CJL-treated groups, identifying significantly enriched pathways (Q < 0.05). (C, D) Representative images and quantitative analysis of CD4+ T cells at ZT18 in NC and CJL-treated mouse ELGs, showing significant increases in CD4+ T cell infiltration following CJL treatment. Scale bar: 20 µm. ***P < 0.001. (E, F) Representative images and quantitative analysis of CD8+ T cells at ZT18 in NC and CJL-treated mouse ELGs, demonstrating elevated infiltration of CD8+ T cells in CJL-treated ELGs. Scale bar: 20 µm. ***P < 0.001. (G, H) Representative images and quantitative analysis of CD19+ B cells at ZT18 in NC and CJL-treated mouse ELGs, indicating increased B-cell infiltration after CJL treatment. Scale bar: 20 µm. **P < 0.01. (I, J) Representative images and quantitative analysis of γδ+ T cells at ZT18 in NC and CJL-treated mouse ELGs, highlighting a significant rise in γδ+ T-cell infiltration in response to CJL. Scale bar: 20 µm. **P < 0.01
Figure 11.
Figure 11.
t-BHP-induced oxidative stress promotes proliferation and immune cell infiltration in mouse ELGs. (A) Quantifications of ROS levels at ZT6 and ZT18 in NC and t-BHP–treated mouse ELGs, showing significantly elevated ROS levels in t-BHP–treated tissues. ***P < 0.001. (B) Representative images of ROS levels at ZT18 in NC and t-BHP–treated mouse ELGs, highlighting the oxidative stress induced by t-BHP. Scale bar: 50 µm. (C) Quantitative analysis of TUNEL fluorescein staining in mouse ELGs treated with PBS and 2-mM/kg t-BHP at ZT6 and ZT18, demonstrating increased apoptosis in t-BHP–treated tissues. **P < 0.01. (D) Quantitative analysis of Ki67 fluorescein staining in mouse ELGs treated with PBS and 2-mM/kg t-BHP at ZT6 and ZT18, indicating enhanced cellular proliferation in response to t-BHP. ***P < 0.001. (EH) Quantitative analysis of CD4+, CD8+, and γδ+ T cells and CD19+ B cells in mouse ELGs following treatment with PBS and 2-mM/kg t-BHP at ZT6 and ZT18. t-BHP treatment significantly increased immune cell infiltration. **P < 0.01, ***P < 0.001.
Figure 12.
Figure 12.
ALA reduces ROS levels, inhibits hyperproliferation, and suppresses hyperinflammation in mouse ELGs. (A) Levels of H2O2 in the TF at ZT6 and ZT18 from the NC, CJL, and CJL+ALA groups. Significant reductions in H2O2 levels were observed in the CJL+ALA group compared to CJL alone. ***P < 0.001. (B) Total antioxidant capacity of TF at ZT6 and ZT18 from the NC, CJL, and CJL+ALA groups, showing restoration of antioxidant capacity in the CJL+ALA group. ***P < 0.001. (C, D) Representative images and quantifications of ROS levels at ZT6 and ZT18 in NC, CJL-treated, and CJL+ALA-treated mouse ELGs. ALA treatment significantly reduced ROS levels compared to CJL alone. Scale bar: 20 µm. ***P < 0.001. (E, F) Representative images and quantifications of TUNEL fluorescent staining in NC, CJL-treated, and CJL+ALA-treated mouse ELGs, indicating apoptotic cells. ALA treatment markedly decreased TUNEL-positive cells. Scale bar: 20 µm. ***P < 0.001. (G, H) Representative images and quantifications of Ki67 staining demonstrating cell proliferation in the NC, CJL-treated, and CJL+ALA-treated ELGs. ALA significantly inhibited hyperproliferation. ***P < 0.001. Scale bar: 20 µm. (IL) Representative images of CD4+ T cells (I), CD8+ T cells (J), CD19+ B cells (K), and γδ+ T cells (L) in the NC, CJL-treated, and CJL+ALA-treated mouse ELGs. ALA treatment reduced T-cell infiltration associated with CJL. Scale bar: 20 µm. (MP) Quantification of CD4+ T cells (M), CD8+ T cells (N), CD19+ B cells (O), and γδ+ T cells (P) in the NC, CJL-treated, and CJL+ALA-treated mouse ELGs, showing significant decreases in immune cell infiltration after ALA treatment. *P < 0.05, **P < 0.01, ***P < 0.001.
Figure 13.
Figure 13.
Schematic representation of the mechanisms underlying CJL-induced disruptions in lacrimal gland function. CJL induces circadian rhythm disruptions, leading to the accumulation of ROS in the ELGs. This excessive ROS buildup results in ELG injury and cellular hyperproliferation, compromising tear-film homeostasis. Treatment with ALA helps restore redox balance, reduces ROS levels, mitigates ELG injury, and ultimately improves ocular surface health. (This figure was created using the Servier Medical ART: SMART (smart.servier.com) according to a Creative Commons Attribution 3.0).

Similar articles

Cited by

References

    1. Patke A, Young MW, Axelrod S.. Molecular mechanisms and physiological importance of circadian rhythms. Nat Rev Mol Cell Biol . 2020; 21(2): 67–84. - PubMed
    1. Fagiani F, Di Marino D, Romagnoli A, et al. .. Molecular regulations of circadian rhythm and implications for physiology and diseases. Signal Transduct Target Ther . 2022; 7(1): 41. - PMC - PubMed
    1. Sack RL. Clinical practice. Jet lag. N Engl J Med . 2010; 362(5): 440–447. - PubMed
    1. Waterhouse J, Reilly T, Atkinson G, Edwards B.. Jet lag: trends and coping strategies. Lancet . 2007; 369(9567): 1117–1129. - PubMed
    1. Filipski E, Delaunay F, King VM, et al. .. Effects of chronic jet lag on tumor progression in mice. Cancer Res . 2004; 64(21): 7879–7885. - PubMed

LinkOut - more resources