

Genome-wide association neural networks identify genes linked to family history of Alzheimer's disease
- PMID: 39775791
- PMCID: PMC11707606
- DOI: 10.1093/bib/bbae704
Genome-wide association neural networks identify genes linked to family history of Alzheimer's disease
Abstract
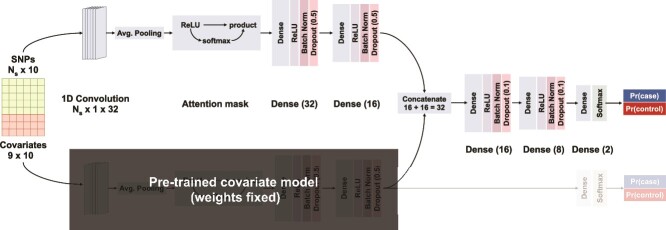
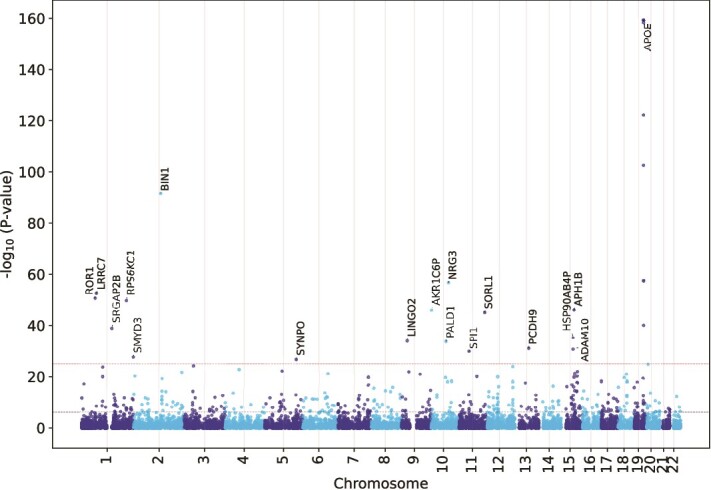
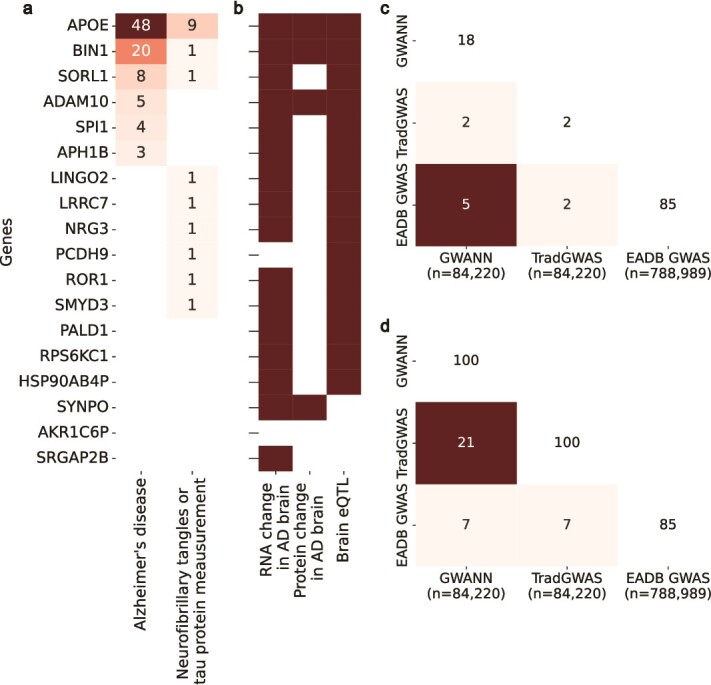
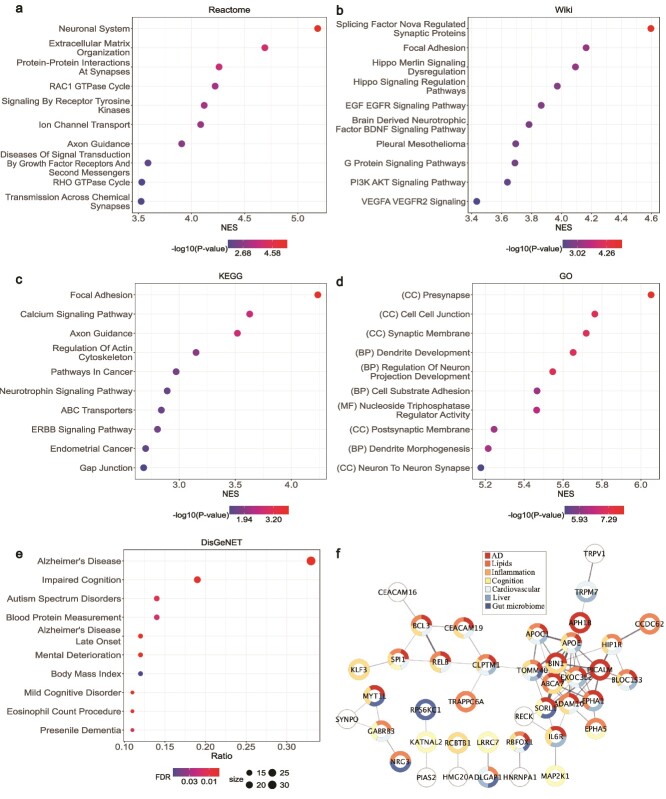
Augmenting traditional genome-wide association studies (GWAS) with advanced machine learning algorithms can allow the detection of novel signals in available cohorts. We introduce "genome-wide association neural networks (GWANN)" a novel approach that uses neural networks (NNs) to perform a gene-level association study with family history of Alzheimer's disease (AD). In UK Biobank, we defined cases (n = 42 110) as those with AD or family history of AD and sampled an equal number of controls. The data was split into an 80:20 ratio of training and testing samples, and GWANN was trained on the former followed by identifying associated genes using its performance on the latter. Our method identified 18 genes to be associated with family history of AD. APOE, BIN1, SORL1, ADAM10, APH1B, and SPI1 have been identified by previous AD GWAS. Among the 12 new genes, PCDH9, NRG3, ROR1, LINGO2, SMYD3, and LRRC7 have been associated with neurofibrillary tangles or phosphorylated tau in previous studies. Furthermore, there is evidence for differential transcriptomic or proteomic expression between AD and healthy brains for 10 of the 12 new genes. A series of post hoc analyses resulted in a significantly enriched protein-protein interaction network (P-value < 1 × 10-16), and enrichment of relevant disease and biological pathways such as focal adhesion (P-value = 1 × 10⁻⁴), extracellular matrix organization (P-value = 1 × 10⁻⁴), Hippo signaling (P-value = 7 × 10⁻⁴), Alzheimer's disease (P-value = 3 × 10⁻⁴), and impaired cognition (P-value = 4 × 10⁻³). Applying NNs for GWAS illustrates their potential to complement existing algorithms and methods and enable the discovery of new associations without the need to expand existing cohorts.
Keywords: Alzheimer’s disease; GWAS; UK Biobank; artificial intelligence; machine learning; neural networks.
© The Author(s) 2025. Published by Oxford University Press.
Figures
References
-
- Gauthier S, Rosa-Neto P, Morais JA. et al. World alzheimer report 2021: journey through the diagnosis of dementia. 2021.
MeSH terms
Grants and funding
- National Institute for Health Research (NIHR) Oxford Biomedical Research Centre (BRC)
- H2020-SC1-DTH-2018-1/Virtual Brain Cloud from European Commission
- 0010659/John Fell Foundation
- Janssen Research and Development
- King Abdulaziz University and the University of Oxford Centre for Artificial Intelligence in Precision Medicine (KO-CAIPM)
LinkOut - more resources
Full Text Sources
Medical
Miscellaneous
