. 2025 Feb 3;222(2):e20240592.
doi: 10.1084/jem.20240592. Epub 2025 Jan 7.

Spatiotemporal dynamics of fetal liver hematopoietic niches

Affiliations

Spatiotemporal dynamics of fetal liver hematopoietic niches

Márcia Mesquita Peixoto et al. J Exp Med. .

Abstract

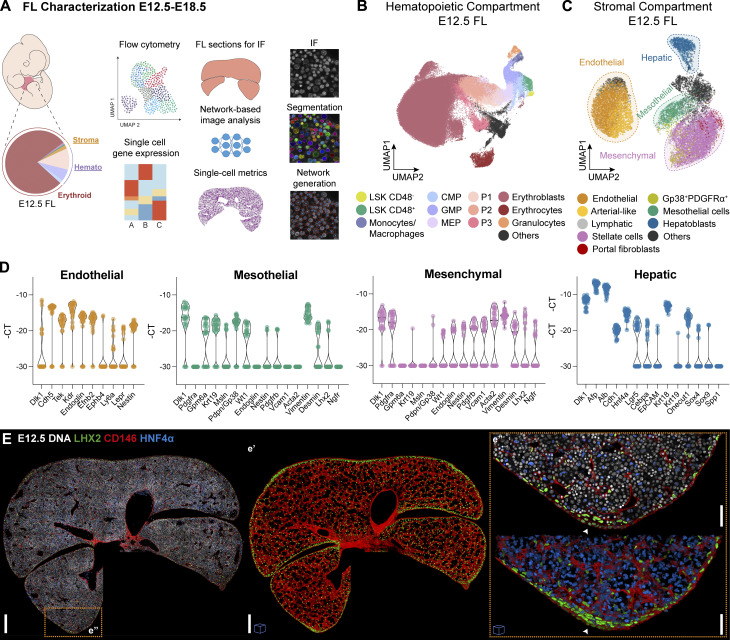
Embryonic hematopoietic cells develop in the fetal liver (FL), surrounded by diverse non-hematopoietic stromal cells. However, the spatial organization and cytokine production patterns of the stroma during FL development remain poorly understood. Here, we characterized and mapped the hematopoietic and stromal cell populations at early (E12.5-14.5) FL stages, revealing that while hepatoblasts were the primary source of hematopoietic growth factors, other stromal cells-including mesenchymal, mesothelial, and endothelial cells-also contributed to this signaling network. Using a dedicated image analysis pipeline, we quantified cell distances to tissue structures and defined neighbor relationships, uncovering that different hematopoietic progenitors exhibit distinct preferences for neighboring stromal cells and show developmental changes in spatial distribution. Notably, our data suggest that the sub-mesothelium region plays a prominent role in early fetal hematopoiesis. This approach offers a valuable tool for studying complex cellular interactions in biological systems, providing new insights into hematopoietic niche organization during development.


Conflict of interest statement

Disclosures: The authors declare no competing interests exist.

Figures

Figure 1.
Figure 1.
The non-hematopoietic compartment of the FL comprises endothelial, mesothelial, mesenchymal, and hepatic cells. (A) Schematic representation of the devised strategy for the analysis of the FL from E12.5 to E18.5. (B) UMAP analysis of FC data of E12.5 FLs stained with the surface markers Ter119, CD45, CD71, Gr1, CD11b, KIT, Sca-1, CD16/32, CD34, CD150, and CD48. See gating strategy used in Fig. S1 A. (C) UMAP analysis of FC data of Ter119CD45CD71KIT cells from E12.5 FLs stained with the surface markers CD146, CD31, Gp38, CD54, CD51, Thy1.2, PDGFRα, NG2, ALCAM, Sca-1, E-Cadh, and EpCAM that identify the four major populations highlighted by dashed circles: endothelial, hepatic, mesothelial, and mesenchymal. See the gating strategy used in Fig. S1 B. (D) Violin plots of single-cell gene expression analysis of lineage associated transcripts of sorted endothelial (CD31+CD146+, orange), mesothelial (CD31PDGFRαGp38+, green), mesenchymal (CD31Gp38PDGFRα+, pink), and hepatic (CD31Gp38PDGFRαEpCAME-Cadh+, blue) cells from E12.5 FLs. Each dot represents a cell. (E) Representative single-stack IF of an E12.5 FL section with DNA (white), LHX2 (green), CD146 (red), and HNF4α (blue). Scale bar, 200 μm. (e′) Insert e′ shows a 3D view (40 μm projection) of the same FL section showing only CD146 and LHX2. (e″) Insert e″ represents enlarged single-stacks and a 3D view (40 μm projection) of the selected regions. White arrowheads point to MCs. Images with cubes are 3D projections. Scale bars, 50 μm.
Figure S1.
Figure S1.
Discrimination of the FL’s hematopoietic and stromal compartments. Related to Fig. 1. (A) Gating strategy used for the analysis of the hematopoietic compartment of E12.5 FLs using the surface markers Ter119, CD45, CD71, Gr1, CD11b, KIT, Sca1, CD16/32, CD34, CD150, and CD48. Related to Fig. 1 B. (B) Gating strategy used for the analysis of Ter119CD45CD71KIT FL cells using the surface markers CD146, CD31, Gp38, CD54, CD51, Thy1.2, PDGFRα, NG2, ALCAM, Sca1, E-Cadh, and EpCAM. Represented is the profile of E18.5. The same strategy was applied to all time points. (C) Distribution profile of live non-hematopoietic cells at E12.5, E14.5, and E18.5 as obtained from FC data. (D) UMAP analysis of FC data of Ter119CD45CD71KIT cells from E14.5 and E18.5 FLs following the gating strategy represented in B. Color code as indicated in B. (E and F) Heatmap of single cell multiplex qPCR in sorted mesenchymal (E) and hepatic (F) cells of E12.5 and E18.5 FLs. Each column represents a single cell, and it is color-coded according to time point and cell type. Cells were sorted as indicated in B. Gene expression was normalized to Actb and Gapdh, and unsupervised hierarchical clustering was performed.
Figure 2.
Figure 2.
Discrimination of the FL’s stromal compartments in situ. (A) Representative 3D view (30 μm projection) IF of an E13.5 FL section with LHX2 (green), CD146 (red), and PDGFRα (blue). (B) Representative 3D view (50 μm projection) IF of an E16.5 FL section with Desmin (green) and CD146 (red). (C) Representative 3D view (57 μm projection) IF of an E18.5 FL section with Desmin (green), CD146 (red), and PDGFRα (blue). (D) Representative 3D view (10 μm) IF of an E18.5 FL section with DNA (white), NG2 (green), αSMA (red), and EpCAM (blue). (d′) The insert d′ shows the selected region with the channels separated. (E) Representative 3D view (20 μm projection) IF of an E12.5 FL section with DNA (white) and NG2 (green). (F) Representative 3D view (50 μm projection) IF of an E18.5 FL section with ALCAM (green) and CD146 (red). (G) Representative 3D view (50 μm projection) IF of an E12.5 FL section with DNA (white), Gp38 (red), and CD146 (green). (H) Representative 3D view (30 μm projection) IF of an E14.5 FL section with CD146 (red), WT1 (green), and PDGFRα (blue). (I) Single stack IF of an E13 FL section with DNA (white), LHX2 (green), CD146 (red), and PDGFRα (blue). (J) Single stack IF of an E12.5 FL section with DNA (white), CD146 (red), and Gp38 (blue). (K) 3D view (50 μm projection) IF of an E12.5 FL section with CD146 (red), LHX2 (green), and PDGFRα (blue). (L) Representative single stack IF of an E18.5 FL section with DNA (white) and E-Cadh (red). Arrowheads point to the mesothelium. Scale bars, 100 μm. CV, central vein; PV, portal vein. Images with cubes are 3D projections.
Figure 3.
Figure 3.
Discrimination of CD45 + , KIT + , or CD45 + KIT + hematopoietic cells in cells in FL. (A) Representative single-stack IF of an E12.5 FL section with DNA (white), Ter119, CD71 (green), CD45 (red), and KIT (blue). Scale bar, 200 μm. (a′ and a″) Inserts a′ and a″ represent enlarged 3D views (10 μm projections) of the selected regions. Scale bars: 100 μm (a′), 20 μm (a″). Blue (upper), red (middle), and purple (lower) arrowheads indicate an example of a KIT+, CD45+, or KIT+CD45+ (DP) cell, respectively. Images with cubes are 3D projections.
Figure S2.
Figure S2.
Composition of the CD45 + , DP, and KIT + compartments. Related to Fig. 3. (A and B) Representative gating strategy (A) and UMAP analysis (B) showing the cell types that are included in CD45+ (CD45+KIT), KIT+ (CD45KIT+), and DP (CD45+KIT+) populations at E12.5. (C) Percentage of the progenitor cell types within DP cells (top) and KIT+ cells (bottom) at E12.5 (left) or E14.5 (right).
Figure 4.
Figure 4.
Images analysis workflow. (A) Segmentation pipeline. FL multichannel images are cut into small pieces using Saucisson (1), individual tiles are segmented based on the DAPI signal using CellPose (2), and then reassembled into the original shape (3). On the left, a representative single-stack IF of an E12.5 FL section with DAPI (white), LHX2 (green), KIT (blue), and CD45 (red) is shown to demonstrate the pipeline. Scale bar, 200 μm. (a′) The inset a′ represents an enlarged view of the selected region. Scale bar, 10 μm. (B) Cell type classification pipeline. In the case of nuclear staining (as for LHX2, green), cells are classified according to a threshold set on the average signal intensity inside the nuclei mask using Griottes (4). For membrane staining (e.g., for CD45/red, KIT/blue), cells are classified using a neural network (5). Individual tiles (80 × 80 or 120 × 120 pixels) are generated for each detected nucleus and centered around its geometric center, as represented on the left. Scale bars, 5 μm. Representative images of single cells classification and respective classification confidence (positive cells in red and negative in black) are shown in the middle panel. A representative example of a small tile post-classification is presented on the right, displaying segmented cells (in white) and cells positive for LHX2 (green), CD45 (red), and KIT (blue) (same region as shown in a′). Scale bars, 10 μm. (C) For FL network generation and spatial analysis, Coloriage is used to remove or highlight specific regions of the FL sections (6). Griottes is used to represent the cells in a dot plot and to plot the contacts between cells (7). The same region as represented in a′ is shown, with the classification color-coded in the dots, and the neighborhood interactions represented by the links. Scale bar, 10 μm.
Figure S3.
Figure S3.
Validation and quality control of the image analysis. Related to Fig. 4. (A and B) Validation of KIT (A) and CD45 (B) classification. Representative images of single-cell classification and respective classification confidence (positive cells in red and negative in black). The red arrowhead indicates a false positive, corresponding to an AF cell. (a′ and b′) Accuracy of the classification during network training on training and validation datasets. (a″ and b″) Confusion matrix on the validation dataset. (C) Single stack IF of an E12.5 FL section with DNA (white), LHX2 (green), CD45 (red), and KIT (blue) to highlight a region where AF cells (nucleated erythrocytes) can be seen inside a blood vessel (represented by the dashed line). Scale bar, 25 μm. (D) AF cells are manually classified as positive and negative to train a neural network, so they can be later removed from the analysis. (d′) Representative images of single-cell classification and respective classification confidence (positive cells in red and negative in black). (E) DNA channel of the tile depicted in C overlaid with the classification before (top) and after (bottom) removing AF cells. (F) FL section (same input image as in Fig. 3) before and after removing regions manually selected using Coloriage, and AF cells, highlighted on the left panel at orange and olive green, respectively. (G and H) Vessel’s network segmentation. (G) Representative single stack IF of an E12.5 FL section with DNA (white), CD45 (red), KIT (blue), and CD146 (green). Scale bar, 200 μm. The dashed region represents a region to exclude from the analysis using the tool Coloriage due to lower staining quality in the CD146 channel. (g′) Insert g′ shows an enlarged view of the selected region. Scale bar, 100 μm. The dashed region represents a manual selection (in FIJI) corresponding to the mesothelial layer (CD146+) to exclude from the analysis. (H) Mask of CD146 signal obtained in FIJI (left) and mask of the vessels’ network obtained by manual exclusion of the CD146 signal in the mesothelial layer (right).
Figure 5.
Figure 5.
YS and IE progenitors accumulate near the periphery at E12.5 and are overall preferentially in contact with hepatoblasts, but not with stellate or endothelial cells. (A) Dot plot representation of CD45+ (red), KIT+ (blue), DP (purple), and LHX2+ (green) cells distribution of an E12.5 FL representative section. (a′) Experimentally observed (“real”) versus random LHX2+ cells distribution (green), and their corresponding distance to the periphery profile (green curve) cells in comparison with a random distribution (dashed line, average from 10 random distributions generated, with standard deviation in gray). The minimum Euclidean distance between each cell in the network and the cells marked as “periphery” is computed and the minimal distance for each data point is considered. (B) Percentage of hematopoietic cells recovered and analyzed by FC (n = 9) versus quantified by imaging of FL sections (n = 13, 521,423 total cells analyzed). (C) Percentage of stromal cells recovered and analyzed by FC (n = 3) versus quantified by imaging of FL sections (LHX2, n = 6, 608,788 total cells analyzed, HNF4α, n = 6, 605,984 total cells analyzed, and FLK1, n = 3, 97,602 total cells analyzed). Endo (CD146+CD31+), Hepa (CD31Gp38PDGFRαEpCAME-Cadh+), and Mesen (CD31Gp38PDGFRα+). (B and C) Statistical analysis was calculated using two-way ANOVA, followed by Šídák’s multiple comparisons test. (D) Distance to the periphery profile (normalized to random) of CD45+ (red, n = 13, 521,423 total cells analyzed), KIT+ (blue, n = 13, 521,423 total cells analyzed), DP (purple, n = 13, 521,423 total cells analyzed), LHX2+ (green; n = 6, 608,788 total cells analyzed), HNF4α+ (cyan, n = 6, 605,984 total cells analyzed) and FLK1+ (orange, n = 2, 97,602 total cells analyzed) of E12.5 FL sections. Curves indicate average ± SD. Statistical analysis was calculated at the peak of each curve using Welch's t test, between observed and random profiles. (E) Distance to the PS profile (normalized to random) of CD45+ (red, n = 11, 488,919 total cells analyzed), KIT+ (blue, n = 11, 488,919 total cells analyzed), DP (purple, n = 11, 488,919 total cells analyzed), LHX2+ (green; n = 6, 608,788 total cells analyzed), HNF4α+ (cyan, n = 6, 605,984 total cells analyzed) and FLK1+ (orange, n = 2, 97,602 total cells analyzed) cells of E12.5 FL sections. Curves indicate average ± SD. Statistical analysis was calculated at 10–40 μm using Welch's t test, between observed and random profiles. (F–H) Spatial distribution of CD45+ (red), KIT+ (blue), and DP (purple) cells relative to LHX2+ (n = 3, 90.706 total cells analyzed, F), HNF4α+ (n = 3, 87,902 total cells analyzed, G) and CD146+ (n = 3, 60,050 total cells analyzed, H) cells. Plots show the distribution of each hematopoietic population after 10 rounds of randomization in gray (random). (I) Percentage of contacts (normalized to random) of CD45+ (red), KIT+ (blue), and DP (purple) cells with LHX2+ (n = 3, 90,706 total cells analyzed), HNF4α+ (n = 3, 87,902 total cells analyzed), and FLK1+ (n = 2, 97,602 total cells analyzed) stromal cells of E12.5 FLs. Bar plots indicate average ± SD. Statistical analysis was calculated using the Mann–Whitney test. n indicates the number of independent biological samples analyzed. *, P <0.05; **, P < 0.01; ***, P < 0.001; ****, P < 0.0001; ns, not significant.
Figure 6.
Figure 6.
Supportive hematopoietic cytokines are produced by multiple stromal populations. (A) Violin plots of single-cell gene expression analysis of hematopoietic cytokines in hepatic (CD31Gp38PDGFRαEpCAME-Cadh+, blue), mesothelial (CD31PDGFRαGp38+, green), mesenchymal (CD31Gp38PDGFRα+, pink) and endothelial (CD31+CD146+, orange) cells at E12.5. Each dot represents a cell. (B) Representative 3D view (25 μm projection) IF of an E12.5 FL section (Cxcl12-dsRed mice) with LHX2 (green), Cxcl12-dsRed (red) and CD146 (cyan). Red arrowheads point to a sub-mesothelium region with Cxcl12-dsRedbright cells, while green arrowheads indicate a region with Cxcl12-dsReddim cells. (b′) Insert b′ shows an enlarged single-stack view of the selected region. DNA is shown in white. Yellow arrowheads indicate cells with high expression of Cxcl12, co-staining with LHX2. White arrowheads indicate cells with low expression of Cxcl12, LHX2. Scale bars, 100 μm. (C) Representative single-stack IF of an E12.5 FL section (Cxcl12-dsRed mice) with DNA (white), LHX2 (green), Cxcl12-dsRed (red), and HNF4α (blue). Scale bar, 100 μm. (c′) Insert c′ shows an enlarged single-stack view of the selected region. Scale bar, 20 μm. (D) Quantification of LHX2+ and HNF4α+ cells within Cxcl12-dsRedbright+ and Cxcl12-dsReddim+ cells. (E) Quantification Cxcl12-dsRed cells with distinct signal intensities in LHX2+ and HNF4α+ stromal cells. (D and E) In total, six images from independent biological samples were analyzed, corresponding to a total of 241,647 cells. The specific n for each condition is indicated above the bars. (F) Representative single-stack IF of an E12.5 FL section (Kitl-dTomato mice) with DNA (white), HNF4α (green), Kitl-dTomato (red), and CD146 (cyan). (f′) Insert f′ shows an enlarged 3D view (20 μm projection) of the selected region. Scale bar, 100 μm. Red arrowhead indicates a region of the mesothelium with high expression of Kitl-tdTomato. (G) Representative 3D view (15 μm projection) IF of an E12.5 FL section (Kitl-dTomato mice) with PDGFRα (green), Kitl-dTomato (red), and CD146 (cyan). (g′ and g″) Inserts g′ and g″ show an enlarged 3D view (15 μm projection) or a single stack of the selected regions, respectively. DNA is shown in white (g″). The dashed line in g′ represents the mesothelium with no expression of Kitl-tdTomato. Scale bar, 100 μm. (H) Quantification of Kitl-dTomato+ cells in HNF4α+ cells. HNF4α+ classified cells from a single image (3D image, n = 1, 16,000 total cells) were selected and Kitl-dTomato+ cells were manually classified. n indicates the number of independent biological samples analyzed. Images with cubes are 3D projections.
Figure S4.
Figure S4.
Cytokines’ expression along development. Related to Fig. 6. (A) qRT-PCR analysis of the expression levels of hematopoietic cytokines in endothelial (Endo, CD31+CD146+), hepatic (Hepa, CD31Gp38PDGFRαEpCAME-Cadhhigh), mesothelial (Meso, CD31PDGFRαGp38+), and mesenchymal (Mesen, CD31Gp38PDGFRα+) cells in E12.5 (light blue), E14.5 (blue), and E18.5 (dark blue) FL cells (n = 3). (B) Violin plots of single-cell gene expression analysis of hematopoietic cytokines in hepatic (blue), mesothelial (green), mesenchymal (pink), and endothelial (orange) cells at E18.5. Each dot represents a cell. (C) 3D view (45 μm projection) IF of an E18.5 FL section with DNA (white) and CD45 (red). Scale bar, 100 μm. (D) 3D view IF of three E18.5 FL sections (30, 25, and 20 μm projections, from left to right) with DNA (white), NG2 (green) and CD45 (red). Scale bars, 100 μm. (E) 3D view (20 μm projection) IF covering the peripheral region of the liver (upper panel) or the parenchymal region (lower panel) with NG2 (green), CD45 (red), and CD11b (blue). Scale bar, 50 μm. (F) 3D view (20 μm projection) IF covering the peripheral region of the liver (upper panel) or the parenchymal region (lower panel) with NG2 (green), CD45 (red), and B220 (blue). Scale bar, 50 μm. (D–F) * represent central veins. The red arrows in D point to the mesothelial layer. (G) qRT-PCR analysis of the expression levels of hematopoietic cytokines in mesenchymal (Mesen, pink) or hepatic (Hepa, blue) cells of E12.5, E14.5, and E18.5 FL and endothelial (dark red) or CD51+CD106+ (yellow) cells of P7, P14, and P21 BM. For each cytokine, only the FL population with the highest expression levels is shown (n = 3). (H) Gating strategy used for the analysis of the stroma of P7, P14, and P21 BM using the surface markers CD51, CD31, and CD106. Representative profile of a P7 BM. The same strategy was applied to all time points. n indicates the number of independent biological samples analyzed. All bar plots indicate average ± SD.
Figure 7.
Figure 7.
At E14.5, opposite to YS-, IE-derived progenitors display a homogeneous distribution throughout the parenchyma in response to Cxcl12 levels. (A) Distance to the periphery profile (normalized to random) of CD45+ (red, n = 6, 557,370 total cells analyzed), KIT+ (blue, n = 6, 557,370 total cells analyzed), DP (purple, n = 6, 557,370 total cells analyzed), LHX2+ (green, n = 3, 320,278 total cells analyzed), and HNF4α+ (n = 3, 237,092 total cells analyzed) cells of E14.5 FLs. E12.5 data from Fig. 4 B is overlaid for comparison. Curves indicate average ± SD. Statistical analysis was calculated at the peak of each population using Welch's t test, between observed and random profiles at E14.5. (B and C) Spatial distribution of CD45+ (red), KIT+ (blue), DP (purple) cells relative to LHX2+ (n = 3, 320,278 total cells analyzed, B) and HNF4α+ (n = 3, 237,092 total cells analyzed, C). Statistical analysis was calculated using the Mann–Whitney test. (D) qRT-PCR analysis of the expression levels of the hematopoietic chemokine Cxcl12 in hepatic (CD31Gp38PDGFRαEpCAME-Cadh+/high, light gray), and mesenchymal (CD31Gp38PDGFRα+, dark gray) cells in E12.5, E14.5 and E18.5 FL cells (n = 3). (E) Representative 3D view (25 μm projection) IF of an E14.5 FL section (Cxcl12-dsRed mice) with HNF4α (green), Cxcl12-dsRed (red), and CD146 (cyan). Scale bar, 100 μm. (e′) Insert e′ shows an enlarged view of the selected region. Scale bar, 50 μm. (F) Mean fluorescence intensity (MFI) of CXCR4 in KIT+ (blue), and DP (purple) cells in E12.5, E14.5 FLs (n = 3). (G) Transwell migration assay of DP and KIT+ progenitors of E12.5 and E14.5 FL in response to the chemokine CXCL12a. Data are presented as the percentage of input progenitors that migrate to the bottom chamber (n = 3). (D–G) Statistical analysis was calculated using two-way ANOVA, followed by Šídák’s multiple comparisons test. n indicates the number of independent biological samples analyzed. *, P < 0.05; **, P < 0.01; ***, P < 0.001; ****, P < 0.0001; ns, not significant.
Figure S5.
Figure S5.
Image analysis of E14.5 FL sections. Related to Fig. 7. (A) Percentage of contacts (normalized to random) of CD45+ (red), KIT+ (blue), and DP (purple) cells with LHX2+ (n = 3, 320,278 total cells analyzed) and HNF4α+ (n = 3, 237,092 total cells analyzed) stromal cells of E14.5 FLs. Statistical analysis was calculated using Welch's t test. (B) Representative single-stack IF of an E14.5 FL section (Cxcl12-dsRed mice) with DNA (white), HNF4α (green), Cxcl12-dsRed (red), and CD146 (cyan). Scale bar, 200 μm. (b′ and b″) Inserts b′ and b″ show enlarged views of the selected regions. Scale bars, 50 μm. (C) Representative single-stack IF of an E14.5 FL section (Cxcl12-dsRed mice) with DNA (white), LHX2 (green), Cxcl12-dsRed (red), and CD146 (cyan). Scale bar, 200 μm. (c′) Insert c′ shows an enlarged 3D view (25 μm projection) of the selected region. Scale bars, 50 μm. (D) qRT-PCR analysis of the expression levels of the CXCL12 receptor (Cxcr4) in KIT+ (blue), and DP (purple) cells in E12.5, E14.5 FLs (n = 3). Statistical analysis was calculated using two-way ANOVA, followed by Šídák’s multiple comparisons test. All bar plots indicate average ± SD. n indicates the number of independent biological samples analyzed. *, P < 0.05, **, P < 0.01; ****, P < 0.0001.
Figure 8.
Figure 8.
CD48 LSK are not in close vicinity to hepatoblasts. (A) Experimental strategy to analyze LSK enriched for CD48 cells from Mds1CreERT2Rosa26YFP mice and gating strategy to analyze the phenotype of YFP+ cells. Frequencies ± SD of three independent FL analyzed from two independent experiments. (B) Representative single-stack IF of an E14.5 FL section (Mds1CreERT2YFP mice) with DNA (white), YFP (magenta), and LHX2 (green), HNF4α (cyan), or CD146 (orange). Scale bar, 30 μm. (C) Spatial distribution of YFP+ cells relative to LHX2+ (84 YFP+ cells analyzed), HNF4α+ (44 YFP+ cells analyzed), and CD146+ (58 YFP+ cells analyzed) cells. Statistical analysis was calculated using a t test one sample. *, P < 0.05; **, P < 0.01; ***, P < 0.001; ns, not significant.
Figure 9.
Figure 9.
Hepatoblasts and KITL alone are sufficient to expand FL LSK. (A) Image of a spheroid at day 6 (D6) of culture (upper image, brightfield) and representative single-stack IF of a D6 spheroid of a co-culture of E14.5 hepatoblasts and CD45+ FL cells; DNA (blue), E-Cadh (green), and CD45 (white). (B) Numbers of LSK cells recovered from spheroids after 2 (D2) and 4 (D4) days of culture. Cultures with three populations: hepatoblasts (CD31Gp38PDGFRαEpCAME-Cadh+ cells), mesenchymal cells (CD31Gp38PDGFRα+ cells), and MCs (CD31PDGFRαGp38+). ACK2 antibody was added on D0 of CD45+ cells co-cultured with hepatoblasts. (C) Numbers of CD45+ cells and LinKit+Sca-1 (LK) cells isolated from individual spheroids (n = 3). All bar plots indicate average ± SD. n indicates the number of independent biological samples analyzed. Statistical analysis was calculated using two-way ANOVA, followed by Tukey’s multiple comparison test. *, P < 0.05; **, P < 0.01; ***, P < 0.001; ****, P < 0.0001; ns, not significant.

References

    1. Baryawno, N., Przybylski D., Kowalczyk M.S., Kfoury Y., Severe N., Gustafsson K., Kokkaliaris K.D., Mercier F., Tabaka M., Hofree M., et al. . 2019. A cellular taxonomy of the bone marrow stroma in homeostasis and leukemia. Cell. 177:1915–1932.e16. 10.1016/j.cell.2019.04.040 - DOI - PMC - PubMed
    1. Breiteneder-Geleff, S., Soleiman A., Kowalski H., Horvat R., Amann G., Kriehuber E., Diem K., Weninger W., Tschachler E., Alitalo K., and Kerjaschki D.. 1999. Angiosarcomas express mixed endothelial phenotypes of blood and lymphatic capillaries: Podoplanin as a specific marker for lymphatic endothelium. Am. J. Pathol. 154:385–394. 10.1016/S0002-9440(10)65285-6 - DOI - PMC - PubMed
    1. Buono, M., Facchini R., Matsuoka S., Thongjuea S., Waithe D., Luis T.C., Giustacchini A., Besmer P., Mead A.J., Jacobsen S.E.W., and Nerlov C.. 2016. A dynamic niche provides kit ligand in a stage-specific manner to the earliest thymocyte progenitors. Nat. Cell Biol. 18:157–167. 10.1038/ncb3299 - DOI - PMC - PubMed
    1. Chea, S., Schmutz S., Berthault C., Perchet T., Petit M., Burlen-Defranoux O., Goldrath A.W., Rodewald H.-R., Cumano A., and Golub R.. 2016. Single-cell gene expression analyses reveal heterogeneous responsiveness of fetal innate lymphoid progenitors to notch signaling. Cell Rep. 14:1500–1516. 10.1016/j.celrep.2016.01.015 - DOI - PubMed
    1. Chou, S., Flygare J., and Lodish H.F.. 2013. Fetal hepatic progenitors support long-term expansion of hematopoietic stem cells. Exp. Hematol. 41:479–490.e4. 10.1016/j.exphem.2013.02.003 - DOI - PMC - PubMed