. 2025 Jan 8;243(1):40.
doi: 10.1007/s00221-024-06953-1.

The role of muscle synergies and task constraints on upper limb motor impairment after stroke

Affiliations

The role of muscle synergies and task constraints on upper limb motor impairment after stroke

Pablo Ortega-Auriol et al. Exp Brain Res. .

Abstract

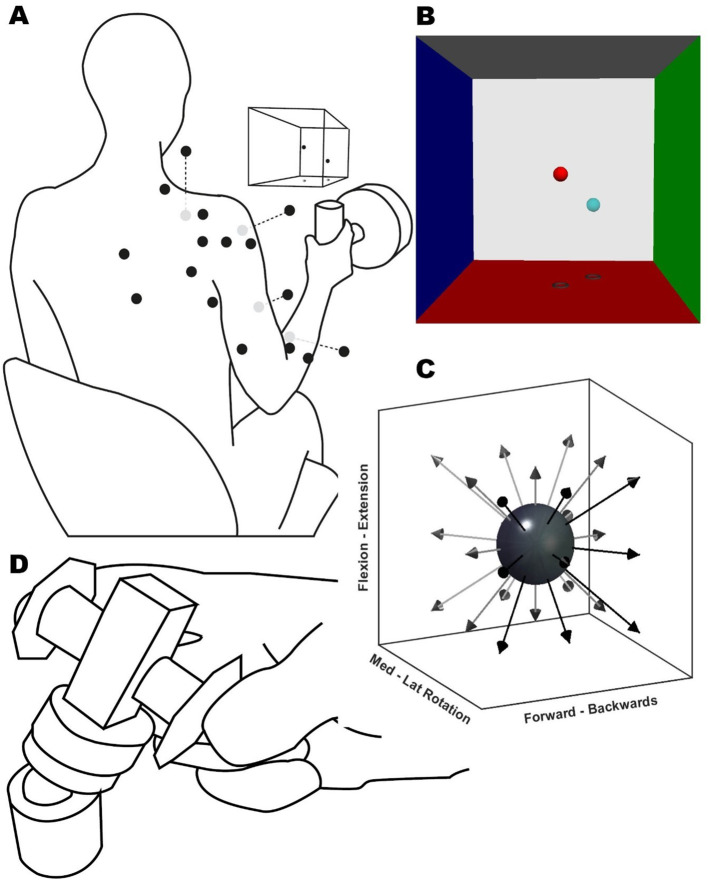
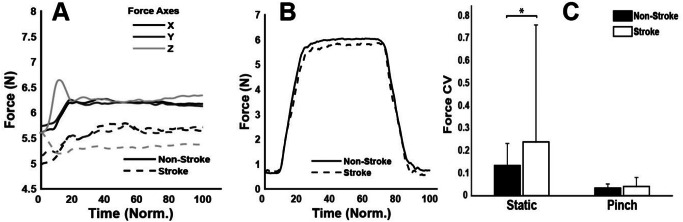
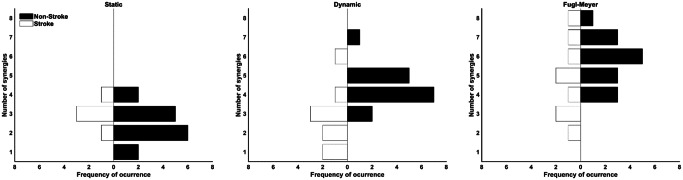
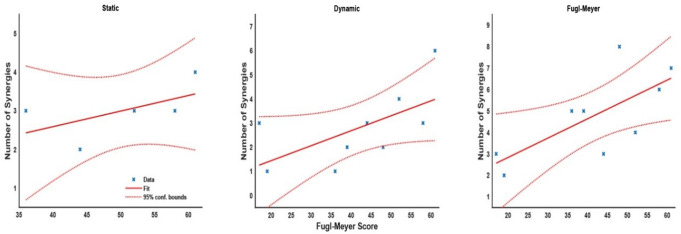
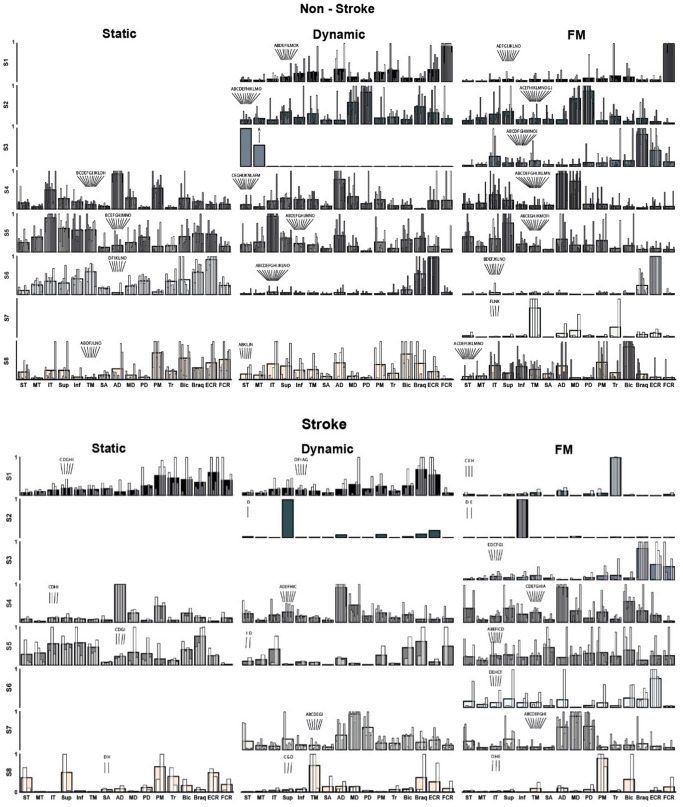
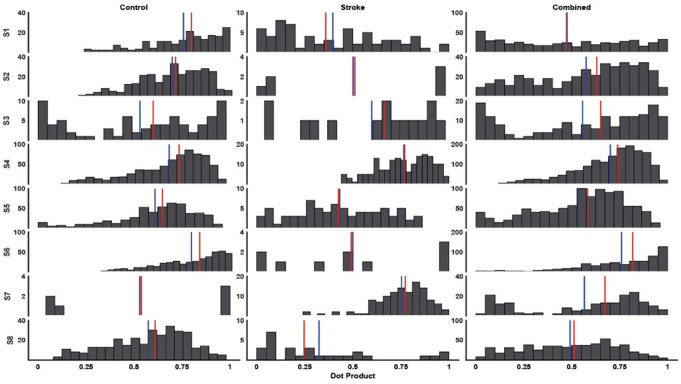
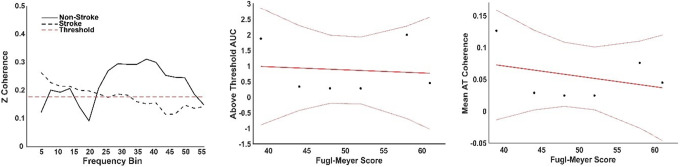
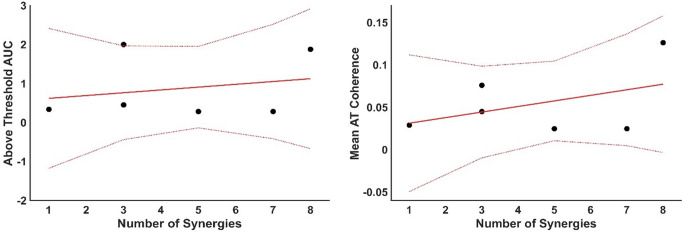
This study explores the role of task constraints over muscle synergies expression in the context of upper limb motor impairment after stroke. We recruited nine chronic stroke survivors with upper limb impairments and fifteen healthy controls, who performed a series of tasks designed to evoke muscle synergies through various spatial explorations. These tasks included an isometric force task, a dynamic reaching task, the clinical Fugl-Meyer (FM) assessment, and a pinch task. Electromyographic data from 16 upper limb muscles were collected during each task, alongside intermuscular coherence (IMC) measurements during the pinch task to assess neuromuscular connectivity. The findings confirm that motor impairment is inversely related to the diversity of muscle synergies, with fewer synergies and more stereotypical synergy structures observed post-stroke. The study further reveals that the nature of motor tasks significantly affects the number of identifiable muscle synergies, with less constrained tasks revealing a broader array of synergies. These findings highlight the importance of carefully selecting motor tasks in the context of clinical research and assessments to understand a patient's motor impairment, thus aiding in developing tailored rehabilitation strategies.

Keywords: FuglmMaeyer; Impairment; Motor control; Muscle synergies; Stroke; Upper limb.


Conflict of interest statement

Declarations. Ethics approval and consent to participate: The University of Auckland Human Participants Ethics Committee approved the research protocol and methods of the study (reference number 022246), and informed consent was gained before participation in any procedure. All experimental procedures and protocols were conducted by the Helsinki Declaration of 1975, revised in 2013, and approved by the institutional ethics committee. Consent for publication: All participants provided written informed consent, including consent for publication of anonymised data. Competing interests: The authors declare no conflicts of interest that could be perceived as potentially influencing the submitted work.

Figures

Fig. 1
Fig. 1
Experimental setup. (A) Illustration of the participant position and EMG sensor placement (black dots, grey dots are located ventrally), VRF view, and instrumented handle for the static task. A button replaced the handle for the dynamic task (not shown). (B) Screenshot of the VR feedback displayed on the screen, showing the target (light blue) and movable (red) spheres. Each VRF wall was located 100 N away from the centre. (C) Representation of target directions (arrows) for the static and dynamic task from a starting position (dark grey sphere). (D) Pinch task schematic, the participants exerted a concentric force onto a force transducer (centre cuboid) over a ball mount. The participant rested their forearms over the table; the height and pitch of the transducer were adjusted individually
Fig. 2
Fig. 2
Average group force traces from the (A) static task and (B) pinch task, and comparison of force coefficient of variation (CV) between the stroke and non-stroke groups. Time is normalised (Norm) across the duration of the task
Fig. 3
Fig. 3
Frequency of occurrence of the number of extracted synergies for the stroke (white bottom bars) and non-stroke (top black bars) groups per task
Fig. 4
Fig. 4
Scatter plot and linear regression fit of the FM score and the number of synergies for the stroke group in each task. Dashed lines show 95% CI for the regression fit
Fig. 5
Fig. 5
Individual (white overlaid bars) and clusters mean of normalised synergies (greyscale bars) for the non-stroke (top) and stroke groups (bottom). Eight synergy clusters (S1–S8) were grouped according to the maximum number of identified synergies across participants for each task and group. Three consecutive cluster analyses allowed the grouping of synergies across tasks and study groups. Letters above the white overlaid bars correspond to each participant ID, as in Table 1. Muscles are labelled in an abbreviated form: superior (ST), middle (MT) and inferior trapezius (IT), supraspinatus (Sup), infraspinatus (Inf), teres minor (TM), serratus anterior (SA), anterior (AD), middle (MD), and posterior deltoid (PD), pectoralis major (PM), long head of biceps brachii (Bic), long head of triceps brachii (Tr), brachioradialis (Brac), extensor carpi radialis (ECR), and flexor carpi radialis (FCR)
Fig. 6
Fig. 6
Histograms of cluster similarities (dot product), median value (vertical red line) and average (blue vertical line). Columns from left to right display the non-stroke, stroke and both groups combined similarities for each synergy (S1–S8). The Y-axes of each subplot represent the frequency of occurrence of a bin of the dot product (20 bins). The dot products for each group were calculated from every possible pairing between cluster members (S1– S8). Similarly, the combined dot products were calculated across all tasks and groups (S1– S8)
Fig. 7
Fig. 7
Analysis of Inter-Muscular Coherence (IMC). Left panel: IMC results for pinch tasks between the First Dorsal Interosseous (FDI) and Abductor Pollicis Brevis (APB) muscles, comparing non-stroke (solid line) and stroke groups (dashed line). Centre panel: Above-threshold (AT) area under the curve (AUC) for IMC, displaying data points and fitted model (solid red line) along with 95% confidence intervals (dotted lines). Right panel: Mean IMC of stroke participants plotted against Fugl-Meyer (FM) score, with the fitted model and 95% confidence intervals shown
Fig. 8
Fig. 8
Relationship between muscle synergies and inter-muscular coherence. Left panel: Area under the curve (AUC) for Inter-Muscular Coherence (IMC) plotted against the number of muscle synergies (MSs) extracted from the Fugl-Meyer (FM) assessment task. Data points are shown alongside the fitted model (solid red line) and 95% confidence intervals (dotted lines). Right panel: Mean above-threshold z-coherence values plotted against the number of muscle synergies, with each data point representing an average from the FM task, accompanied by the fitted trend line and confidence intervals

Similar articles

Cited by

References

    1. Baker SN, Pinches EM, Lemon RN (2003) Synchronization in Monkey Motor Cortex during a Precision grip Task. II. Effect of Oscillatory Activity on Corticospinal output. J Neurophysiol 89(4):1941–1953. 10.1152/jn.00832.2002 - PubMed
    1. Barroso FO, Torricelli D, Molina-Rueda F, Alguacil-Diego IM, Cano-de-la-Cuerda R, Santos C, Moreno JC, Miangolarra-Page JC, Pons JL (2017) Combining muscle synergies and biomechanical analysis to assess gait in stroke patients. J Biomech 63:98–103. 10.1016/j.jbiomech.2017.08.006 - PubMed
    1. Bastos AM, Schoffelen J-M (2016) A Tutorial Review of Functional Connectivity Analysis methods and their interpretational pitfalls. Front Syst Neurosci 9. 10.3389/fnsys.2015.00175 - PMC - PubMed
    1. Berger DJ, d’Avella A (2014) Effective force control by muscle synergies. Frontiers in Computational Neuroscience, 8. 10.3389/fncom.2014.00046 - PMC - PubMed
    1. Berry MW, Browne M, Langville AN, Pauca VP, Plemmons RJ (2007) Algorithms and applications for approximate nonnegative matrix factorization. Comput Stat Data Anal 52(1):155–173. 10.1016/j.csda.2006.11.006

LinkOut - more resources