. 2025 Jan 7;109(1):4.
doi: 10.1007/s00253-024-13273-5.

Identification and monitoring of cell heterogeneity from plasmid recombination during limonene production

Affiliations

Identification and monitoring of cell heterogeneity from plasmid recombination during limonene production

Lucas Gelain et al. Appl Microbiol Biotechnol. .

Abstract

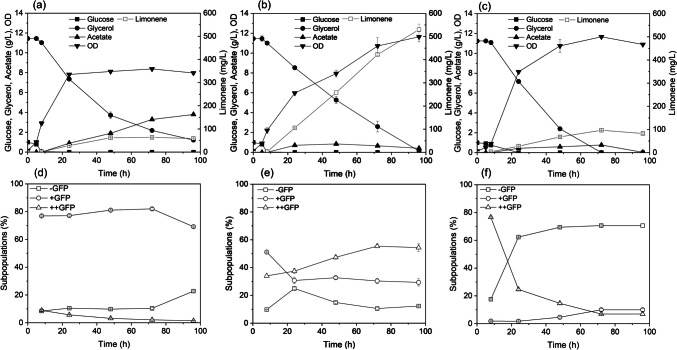
Detecting alterations in plasmid structures is often performed using conventional molecular biology. However, these methods are laborious and time-consuming for studying the conditions inducing these mutations, which prevent real-time access to cell heterogeneity during bioproduction. In this work, we propose combining both flow cytometry and fluorescence-activated cell sorting, integrated with mechanistic modelling to study conditions that lead to plasmid recombination using a limonene-producing microbial system as a case study. A gene encoding GFP was introduced downstream of the key enzymes involved in limonene biosynthesis to enable real-time kinetics monitoring and the identification of cell heterogeneity according to microscopic and flow cytometric analyses. Three different plasmid configurations (one correct and two incorrect) were identified through cell sorting based on subpopulations expressing different levels of GFP at 10 and 50 µM IPTG. Higher limonene production (530 mg/L) and lower subpopulation proportion carrying the incorrect plasmid (12%) were observed for 10 µM IPTG compared to 50 µM IPTG (96 mg/L limonene and more than 70% of cell population carrying the incorrect plasmid, respectively) in 100 mL production culture. We also managed to derive exploratory hypotheses regarding the plasmid recombination region using the model and successfully validated them experimentally. Additionally, the results also showed that limonene production was proportional to GFP fluorescence intensity. This correlation could serve as an alternative to using biosensors for a high-throughput screening process. The developed method enables rapid identification of plasmid recombination at single-cell level and correlates the heterogeneity with bioproduction performance. KEY POINTS: • Strategy to study plasmid recombination during bioproduction. • Different plasmid structures can be identified and monitored by flow cytometry. • Mathematical modelling suggests specific alterations in plasmid structures.

Keywords: Cell heterogeneity; Flow cytometry; Fluorescence-activated cell sorting; Limonene; Mathematical modelling; Plasmid recombination.


Conflict of interest statement

Declarations. This article does not contain any studies with animals performed by any of the authors. Conflict of interest: The authors declare no competing interests.

Figures

Fig. 1
Fig. 1
Workflow of the method developed combines fluorescent protein, flow cytometry, FACS and mathematical modelling to study conditions that lead to plasmid recombination. The strategies commonly used involve colony PCR or plasmid purification for restriction enzyme digestion followed by gel electrophoresis and sequencing. The method proposed here was developed to reduce these laborious and time-consuming steps. 1. Identification of plasmid recombination by gel electrophoresis or sequencing. 2. Development of strategies to study the conditions that lead to plasmid recombination, such as position and number of fluorescent proteins, medium composition, etc. 3. Performing experiments and evaluation of fluorescent protein production using flow cytometry. 4. Development of a mechanistic model to correlate all the experimental parameters and test the correlation between plasmid recombination and production performance. 5. Confirmation and identification of subpopulations carrying the correct and incorrect plasmids. This information can be used to refine the strategies to study the conditions that lead to plasmid recombination
Fig. 2
Fig. 2
Identification of cell heterogeneity using a fluorescent protein (a) Addition of GFP into pJBEI-6409 plasmid and regions with high probability of recombination due to identical sequences (R1 and R2). Acetoacetyl-CoA synthase (atoB), HMG-CoA (hydroxymethylglutaryl-CoA) synthase (HMGS), HMG-CoA reductase (HMGR), mevalonate kinase (MK), phosphomevalonate kinase (PMK), diphosphomevalonate decarboxylase (PMD), isopentenyl diphosphate isomerase (idi), geranyl pyrophosphate synthase (GPPS), limonene synthase (LS), GFP, origin of replication (Ori), chloramphenicol acetyltransferase (CmR) and lacI repressor (lacI) (Table S4). (b) Microplate results showing the effect of different concentrations of IPTG on GFP expression. (c) Microscope images from samples taken from microplate reader after 16 h for the conditions using 10, 50 and 100 µM IPTG (black bars correspond to 27 µm). (d) GFP proportions and intensities for two subpopulations (-GFP, + GFP) from flow cytometry for the conditions using 10, 50 and 100 µM IPTG at 16 h
Fig. 3
Fig. 3
Verification of plasmid recombination by cell sorting (a) GFP intensity for the three subpopulations (-GFP, + GFP, +  + GFP) from flow cytometry for the conditions using 10 and 50 µM IPTG, 10.6 cells were sorted from each of the subpopulations indicated by yellow circles. (b) Cell distributions from LB cultures inoculated with cells sorted from each subpopulation were analysed and compared for the two different IPTG concentrations. (c) The plasmids from the cells grown in LB cultures were purified and digested with NcoI. (d) Plasmids from +  + GFP and -GFP gates were sent for sequencing and the arrows show the sequenced regions (R1 and R2 are the regions in the plasmid that recombined, Fig. 2a)
Fig. 4
Fig. 4
The impact of different IPTG concentrations on the performance of limonene production and cell heterogeneity. Profiles of glucose, glycerol, acetate, OD, and limonene for the control condition (no IPTG) (a) and conditions with 10 µM IPTG (b), and 50 µM IPTG (c) in 100 mL medium culture for 96 h. Flow cytometry data showing different expressions of GFP (-GFP, + GFP and +  + GFP) for control (no IPTG) (d), 10 µM IPTG (e) and 50 µM IPTG (f)
Fig. 5
Fig. 5
The performance of limonene production at different culture conditions. (a) Limonene production and (b) yield after 48 h: LB inoculum and production medium without IPTG induction (Control (LB PM)), LB inoculum with 10 µM IPTG induction in the production medium (LB PM), LB inoculum inoculated in the production medium without glucose and with 10 µM IPTG induction (LB PM (without glucose)), minimum medium inoculum supplemented with 10 g/L glycerol and 10 µM IPTG induction in the production medium (MM 10 g PM), in 30 mL medium culture. (c) Flow cytometry data showing different expressions of GFP at 8, 24 and 48 h. Three subpopulations expressing different levels of GFP were observed, -GFP (low or no expression), + GFP (basal expression level) and +  + GFP (expression under IPTG induction)
Fig. 6
Fig. 6
In silico mechanistic model simulations (a) to capture the phenomena at different IPTG inductions (0 µM (ctrl), 10 µM, and 50 µM) and correlation between the proportion of GFP subpopulation to limonene bioproduction performance. Dashed lines represent simulations at 0 µM (ctrl), and dotted lines and solid lines represent simulations at 10 µM and 50 µM respectively. (b) A plot showing the correlation between the +  + GFP proportion and the limonene production. Linear fit 1 and Linear fit 2 represent the linear fitting of the experimental data before and after excluding the outlier (denoted by the arrow) with Pearson correlation coefficients of 0.47 and 0.78, respectively. The solid line indicates the fitting using a Hill equation after excluding the outlier with R2 (coefficient of determination) of 0.95. (c) A schematic diagram illustrating the different key cellular phenomena captured by the developed mechanistic model. The details of the corresponding ODEs and parameters are provided in Supplementary Table S2-S3

References

    1. Alonso S, Rendueles M, Díaz M (2012) Physiological heterogeneity of Pseudomonastaetrolens during lactobionic acid production. Appl Microbiol Biotechnol 96(6):1465–1477. 10.1007/s00253-012-4254-2 - PubMed
    1. Alonso-Gutierrez J, Chan R, Batth TS, Adams PD, Keasling JD, Petzold CJ, Lee TS (2013) Metabolic engineering of Escherichiacoli for limonene and perillyl alcohol production. Metab Eng 19:33–41. 10.1016/j.ymben.2013.05.004 - PubMed
    1. Bahl MI, Sørensen SJ, Hestbjerg Hansen L (2004) Quantification of plasmid loss in Escherichiacoli cells by use of flow cytometry. FEMS Microbiol Lett 232(1):45–49. 10.1016/S0378-1097(04)00015-1 - PubMed
    1. Balleza E, Kim JM, Cluzel P (2018) Systematic characterization of maturation time of fluorescent proteins in living cells. Nat Methods 15(1):47–51. 10.1038/nmeth.4509 - PMC - PubMed
    1. Bao SH, Zhang DY, Meng E (2019) Improving biosynthetic production of pinene through plasmid recombination elimination and pathway optimization. Plasmid 105:102431. 10.1016/j.plasmid.2019.102431 - PubMed

MeSH terms

LinkOut - more resources