. 2025 May;93(5):2049-2058.
doi: 10.1002/mrm.30405. Epub 2025 Jan 8.

Minimally invasive measurement of carotid artery and brain temperature in the mouse

Affiliations

Minimally invasive measurement of carotid artery and brain temperature in the mouse

Lisa M Gazdzinski et al. Magn Reson Med. 2025 May.

Abstract

Purpose: Brain temperature is tightly regulated and reflects a balance between cerebral metabolic heat production and heat transfer between the brain, blood, and external environment. Blood temperature and flow are critical to the regulation of brain temperature. Current methods for measuring in vivo brain and blood temperature are invasive and impractical for use in small animals. This work presents a methodology to measure both brain and arterial blood temperature in anesthetized mice by MRI using a paramagnetic lanthanide complex: thulium tetramethyl-1,4,7,10-tetraazacyclododecane-1,4,7,10-tetraacetic acid (TmDOTMA-).

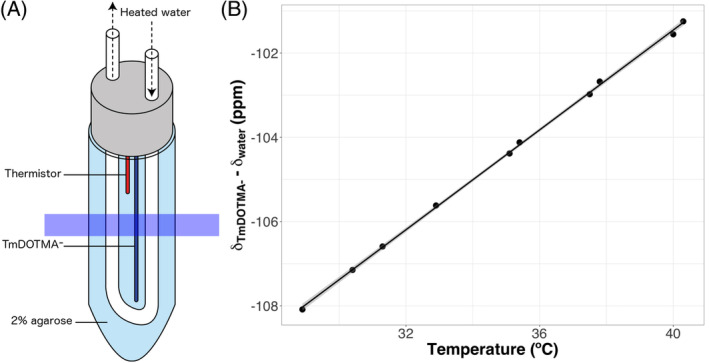
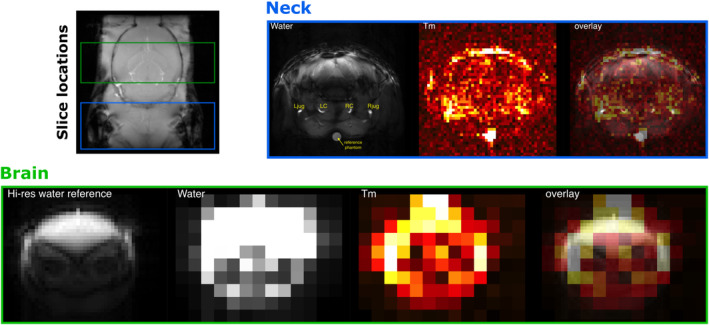
Methods: A phase-based imaging approach using a multi-TE gradient echo sequence was used to measure the temperature-dependent chemical shift difference between thulium tetramethyl-1,4,7,10-tetraazacyclododecane-1,4,7,10-tetraacetic acid methyl protons and water, and from this calculate absolute temperature using calibration data.

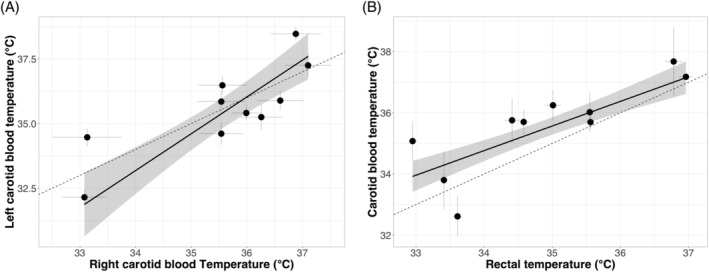
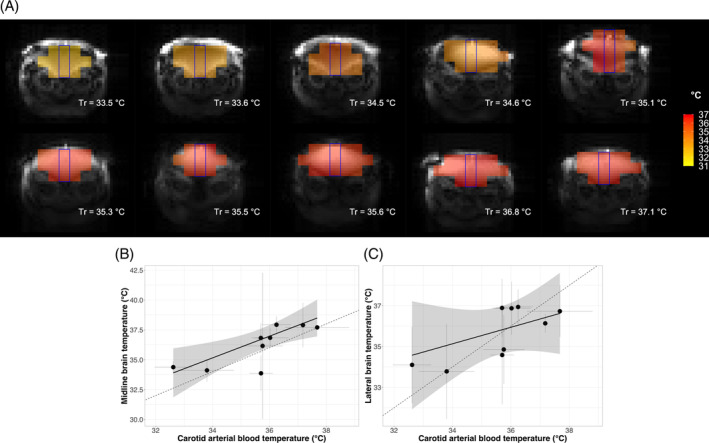
Results: In a series of mice in which core body temperature was held stable but at different values within the range of 33° to 37°C, brain temperature away from the midline was independent of carotid artery blood temperature. In contrast, midline voxels correlated with carotid artery blood temperature, likely reflecting the preponderance of larger arteries and veins in this region.

Conclusion: These results are consistent with brain temperature being actively regulated. A limitation of the present implementation is that the spatial resolution in the brain is coarse relative to the size of the mouse brain, and further optimization is required for this method to be applied for finer spatial scale mapping or to characterize focal pathology.

Keywords: MRI; TmDOTMA−; bioheat; thermometry.


Figures

FIGURE 1
FIGURE 1
Phantom calibration experiment. (A) Schematic of the calibration phantom showing the position of the thermistor and capillary tube containing 25 mM TmDOTMA in PBS and the tubing with circulating heated water used for temperature control. The imaging slice is represented by the translucent blue rectangle. (B) Calibration plot of the resonance frequency difference between the TmDOTMA methyl protons and agarose water versus temperature (measured using the thermistor). The CT and C0 from the best fit line are 0.592 ± 0.0050 ppm/°C and − 125.2 ± 0.175 ppm, respectively. Error bars representing the SD across 2–3 measurements during a 5‐min period when the temperature was held constant are obscured by the data point symbols. C0, calibration intercept; CT, calibration slope; PBS, phosphate‐buffered saline; TmDOTMA, thulium tetramethyl‐1,4,7,10‐tetraazacyclododecane‐1,4,7,10‐tetraacetic acid.
FIGURE 2
FIGURE 2
Representative images from in vivo experiment. The horizontal image at the top left shows the location of the neck (blue) and brain (green) slices. Shown in the blue‐bordered panel are representative water and TmDOTMA images of the neck, as well as the overlay of the two. The LC and RC and the Ljug and Rjug are identified in the water image, as is the reference phantom containing 25 mM TmDOTMA that was placed under the mouse. Shown in the green‐bordered panel are representative water and TmDOTMA images of the brain, as well as the overlay of the two and the higher‐resolution anatomical reference image (left). LC, left carotid artery; Ljug, left jugular vein; RC, right carotid artery; Rjug, right jugular vein.
FIGURE 3
FIGURE 3
Carotid arterial blood temperature. (A) The temperature of the blood in the LC and RC are in agreement (mean difference 0.015 ± 0.31°C, paired t‐test: T = −0.048, df = 8, p = 0.96), supporting self‐consistency of the method. (B) The average carotid arterial blood temperature correlates with the rectal temperature (York regression R 2 = 0.81, p < 0.001) but is higher than the rectal temperature over the range of rectal temperatures in the data (mean difference 0.69 ± 0.27°C, paired t‐test: T = 2.576, df = 9, p = 0.03). In both plots, the error bars represent the uncertainty in the temperature measurements calculated from the propagation of uncertainty in the slope of the linear regression fits of the TmDOTMA and water phase evolution data. The solid lines indicate the best‐fit lines from York linear regression models, with the shaded area indicating the 95% confidence interval of the fits. The dashed lines indicate the line of equality (y = x). df, degrees of freedom.
FIGURE 4
FIGURE 4
Brain temperature. (A) Brain temperature maps for all the mice in the study with available brain data. The maps were smoothed for display purposes, as described in the text. The Tr shown below each image was maintained during the scan, and the images are ordered from lowest to highest Tr. The blue rectangles outline the midline voxels. Voxels outside of these regions were considered lateral voxels. (B) The temperature in the midline voxels is correlated with the carotid arterial blood temperature (York regression R 2 = 0.68, p = 0.013), suggesting that the temperature in these voxels is dominated by the blood in the large vessels in this region. It appears that the midline brain temperature may trend greater than the incoming arterial blood temperature, but this difference was not statistically significant (paired t‐test: T = 1.556, df = 7, p = 0.16). (C) The average temperature in lateral regions (all brain voxels not along the midline) is not correlated with the incoming arterial blood temperature (York regression R 2 = 0.28, p = 0.26). In all plots, the error bars on the brain temperature data represent the uncertainty in the temperature measurements calculated from the propagation of uncertainty in the slope of the linear regression fits of the TmDOTMA and water phase evolution data. The error bars on the carotid blood temperature data represent the SD of the mean of the LC and RC measurements. The solid lines indicate the best‐fit lines from York linear regression models with the shaded area indicating the 95% confidence interval of the fits. The dashed lines indicate the line of equality (y = x). Tr, rectal temperature.

Similar articles

References

    1. Sukstanskii AL, Yablonskiy DA. Theoretical model of temperature regulation in the brain during changes in functional activity. Proc Natl Acad Sci U S A. 2006;103:12144‐12149. - PMC - PubMed
    1. Zhu M, Ackerman JJH, Sukstanskii AL, Yablonskiy DA. How the body controls brain temperature: the temperature shielding effect of cerebral blood flow. J Appl Physiol (1985). 2006;101:1481‐1488. - PMC - PubMed
    1. Wang H, Wang B, Normoyle KP, et al. Brain temperature and its fundamental properties: a review for clinical neuroscientists. Front Neurosci. 2014;8:307. - PMC - PubMed
    1. Karaszewski B, Wardlaw JM, Marshall I, et al. Measurement of brain temperature with magnetic resonance spectroscopy in acute ischemic stroke. Ann Neurol. 2006;60:438‐446. - PubMed
    1. Dehkharghani S, Fleischer CC, Qiu D, Yepes M, Tong F. Cerebral temperature dysregulation: MR thermographic monitoring in a nonhuman primate study of acute ischemic stroke. Am J Neuroradiol. 2017;38:712‐720. - PMC - PubMed