. 2025 Jan;93(1):e70039.
doi: 10.1111/aji.70039.

SARS-CoV-2 Activated Peripheral Blood Mononuclear Cells (PBMCs) Do Not Provoke Adverse Effects in Trophoblast Spheroids

Affiliations

SARS-CoV-2 Activated Peripheral Blood Mononuclear Cells (PBMCs) Do Not Provoke Adverse Effects in Trophoblast Spheroids

Humblenoble Stembridge Ayuk et al. Am J Reprod Immunol. 2025 Jan.

Abstract

Problem: Although it is still uncertain whether Severe Acute Respiratory Coronavirus (SARS-CoV-2) placental infection and vertical transmission occur, inflammation during early pregnancy can have devastating consequences for gestation itself and the growing fetus. If and how SARS-CoV-2-specific immune cells negatively affect placenta functionality is still unknown.

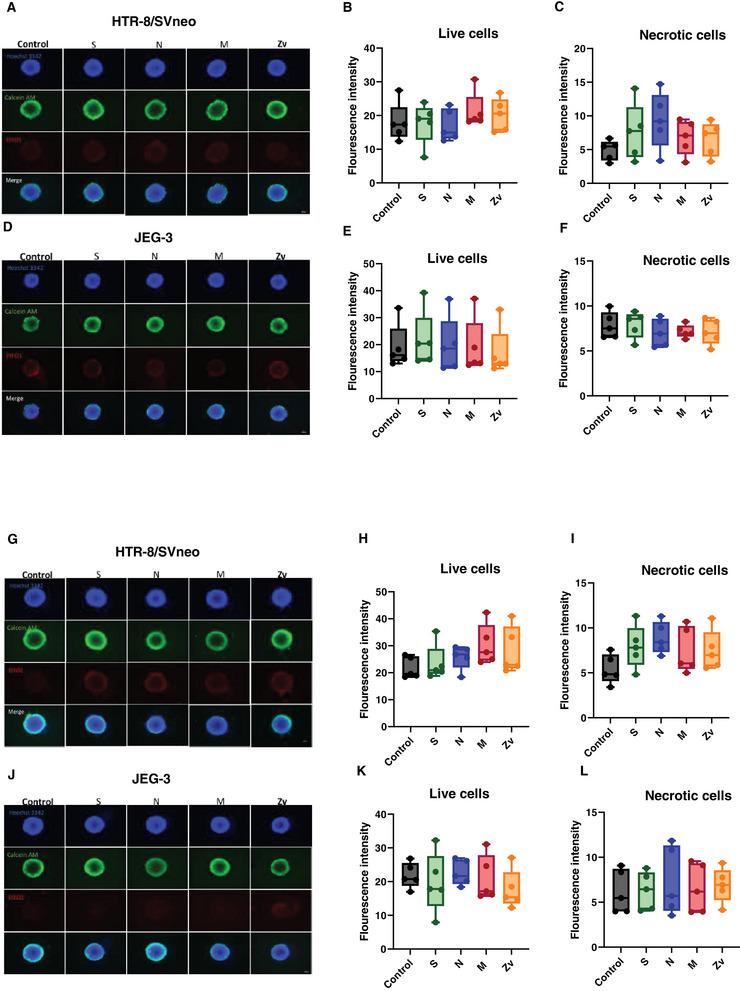
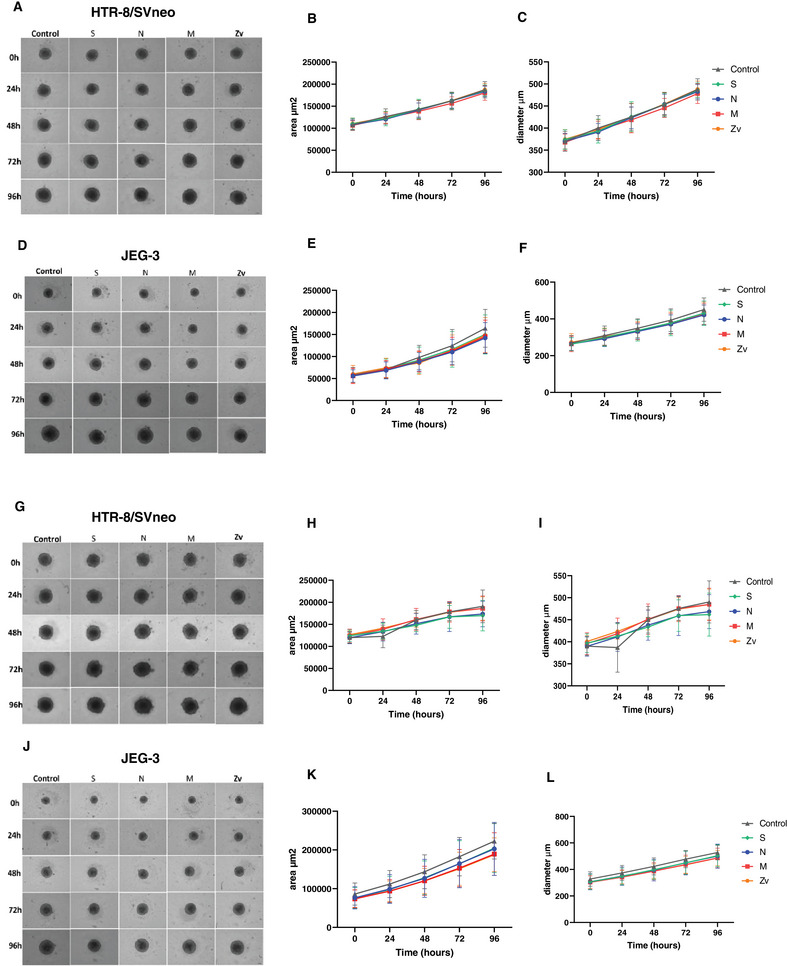
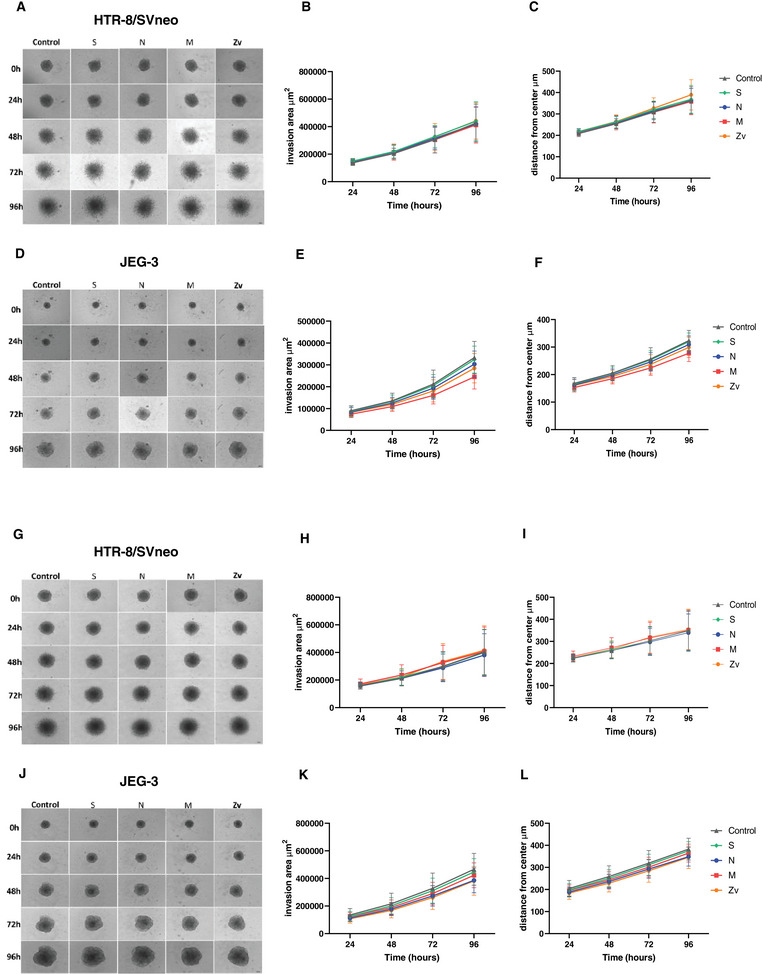
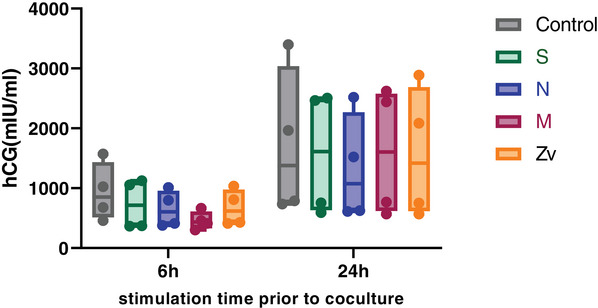
Method of study: We stimulated peripheral blood mononuclear cells (PBMCs) from women of reproductive age with SARS-CoV-2 peptides and cocultured them with trophoblast spheroids (HTR-8/SVneo and JEG-3) to dissect if SARS-CoV-2-activated immune cells can interfere with trophoblast functionality. The activation and cytokine profile of the PBMCs were determined using multicolor flow cytometry. The functionality of trophoblast spheroids was assessed using microscopy, enzyme-linked immunosorbent assay (ELISA), and RT-qPCR.

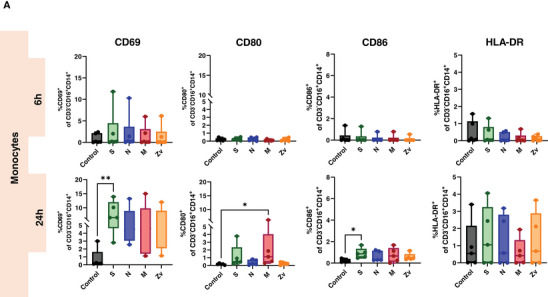
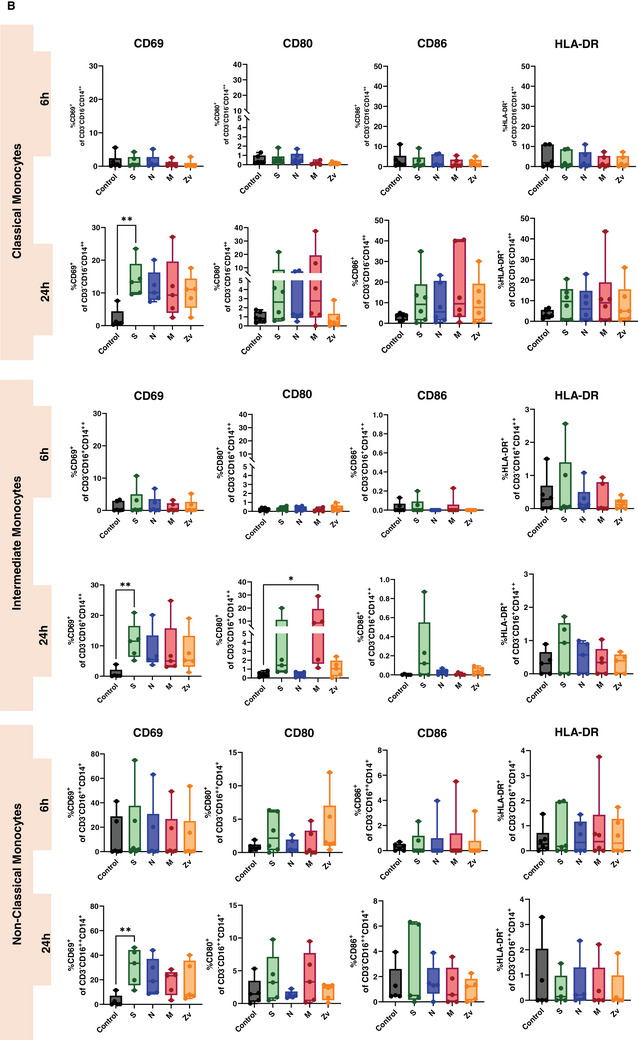
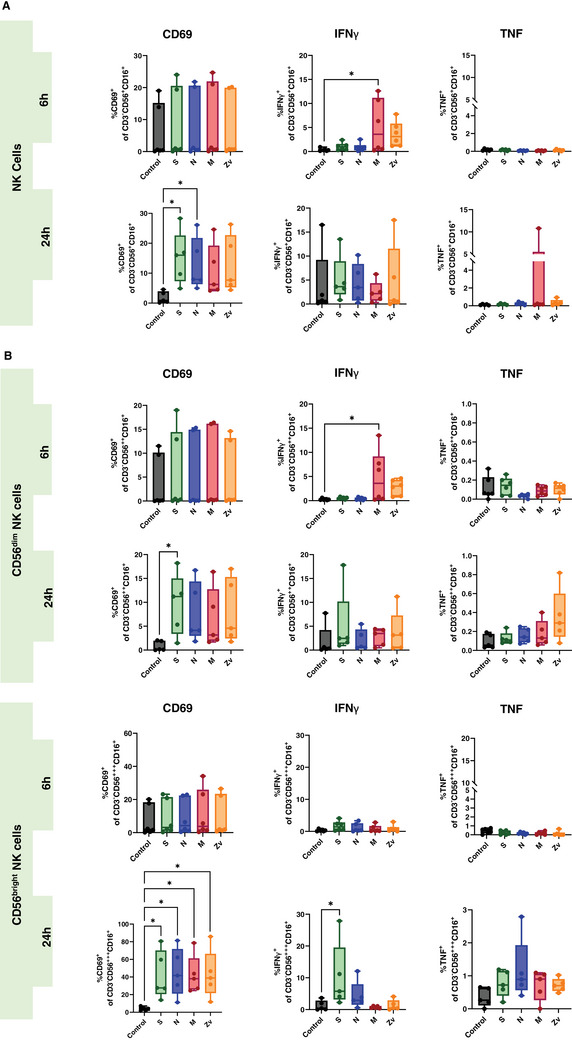
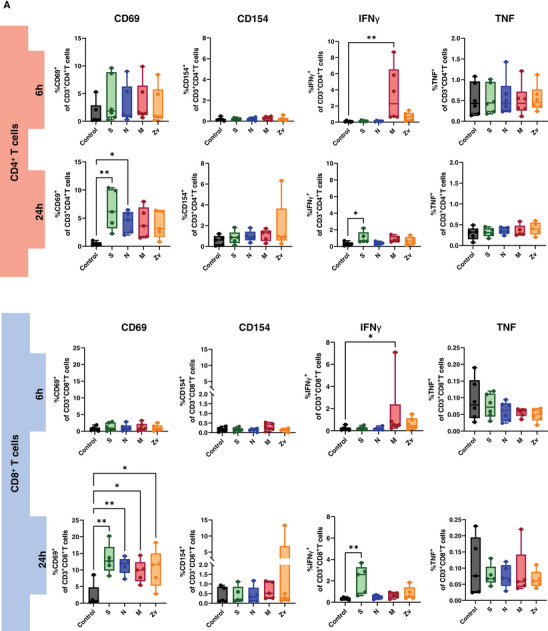
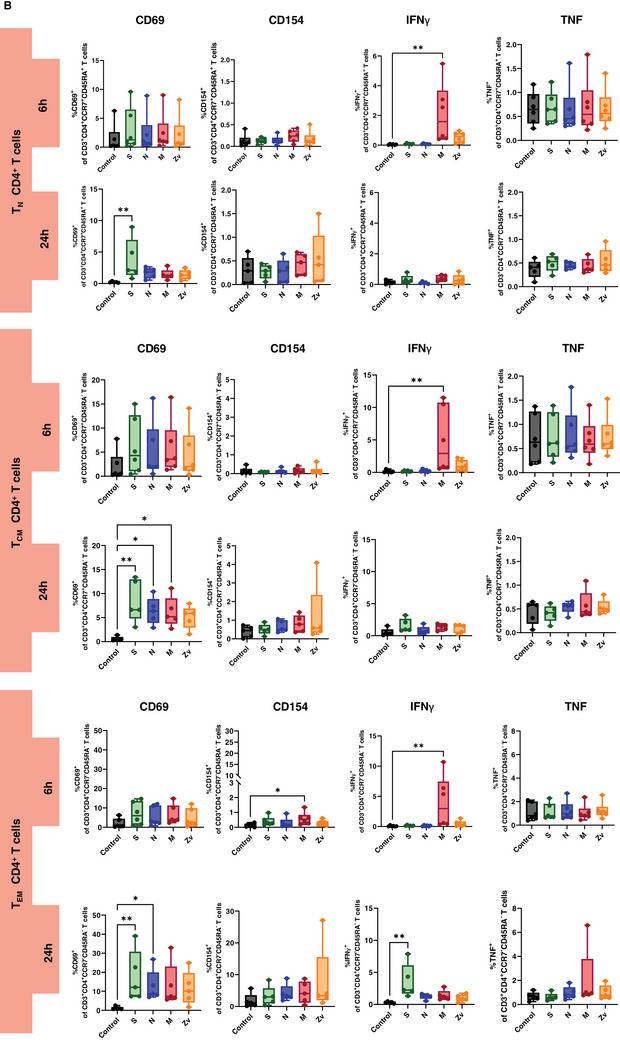
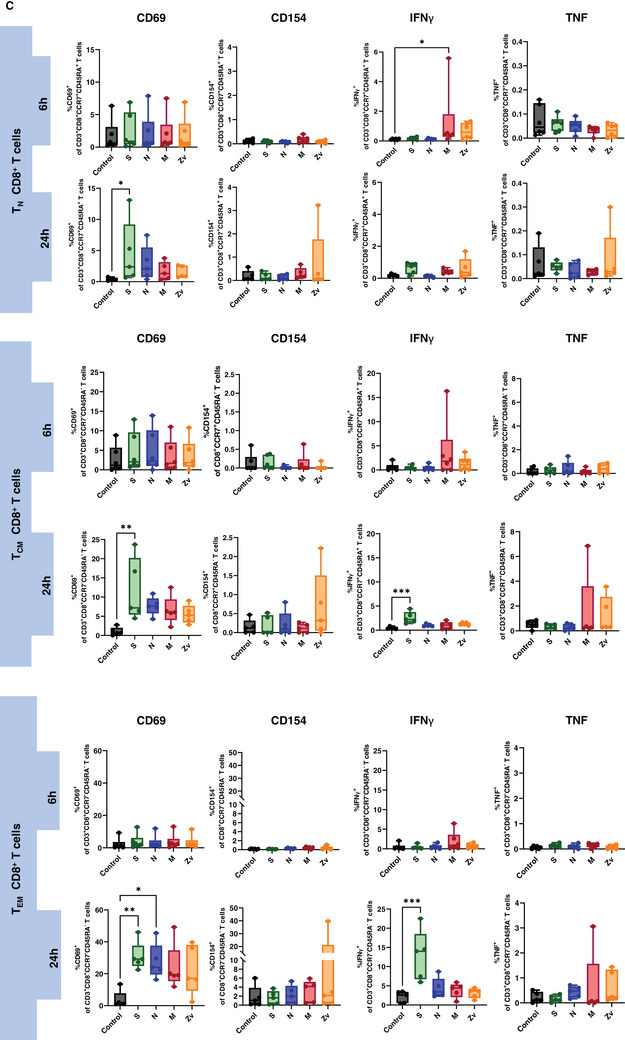
Results: SARS-CoV-2 S and M peptides significantly activated PBMCs (monocytes, NK cells, and T cells with memory subsets) and induced the upregulation of proinflammatory cytokines, such as IFNγ. The activated PBMCs did not impact the viability, growth rate, and invasion capabilities of trophoblast spheroids. Furthermore, the hormonal production of hCG by JEG-3 spheroids was not compromised upon coculture with the activated PBMCs. mRNA transcript levels of genes involved in trophoblast spheroid functional pathways were also not dysregulated after coculture.

Conclusions: Together, the findings of our in vitro coculture model, although not fully representative of in vivo conditions, strongly support the claim that the interaction of SARS-CoV-2-activated peripheral blood immune cells with trophoblast cells at the fetal-maternal interface does not negatively affect trophoblast functionality. This goes in hand with the recommendation of vaccinating pregnant women in their first trimester.

Keywords: 3D cell culture; SARS‐CoV‐2; peripheral blood mononuclear cells (PBMCs); pregnancy; spheroids; trophoblast invasion; trophoblast viability.


Conflict of interest statement

The authors declare no conflict of interest.

Figures

FIGURE 1
FIGURE 1
Monocyte activation in response to SARS‐CoV‐2 (S, N, M) and Zika Virus M (Zv) peptide. PBMCs from non‐pregnant females were stimulated for 6 h (n = 5) and 24 h (n = 6) with SARS‐CoV‐2 S, N, M and Zika virus M peptide. Flow cytometry was performed to determine the general percentage of activation marker expression (A) in the general monocyte population and (B) in monocyte subsets; classical (CD16CD14++), intermediate (CD16+CD14++), and non‐classical monocyte (CD16++CD14+) subtypes. *p < 0.05, **p < 0.01.
FIGURE 1
FIGURE 1
Monocyte activation in response to SARS‐CoV‐2 (S, N, M) and Zika Virus M (Zv) peptide. PBMCs from non‐pregnant females were stimulated for 6 h (n = 5) and 24 h (n = 6) with SARS‐CoV‐2 S, N, M and Zika virus M peptide. Flow cytometry was performed to determine the general percentage of activation marker expression (A) in the general monocyte population and (B) in monocyte subsets; classical (CD16CD14++), intermediate (CD16+CD14++), and non‐classical monocyte (CD16++CD14+) subtypes. *p < 0.05, **p < 0.01.
FIGURE 2
FIGURE 2
Natural killer (NK) cells response to SARS‐CoV‐2 (S, N, M) and Zika Virus M (Zv) peptide. PBMCs from non‐pregnant females were stimulated for 6 h (n = 5) or 24 h (n = 6) with SARS‐CoV‐2 S, N, M and Zika virus M peptide. Bar graph presentations of flow cytometry data to determine the general percentage of activation marker expression (A) in total NK cells and (B) in NK cell subtypes; CD56bright (CD56+++CD16+) and CD56dim (CD56++CD16+). *p < 0.05.
FIGURE 3
FIGURE 3
T cells response to SARS‐CoV‐2 (S, N, M) and Zika Virus M (Zv) peptide stimulation. PBMCs from non‐pregnant females were stimulated for 6 h (n = 5) and 24 h (n = 6) with SARS‐CoV‐2 S, N, M and Zika virus M peptide. The percentage of activation markers expressing CD4+ and CD8+ T cells was determined by flow cytometry (A). Frequency of Circulating SARS‐CoV‐2 specific CD4+ memory cells (B) and memory CD8+ T cells (C). *p < 0.05, **p < 0.01.
FIGURE 3
FIGURE 3
T cells response to SARS‐CoV‐2 (S, N, M) and Zika Virus M (Zv) peptide stimulation. PBMCs from non‐pregnant females were stimulated for 6 h (n = 5) and 24 h (n = 6) with SARS‐CoV‐2 S, N, M and Zika virus M peptide. The percentage of activation markers expressing CD4+ and CD8+ T cells was determined by flow cytometry (A). Frequency of Circulating SARS‐CoV‐2 specific CD4+ memory cells (B) and memory CD8+ T cells (C). *p < 0.05, **p < 0.01.
FIGURE 4
FIGURE 4
Viability of trophoblast cell line spheroids. Images from fluorescence microscopy showing the nuclei (blue), metabolically active cells (green), and necrotic cells (red) after 6 h (A, D) and 24 h (G, J) peptide stimulated PBMCs coculture with trophoblast spheroids for 4 days. Bar plots showing fluorescence intensities of live cells after 6 h (B, E) and 24 h (H, K) and necrotic cells after 6 h (C, F) and 24 h (I, L) of peptide stimulated PBMCs coculture. Scale bar 100 µm.
FIGURE 5
FIGURE 5
Growth rate of trophoblast spheroids. Bright‐field images of HTR‐8/Svneo and JEG‐3 spheroids after 6 h (A, D) and 24 h (G, J) peptide‐stimulated PBMC coculture for 4 days. Line graphs showing HTR‐8/Svneo spheroid growth area (µm2) and growth diameter (µm) after 6 h (B, C) and 24 h (H, I) and Line graphs showing JEG‐3 spheroid growth area (µm2) and growth diameter (µm) after 6 h (E, F) and 24 h (K, L) peptide stimulated PBMCs coculture. Scale bar 100 µm.
FIGURE 6
FIGURE 6
Invasion rate of trophoblast spheroids. Bright‐field images of HTR‐8/Svneo and JEG‐3 spheroids after 6 h (A, D) and 24 h (G, J) peptide‐stimulated PBMC coculture for 4 days. Line graphs showing HTR‐8/SVneo spheroid invasion area (µm2) and distance from the center (µm) after 6 h (B, C) and 24 h (H, I) and Line graphs showing JEG‐3 spheroid invasion area (µm2) and distance from the center (µm) after 6 h (E, F) and 24 h (K, L) peptide stimulated PBMCs coculture. Scale bar 100 µm.
FIGURE 7
FIGURE 7
The effect of SARS‐CiV‐2 and Zika virus peptide‐activated peripheral blood mononuclear cells (PBMC) on human chorionic gonadotropin (hCG) secretion by JEG‐3 spheroids after 4 days of coculture.

Similar articles

References

    1. WHO , COVID‐19 Cases | WHO COVID‐19 Dashboard (2024), https://data.who.int/dashboards/covid19/cases?n=c.
    1. Rabaan A. A., Smajlović S., Tombuloglu H., et al., “SARS‐CoV‐2 Infection and Multi‐Organ System Damage: A Review,” Biomolecules and Biomedicine 23 (2023): 37, 10.17305/BJBMS.2022.7762. - DOI - PMC - PubMed
    1. Zanza C., Romenskaya T., Manetti A. C., et al., “Cytokine Storm in COVID‐19: Immunopathogenesis and Therapy,” Medicina (B Aires) 58 (2022), 10.3390/MEDICINA58020144. - DOI - PMC - PubMed
    1. Ackermann M., Verleden S. E., Kuehnel M., et al., “Pulmonary Vascular Endothelialitis, Thrombosis, and Angiogenesis in Covid‐19,” New England Journal of Medicine 383 (2020): 120, 10.1056/NEJMOA2015432/SUPPL_FILE/NEJMOA2015432_DISCLOSURES.PDF. - DOI - PMC - PubMed
    1. Gabarre P., Dumas G., Dupont T., Darmon M., Azoulay E., and Zafrani L., “Acute Kidney Injury in Critically Ill Patients With COVID‐19,” Intensive Care Medicine 46 (2020): 1339, 10.1007/S00134-020-06153-9/FIGURES/4. - DOI - PMC - PubMed

MeSH terms