. 2025 Jan 2;19(1):wrae260.
doi: 10.1093/ismejo/wrae260.

Magnetotactic bacteria affiliated with diverse Pseudomonadota families biomineralize intracellular Ca-carbonate

Affiliations

Magnetotactic bacteria affiliated with diverse Pseudomonadota families biomineralize intracellular Ca-carbonate

Camille C Mangin et al. ISME J. .

Abstract

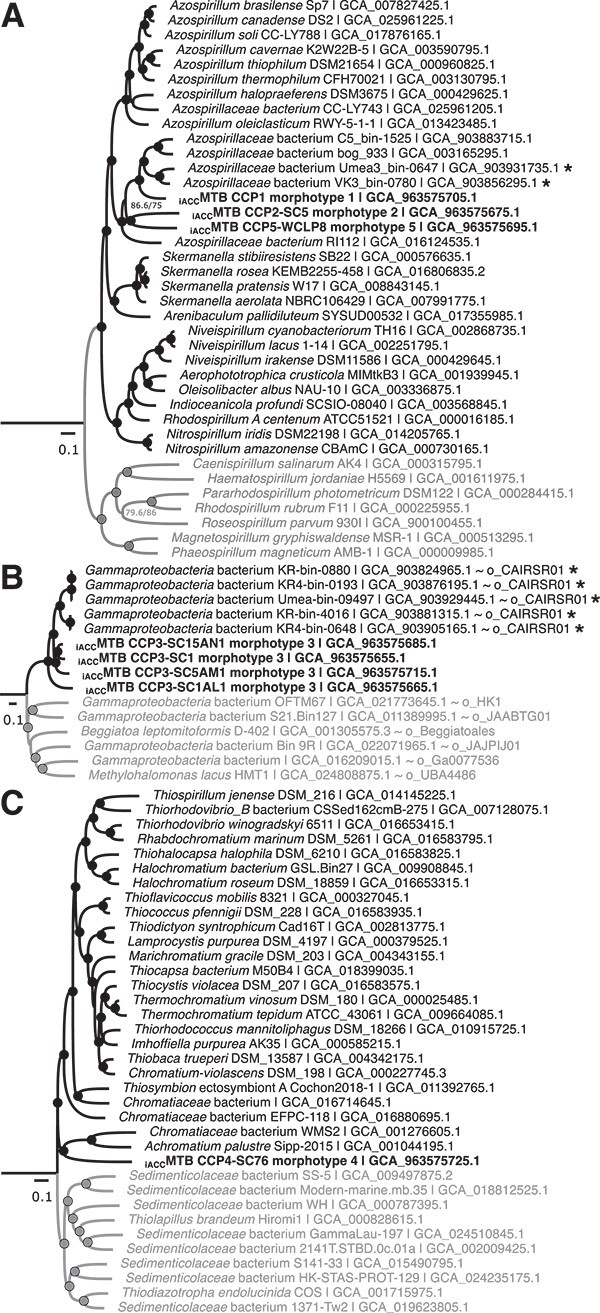
Intracellular calcium carbonate formation has long been associated with a single genus of giant Gammaproteobacteria, Achromatium. However, this biomineralization has recently received increasing attention after being observed in photosynthetic Cyanobacteriota and in two families of magnetotactic bacteria affiliated with the Alphaproteobacteria. In the latter group, bacteria form not only intracellular amorphous calcium carbonates into large inclusions that are refringent under the light microscope, but also intracellular ferrimagnetic crystals into organelles called magnetosomes. Here new observations suggest that magnetotactic bacteria previously identified in the sediments and water column of Lake Pavin (France) were only a small fraction of the diversity of bacteria producing intracellular amorphous calcium carbonates. To explore this diversity further, we conducted a comprehensive investigation of magnetotactic populations with refractive granules using a combination of environmental microbiology, genomic and mineralogy approaches on cells sorted by micromanipulation. Several species belonging to divergent genera of two Pseudomonadota classes were identified and characterized. Scanning transmission electron microscopy coupled with energy-dispersive X-ray spectrometry support that all these species indeed form intracellular amorphous calcium carbonates. Cryo soft X-ray tomography experiments conducted on ice-vitrified cells, enabled 3D investigation of inclusions volume, which was found to occupy 44-68% of the cell volume. Metabolic network modeling highlighted different metabolic abilities of Alpha- and Gammaproteobacteria, including methylotrophy and CO2 fixation via the reverse Krebs cycle or the Calvin-Benson-Bassham cycle. Overall, this study strengthens a convergent evolution scenario for intracellular carbonatogenesis in Bacteria, and further supports that it is promoted by the fixation of CO2 in anoxic environments.

Keywords: biomineralization; calcium carbonate; carbonatogenesis; environmental microbiology; magnetotactic bacteria.


Conflict of interest statement

The authors declare that they have no conflicts of interest.

Figures

Figure 1
Figure 1
Morphologies and relative frequencies of the five most abundant and regularly observed MTB populations with large refractive inclusions ( iACC MTB-like) in the shallow sediments and the water column of Lake Pavin. (A) Representative light microscopy image of north-seeking MTB diversity in sediments, bearing highly refractive granules (yellow-colored structures such as those indicated by an arrow). The scale bar represents 9 μm. (B) Representative light microscopy images of the five morphotypes representing > 90% of iACCMTB-like in the Lake Pavin. Values in square brackets correspond to the range of inclusions numbers per cell from the lowest (bold value, representing most of the populations) to the highest value. Scales bars represent 1 μm. (C) Boxplots showing the distribution of the cell length, cell width and iACC inclusions diameter per morphotype. The iACC inclusion size could not be precisely measured for the morphotype 3 because inclusions shape and size were inconsistent. Only a rough estimation (marked with an *) could be made. Although similar, iACCMTB of the water column and those of the morphotype 1 in the sediment have different magnetosomes chains (Fig. 2C and D). Consequently, iACCMTB from the water column were classified as a distinct fifth morphotype. Measurements were performed from several cells: n = 33, 48, 20, 39, and 40 for morphotypes 1, 2, 3, 4, and 5, respectively. Estimations of iACC diameter were performed from 94, 107, 32, 103, and 90 inclusions, respectively. (D) Relative frequency of each iACCMTB-like morphotype in the sediments (Sed) and the chemocline of the water column (WC). Averages and standard deviations are plotted in black on both panels.
Figure 2
Figure 2
Ultrastructural characteristics of the main  iACCMTB-like morphotypes with inclusions occupying most of their cell volume. Representative TEM (A) and SEM (B) images showing inclusions with a different contrast to the electron beam (black and white respectively) from which iACC diameter was estimated in Fig. 1C. Scales bars represent 2 μm. White arrows indicate the magnetosomes when visible in the SEM images. (C) TEM images of corresponding magnetosome chains for each morphotype. Scales bars represent 0.2 μm. Combination of SEM and TEM images highlighted the presence of a single polar flagellum for the morphotype 1 and 4, whereas one and two bundles of polar flagella were observed the morphotypes 3 and 2 respectively (Fig. S7). (D) Analysis of magnetosome size distribution for each morphotype. A total of 242, 353, 212, 165 and 210 magnetosomes were analyzed for morphotypes 1, 2, 3, 4 and 5 respectively. Averages and standard deviations are plotted next to boxplots (dotted black lines). The magnetosome shape factor (i.e. ratio length/width) averages were 0.69 ± 0.08, 0.90 ± 0.06, 0.73 ± 0.09, 0.62 ± 0.08 and 0.86 ± 0. 07 (±1SD), respectively. Additional SEM images are given in Fig. S4.
Figure 3
Figure 3
XEDS elemental mapping of calcium (Ca-K), and iron (Fe-K) from STEM-HAADF images of  iACCMTB representing dominant morphotypes, along with diffraction analysis (HRTEM) of their corresponding magnetosomes. STEM-XEDS elemental mapping shown are non-background subtracted. The Fe elemental maps display chains of magnetosomes from different morphotypes, indicated by the white arrows. HRTEM images of individual magnetosomes biomineralized by the different iACCMTB along with their corresponding fast Fourier transform (FFT) patterns have been indexed based on the magnetite structure. For each HRTEM image, the [111] direction is displayed. For morphotype 1–4, the [111] is in figure plane. For morphotype 5, the [111] direction is out of plane. In a previous study, such analyses for the morphotype 1 have shown that magnetosomes were composed of magnetite (Fe3O4) nanocrystals and that inclusions were predominantly composed of calcium (Ca) [25]. Here, the same analyzes led to the same conclusions for the other four morphotypes of the sediments and the water column.
Figure 4
Figure 4
Maximum-likelihood trees showing the genetic relationships of the  iACCMTB with their closest relatives in the Pseudomonadota phylum based on conserved 120 conserved proteins used by the GTDB taxonomy. (A) Phylogenetic tree of the Azospirillaceae family (Alphaproteobacteria). All genomes of good quality (i.e. > 90% complete with < 5% redundancy according to CheckM v1.0.18 [56] were used, except for the genus Azospirillum, for which a taxonomic reduction was done to select the most representative genomes only. The tree was rooted with representative members of several Rhodospirillaceae members (grey group), which was the closest monophyletic group of non-symbiotic organisms based on Muñoz-Gomez et al. [92]. Phylogenetic trees shown in (B) and (C) represent the Candidatus order / family CAIRSR01 and the Chromatiaceae family (order Chromatiales) of the Gammaproteobacteria class, respectively. The external group (i.e. the closest monophyletic group) used to root trees (B) and (C) were identified using a Gammaproteobacteria phylogenetic tree built in this study and given in the Fig. S10. The dataset includes all the genomes identified as being in the same group as one or more iACCMTB based on GTDB-tk [93] analysis and a selection of genomes of the closest monophyletic group (i.e. Sedimenticolaceae for the Chromatiaceae tree, and a monophyletic group representing several Gammaproteobacteria orders for the CAIRSR01 tree). Branch lengths represent the number of substitutions per site. The circles plotted on the internal nodes represent the statistical support, considered satisfactory when the likelihood rate (aLRT) was greater than 0.95 (estimated from 1000 replicas) and the non-parametric bootstrap value was greater than 80% (estimated from 500 replicas). The iACCMTB genomes are shown in bold, whereas the MAGs in which a MGC was assembled are annotated with a “*”. The corresponding Genbank accession numbers are given in the sequence names, along with the corresponding order name “o_” and family name “f_” in GTDB [94] (https://gtdb.ecogenomic.org).
Figure 5
Figure 5
Conservation of MGC synteny in representative  iACCMTB and the magnetotactic Pseudomonadota model strains MSR-1, BW-2, and SS-5. Genomes are organized by class (Alphaproteobacteria and Gammaproteobacteria). Names in bold represent the iACCMTB genomes sequenced in this study: CCP-1 is the name given to the iACCMTB morphotype 1 genome; CCP2-SC-5 to morphotype 2; CCP5-WCLP8 to water column morphotype 5; CCP3-SC15AN1 to morphotype 3; and CCP4-SC76 to morphotype 4. Each arrow represents a gene of a color corresponding to a specific operon in MSR-1 [10]. Grey genes are genes of unknown function or not conserved in MTB. Checkerboards represent mainly truncations and sometimes regions spacing two operons. Sequence identities between reciprocal best hits were estimated with MMseqs2 [95] and are represented by bands, with their intensity reflecting the percentage of identity. Some homologues are not linked due to high sequence divergence and/or the presence of multiple paralogs. Homologues families were then determined by the presence of conserved domains using the microscope platform [73]. A full version of this figure is given in Fig. S13.
Figure 6
Figure 6
Heatmap representing selected metabolic pathways and functions involved in energy metabolism, assimilation, utilization or degradation of organic and inorganic compounds, as well as in calcium or sulfur cycling in  iACCMTB. (A) Comparative analysis of MetaCyc metabolic pathways predicted with the pathway tools software in at least one of the iACCMTB genomes. The full analysis is given in the Table S2. One of the most complete draft genomes of an iACCB affiliated with the Pseudomonadota (Achromatium palustre Sipp_2015) [75] was also added to the comparison. Genomes are grouped by Pseudomonadota classes (Alphaproteobacteria and Gammaproteobacteria) and orders (CAIRSR01 and Chromatiales). Metabolic pathways are organized based on a hierarchical clustering analysis (Euclidean distance clustering algorithm) according to their pair-wise distance. Absence of prediction can be linked to the absence of a single reaction / enzyme / gene mandatory for the pathway prediction. Yet, this absence can be a false negative and be linked to the quality of the draft genome assembly. No draft genome of satisfactory completeness rate was obtained for the species represented by morphotype 1. Note that: (i) the CCP4-SC76 genome is only 60% complete, which explains that less pathways were predicted and (ii), although the dissimilatory sulfate reduction pathway is predicted, it likely realizes the reverse sulfide oxidation in Gammaproteobacteria. (B) Presence / absence of some marker genes of interest for this study in iACCMTB genomes.

References

    1. Falkowski PG, Fenchel T, Delong EF. The microbial engines that drive Earth’s biogeochemical cycles. Science 2008;320:1034–9. 10.1126/science.1153213 - DOI - PubMed
    1. Berenjian A, Seifan M. Mineral Formation by Microorganisms: Concepts and Applications. Switzerland: Springer Nature, 2022.
    1. Bazylinski DA, Frankel RB. Magnetosome formation in prokaryotes. Nat Rev Microbiol 2004;2:217–30. 10.1038/nrmicro842 - DOI - PubMed
    1. Görgen S, Benzerara K, Skouri-Panet F et al. The diversity of molecular mechanisms of carbonate biomineralization by bacteria. Discov Mater 2020;1:2. 10.1007/s43939-020-00001-9 - DOI
    1. Gadd GM. Metals, minerals and microbes: geomicrobiology and bioremediation. Microbiol-Sgm 2010;156:609–43. 10.1099/mic.0.037143-0 - DOI - PubMed

LinkOut - more resources