. 2025 May;15(5):524-535.
doi: 10.1002/alr.23525. Epub 2025 Jan 8.

Machine Learning of Endoscopy Images to Identify, Classify, and Segment Sinonasal Masses

Affiliations

Machine Learning of Endoscopy Images to Identify, Classify, and Segment Sinonasal Masses

Lirit Levi et al. Int Forum Allergy Rhinol. 2025 May.

Abstract

Background: We developed and assessed the performance of a machine learning model (MLM) to identify, classify, and segment sinonasal masses based on endoscopic appearance.

Methods: A convolutional neural network-based model was constructed from nasal endoscopy images from patients evaluated at an otolaryngology center between 2013 and 2024. Images were classified into four groups: normal endoscopy, nasal polyps, benign, and malignant tumors. Polyps and tumors were confirmed with histopathological diagnosis. Images were annotated by an otolaryngologist and independently verified by two other otolaryngologists. We used high- and low-quality images to mirror real-world conditions. The models used for classification (EfficientNet-B2) and segmentation (nnUNet) were trained, validated, and tested at an 8:1:1 ratio. The performance accuracy was averaged across a 10-fold cross-validation assessment. Segmentation accuracy was assessed via Dice similarity coefficients.

Results: A total of 1242 images from 311 patients were used. The MLM was trained, validated, and tested on 663 normal, 276 polyps, 157 benign, and 146 malignant tumors images. Overall, the model performed at 84.1 ± 4.3% accuracy in the validation set and 80.4 ± 1.7% in the test set. The model correctly identified the presence of a sinonasal mass at 90.5 ± 1.2% accuracy rate. The MLM accuracy performance rates were 86.2 ± 1.0% for polyps and 84.1 ± 1.8% for tumors. Benign and malignant tumor subclassification achieved 87.8 ± 2.1% and 94.0 ± 2.4% accuracy, respectively. Segmentation accuracies for polyps were 72.3% and 72.8% for tumors.

Conclusions: An MLM for nasal endoscopy images can perform with moderate to high accuracy in identifying, classifying, and segmenting sinonasal masses. Performance in future iterations may improve with larger and more diverse training datasets.

Keywords: artificial intelligence; chronic rhinosinusitis; paranasal sinus diseases; polyp.


Conflict of interest statement

The authors declare they have no conflicts of interest.

Figures

FIGURE 1
FIGURE 1
Architecture of our classification model. (A) A classification system using EfficientNet‐B2. Images are first resized to 256 × 256, then center‐cropped to 224 × 224. These images are processed by EfficientNet‐B2, which extracts features through its layers. The extracted features are then fed into two classifiers: one that distinguishes between normal, polyp, and tumor images, and another that further categorizes them into normal, polyp, benign tumor, and malignant tumor. (B) Architecture of nnUNet Model used for segmentation. It starts by analyzing the training data to create a “data fingerprint,” and then determines key settings like image resizing, normalization, and model architecture based on specific rules and parameters. These settings guide the training process, including cross‐validation across different input types (2D, 3D, and 3D with context). Here, we only use 2D to generate the prediction mask. Finally, the model applies postprocessing and assembling techniques to enhance predictions on test data.
FIGURE 2
FIGURE 2
Mass versus non‐mass: binary classification performance. (A) True and predications confusion metrics for mass and non‐mass. (B) Binary performance metrics calculated for lesions versus normal images classifications and averaged over 10‐fold.
FIGURE 3
FIGURE 3
Overall and class specific diagnostic average performances for three classification model on test set: normal, polyp, and tumor. (A) Receiver operating characteristic (ROC) curve for each different classification—normal, polyp, and tumor. (B) True and predications confusion metrics for three classification model for test set. (C) Binary performance metrics calculated for each of the three classifications using test set and averaged over 10 models created by 10‐fold cross‐validation.
FIGURE 4
FIGURE 4
Attention maps for the classification model generated through Grad‐CAM technique. Examples of test set images alongside their corresponding attention maps, which are displayed as heat maps, are provided. The color blue indicates greater influence on the classification decision. Examples of correct prediction for (A) normal, (B) polyp, and (C) tumor classification, with their corresponding attention maps. Examples of misclassified model predictions with their corresponding attention maps: (D) normal image misclassified as polyp. (E) Polyp image misclassified as normal. (F) Tumor on the lateral nasal wall misclassified as a normal.
FIGURE 5
FIGURE 5
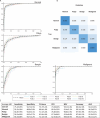
Overall and class specific diagnostic average performances for 10‐fold cross‐validation for four classification model: normal, polyp, benign tumor, and malignant tumor. (A) Receiver operating characteristic (ROC) curve for each different classification—normal, polyp, benign, and malignant. (B) True and prediction confusion metrics for four classification model for test set. (C) Binary performance metrics calculated for each of the four classifications using test set and averaged over 10 models created by 10‐fold cross‐validation.
FIGURE 6
FIGURE 6
Segmentation model. The figure demonstrates examples of the model's segmentation accuracy. (A) Accurate segmentations for polyp (a) and tumors (b and c). (B) Inaccurate segmentations for tumor (a and b) and polyp (c). The left column displays the original endoscopic images. The middle column shows images with expert annotations in red (upper image) and segmentation by the convolutional neural network (CNN) model in blue (lower image). The right column presents the merged views, combining expert annotations with the CNN segmentations, to illustrate the comparison between the two.
FIGURE 7
FIGURE 7
Examples for benign and malignant tumors. The figure provides examples of various malignant and benign pathologies, illustrating the similarities between the two groups. (A) Chondrosarcoma, (B) squamous cell carcinoma, (C) squamous cell carcinoma, (D) melanoma, (E) squamous cell carcinoma in inverted papilloma, (F) sinonasal undifferentiated carcinoma, (G) esthesioneuroblastoma, and (H) sinonasal pleomorphic sarcoma. Benign tumors: (a) schwannoma, (b) sinonasal papilloma, exophytic type, (c) capillary hemangioma, (d) capillary hemangioma, (e) inverted papilloma, (f) inverted papilloma, (g) juvenile angiofibroma, and (h) sinonasal neurofibroma.

References

    1. Silva M. P., Pinto J. M., Corey J. P., Mhoon E. E., Baroody F. M., and Naclerio R. M., “Diagnostic Algorithm for Unilateral Sinus Disease: A 15‐Year Retrospective Review,” International Forum of Allergy & Rhinology 5, no. 7 (2015): 590–596, 10.1002/alr.21526. - DOI - PMC - PubMed
    1. Tabaee A., Hsu A. K., and Kacker A., “Indications, Technique, Safety, and Accuracy of Office‐Based Nasal Endoscopy With Biopsy for Sinonasal Neoplasm,” International Forum of Allergy & Rhinology 1, no. 3 (2011): 225–228, 10.1002/alr.20035. - DOI - PubMed
    1. Chang M. T., Jitaroon K., Nguyen T., et al., “Hemodynamic Changes in Patients Undergoing Office‐Based Sinus Procedures Under Local Anesthesia,” International Forum of Allergy & Rhinology 10, no. 1 (2020): 114–120, 10.1002/alr.22460. - DOI - PubMed
    1. Goel A. N., Lee J. T., Wang M. B., and Suh J. D., “Treatment Delays in Surgically Managed Sinonasal Cancer and Association With Survival,” The Laryngoscope 130, no. 1 (2020): 2–11, 10.1002/lary.27892. - DOI - PubMed
    1. Guidozzi N., Menon N., Chidambaram S., and Markar S. R., “The Role of Artificial Intelligence in the Endoscopic Diagnosis of Esophageal Cancer: A Systematic Review and Meta‐Analysis,” Diseases of the Esophagus 36, no. 12 (2023): doad048, 10.1093/dote/doad048. - DOI - PMC - PubMed