. 2024 Dec 24:12:1440673.
doi: 10.3389/fpubh.2024.1440673. eCollection 2024.

Enhancing mass vaccination programs with queueing theory and spatial optimization

Affiliations

Enhancing mass vaccination programs with queueing theory and spatial optimization

Sherrie Xie et al. Front Public Health. .

Abstract

Background: Mass vaccination is a cornerstone of public health emergency preparedness and response. However, injudicious placement of vaccination sites can lead to the formation of long waiting lines or queues, which discourages individuals from waiting to be vaccinated and may thus jeopardize the achievement of public health targets. Queueing theory offers a framework for modeling queue formation at vaccination sites and its effect on vaccine uptake.

Methods: We developed an algorithm that integrates queueing theory within a spatial optimization framework to optimize the placement of mass vaccination sites. The algorithm was built and tested using data from a mass dog rabies vaccination campaign in Arequipa, Peru. We compared expected vaccination coverage and losses from queueing (i.e., attrition) for sites optimized with our queue-conscious algorithm to those used in a previous vaccination campaign, as well as to sites obtained from a queue-naïve version of the same algorithm.

Results: Sites placed by the queue-conscious algorithm resulted in 9-32% less attrition and 11-12% higher vaccination coverage compared to previously used sites and 9-19% less attrition and 1-2% higher vaccination coverage compared to sites placed by the queue-naïve algorithm. Compared to the queue-naïve algorithm, the queue-conscious algorithm placed more sites in densely populated areas to offset high arrival volumes, thereby reducing losses due to excessive queueing. These results were not sensitive to misspecification of queueing parameters or relaxation of the constant arrival rate assumption.

Conclusion: One should consider losses from queueing to optimally place mass vaccination sites, even when empirically derived queueing parameters are not available. Due to the negative impacts of excessive wait times on participant satisfaction, reducing queueing attrition is also expected to yield downstream benefits and improve vaccination coverage in subsequent mass vaccination campaigns.

Keywords: One Health; emergency preparedness; facility location; mass vaccination; queueing theory; rabies; spatial optimization; zoonosis.


Conflict of interest statement

The authors declare that the research was conducted in the absence of any commercial or financial relationships that could be construed as a potential conflict of interest.

Figures

Figure 1
Figure 1
An M/M/1 first-in-first-out queueing model for an MDVC vaccination site. (A) Illustrates the processes captured by the queueing model, with the forms of queuing attrition highlighted by the red boxes. (B) Shows the transition-state diagram for the queueing model, where states, depicted by circles, are defined by the number of dogs in the system, and transitions between states, depicted with curved arrows, are labeled by their corresponding transition rates.
Figure 2
Figure 2
Potential vaccination site locations in Alto Selva Alegre. The boundaries of Alto Selva Alegre are depicted by the solid, black line. Candidate MDVC sites (N = 70) are indicated by red diamonds, and the locations of houses are shaded brown.
Figure 3
Figure 3
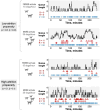
Realized trials of the stochastic queueing model. Each trial of the stochastic queueing simulation represents a single four-hour day at an MDVC site. The gray-shaded portion of each plot tracks the queue length over the four-hour period, and the colored shapes in the white portion of each plot tracks the occurrences of balking (red triangles), reneging (red diamonds) and vaccination (blue circles). The number of balking events (B), reneging events (R), and vaccinations (V) are reported for each trial. Trials are shown for two different α/β parameter regimes (low: α = 0.01, β = 0.02 and high: α = 0.1, β = 0.1) and two different arrival rates (15 and 30 dogs per hour).
Figure 4
Figure 4
Arrivals histograms for sites selected by queue-naïve and queue-conscious optimization compared to actual sites used in the 2016 MDVC assuming low- and high-attrition parameter values. The height of each stacked bar represents the expected number of dogs that arrive at a selected vaccination site. Bars are subdivided by color according to whether dogs ultimately get vaccinated (blue) or are lost to attrition, either through balking (dark red) or reneging (light red). The text above the bars gives the total number of arrivals, total losses to attrition, and overall vaccination coverage achieved for each set of sites. Top row shows results assuming a low-attrition parameter regime, and bottom row shows results for a high-attrition parameter regime. The number of dogs vaccinated and the number of dogs lost to attrition for all situations were determined using Equation 6 and the equations outlined in the electronic Supplementary Text A.
Figure 5
Figure 5
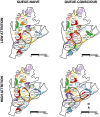
Locations of MDVC sites selected by the queue-naïve vs. queue-conscious algorithm for the low- and high-attrition systems. The locations of selected vaccination sites are indicated by white circles that are labeled and scaled according to the expected number of arriving dogs, which were calculated using Equation 6. Top row shows results for the low-attrition system, and bottom row shows results for the high-attrition system. Houses in the study area are small dots colored according to their catchment, representing the area in which a MDVC site is the closest site for houses in terms of travel distance. Areas in which the queue-conscious algorithm placed a higher density of vaccination sites compared to the queue-naïve algorithm are indicated by ellipses with solid lines, and areas in which the queue-conscious algorithm placed one fewer site are indicated by ellipses with dotted lines.
Figure 6
Figure 6
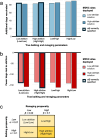
Sensitivity of results to misspecification of balking and reneging parameters. Panels a-b illustrate how misspecification of α and β impacts the expected number of dogs vaccinated (A) and the number of dogs lost to attrition (B). The performance of the low- and high-attrition solutions are provided with the queue-naïve solution acting as a benchmark; thus (A) shows the additional number of dogs vaccinated beyond the expected number achieved with the queue-naïve solution, and (B) shows the reduction in attrition compared to the queue-naïve solution. Bars outlined in bold represent scenarios in which the balking and reneging parameters are correctly estimated in the optimization. (C) Provides a legend with the values of α and β for the four balking/reneging scenarios considered.

Update of

Similar articles

Cited by

References

    1. Bleustein C, Rothschild DB, Valen A, Valatis E, Schweitzer L, Jones R. Wait times, patient satisfaction scores, and the perception of care. Am J Manag Care. (2014) 20:393–400. PMID: - PubMed
    1. Ward PR, Rokkas P, Cenko C, Pulvirenti M, Dean N, Carney AS, et al. . ‘Waiting for’ and ‘waiting in’ public and private hospitals: a qualitative study of patient trust in South Australia. BMC Health Serv Res. (2017) 17:333. doi: 10.1186/s12913-017-2281-5, PMID: - DOI - PMC - PubMed
    1. Embrett M, Sim SM, Caldwell HAT, Boulos L, Yu Z, Agarwal G, et al. . Barriers to and strategies to address COVID-19 testing hesitancy: a rapid scoping review. BMC Public Health. (2022) 22:750. doi: 10.1186/s12889-022-13127-7, PMID: - DOI - PMC - PubMed
    1. Goralnick E, Kaufmann C, Gawande AA. Mass-vaccination sites — an essential innovation to curb the Covid-19 pandemic. N Engl J Med. (2021) 384:e67. doi: 10.1056/NEJMp2102535, PMID: - DOI - PubMed
    1. Rosner E, Lapin T, Garger K. (2021). Hours-long waits reported at Javits center COVID vaccine site in NYC. New York Post. Available at: https://nypost.com/2021/03/02/hours-long-waits-reported-at-javits-center... (Accessed March 2, 2021).

Substances

LinkOut - more resources