. 2024 Nov 11:4:e11.
doi: 10.1017/S2633903X24000102. eCollection 2024.

Topology-based segmentation of 3D confocal images of emerging hematopoietic stem cells in the zebrafish embryo

Affiliations

Topology-based segmentation of 3D confocal images of emerging hematopoietic stem cells in the zebrafish embryo

G Nardi et al. Biol Imaging. .

Abstract

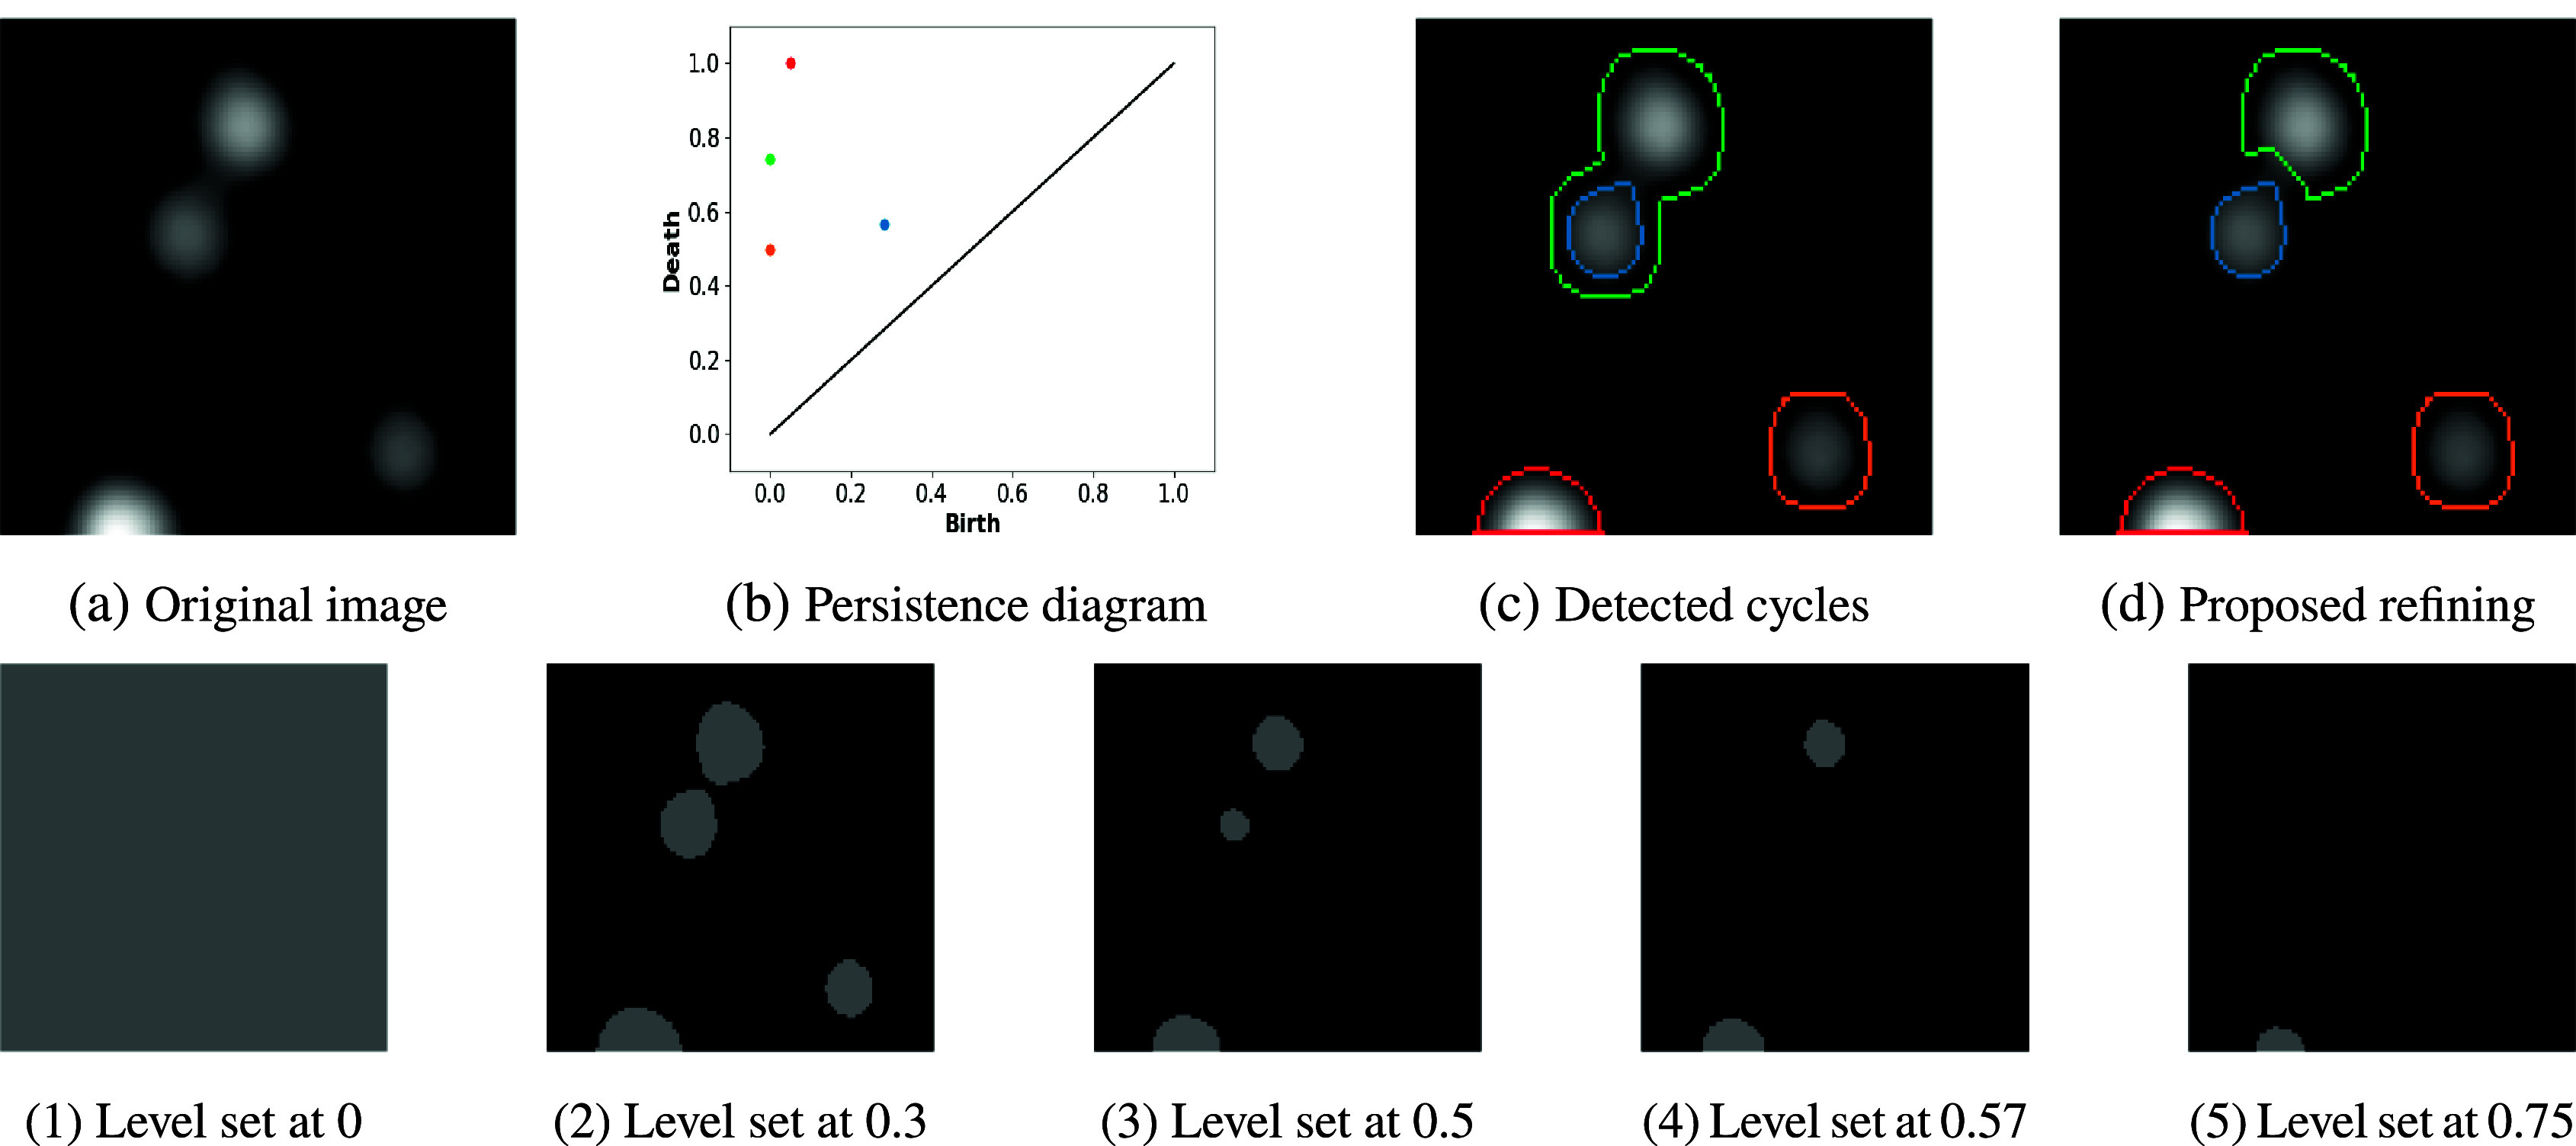
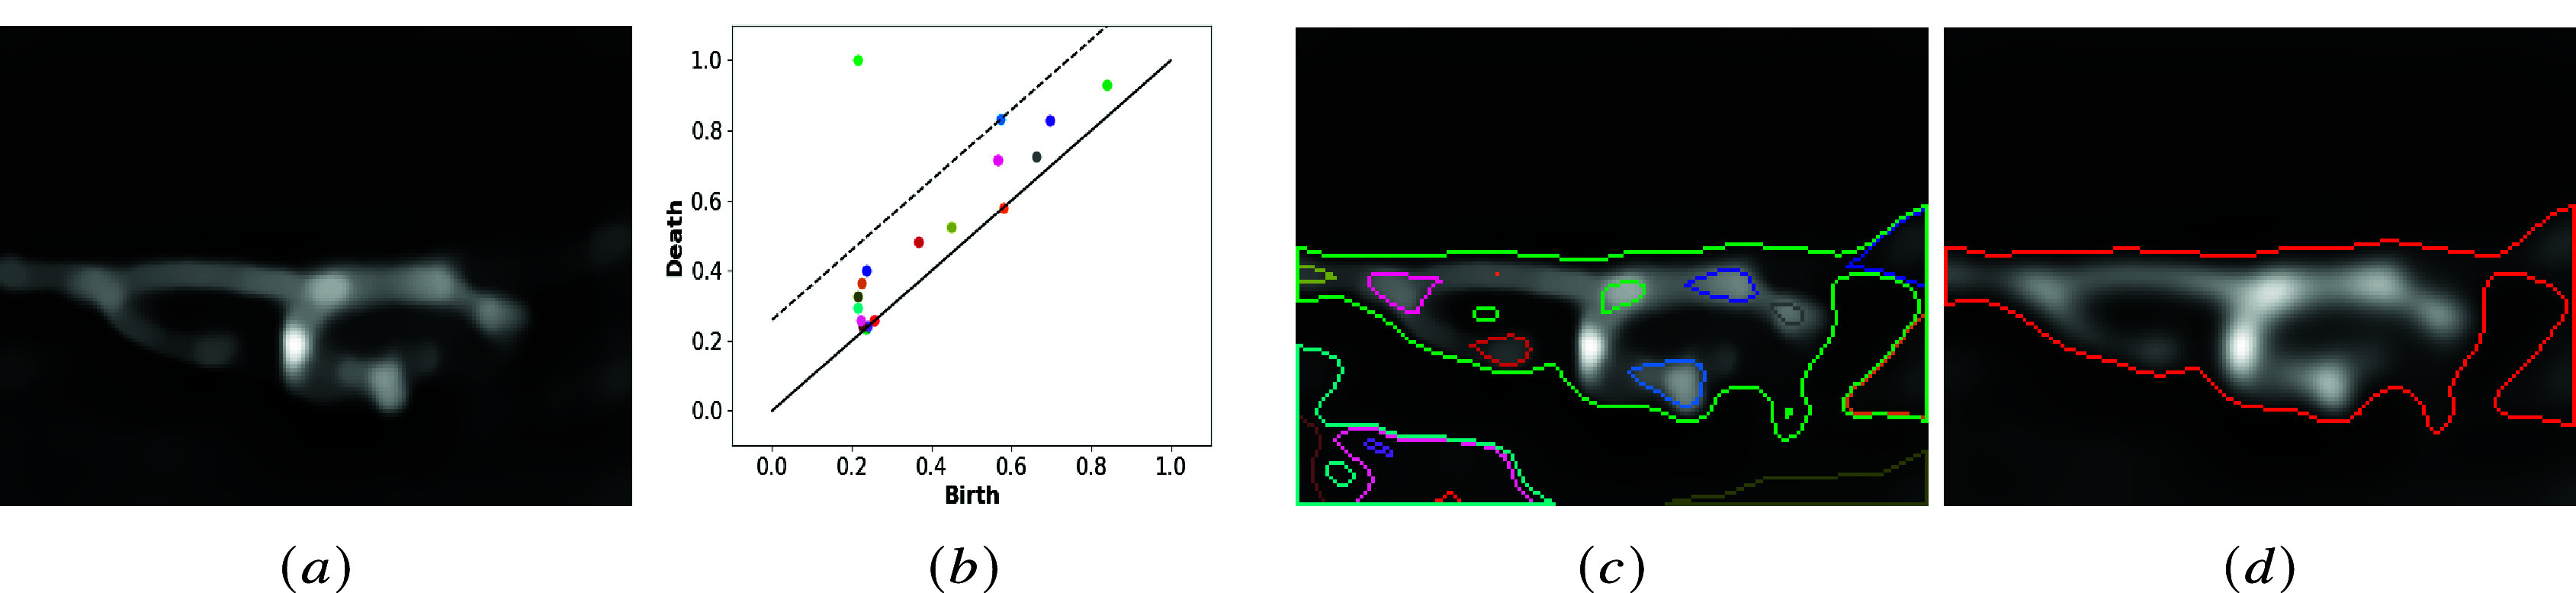
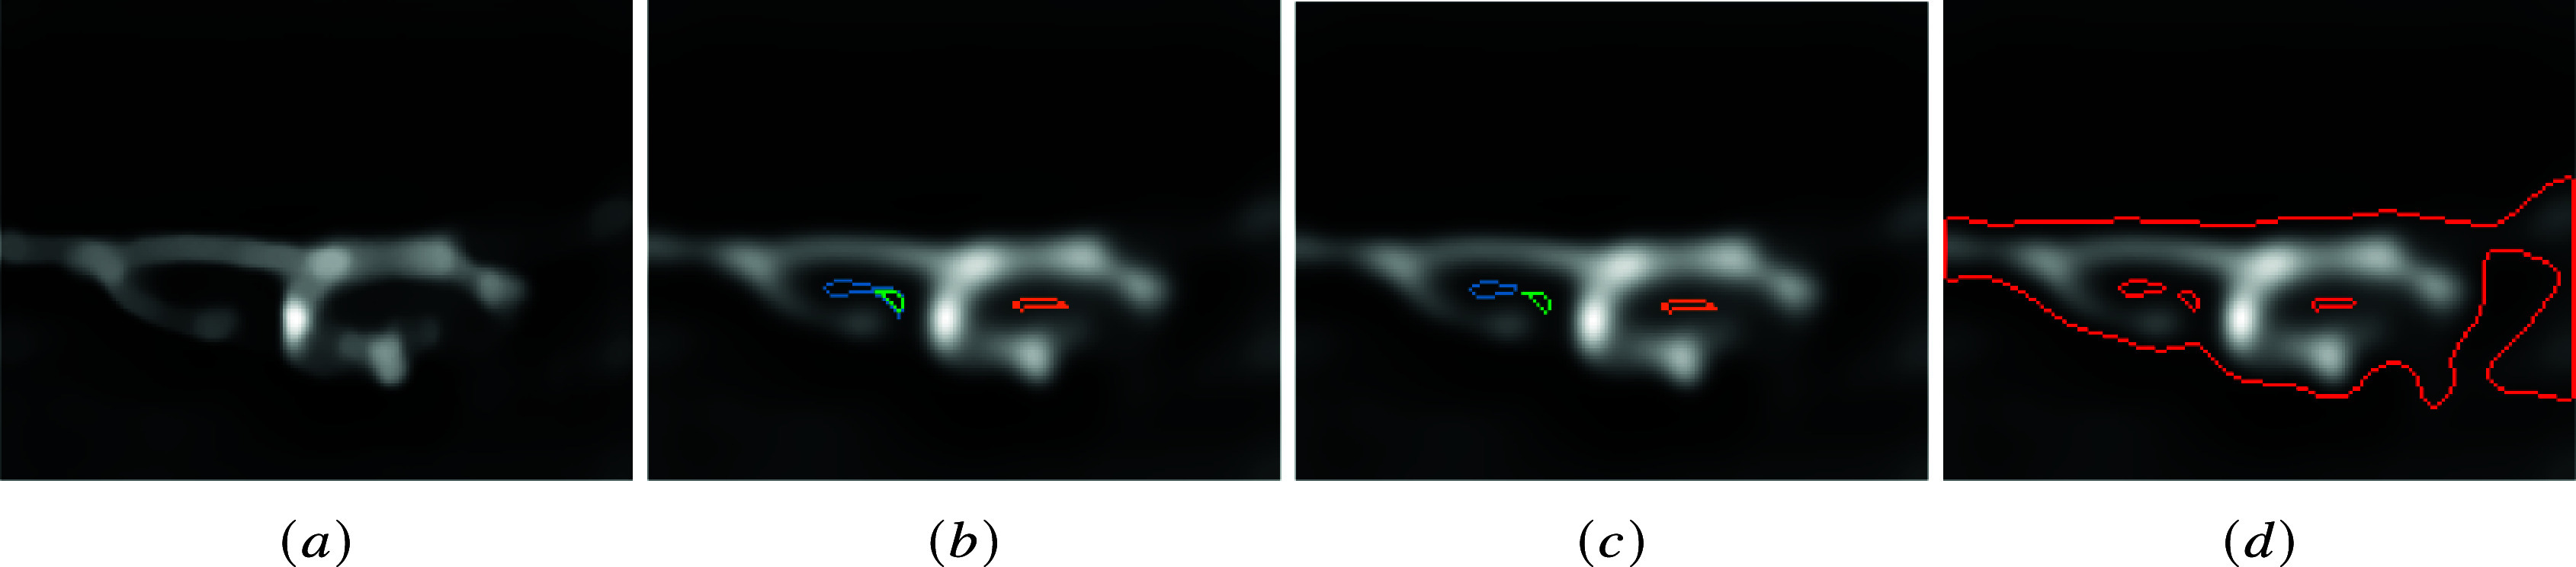
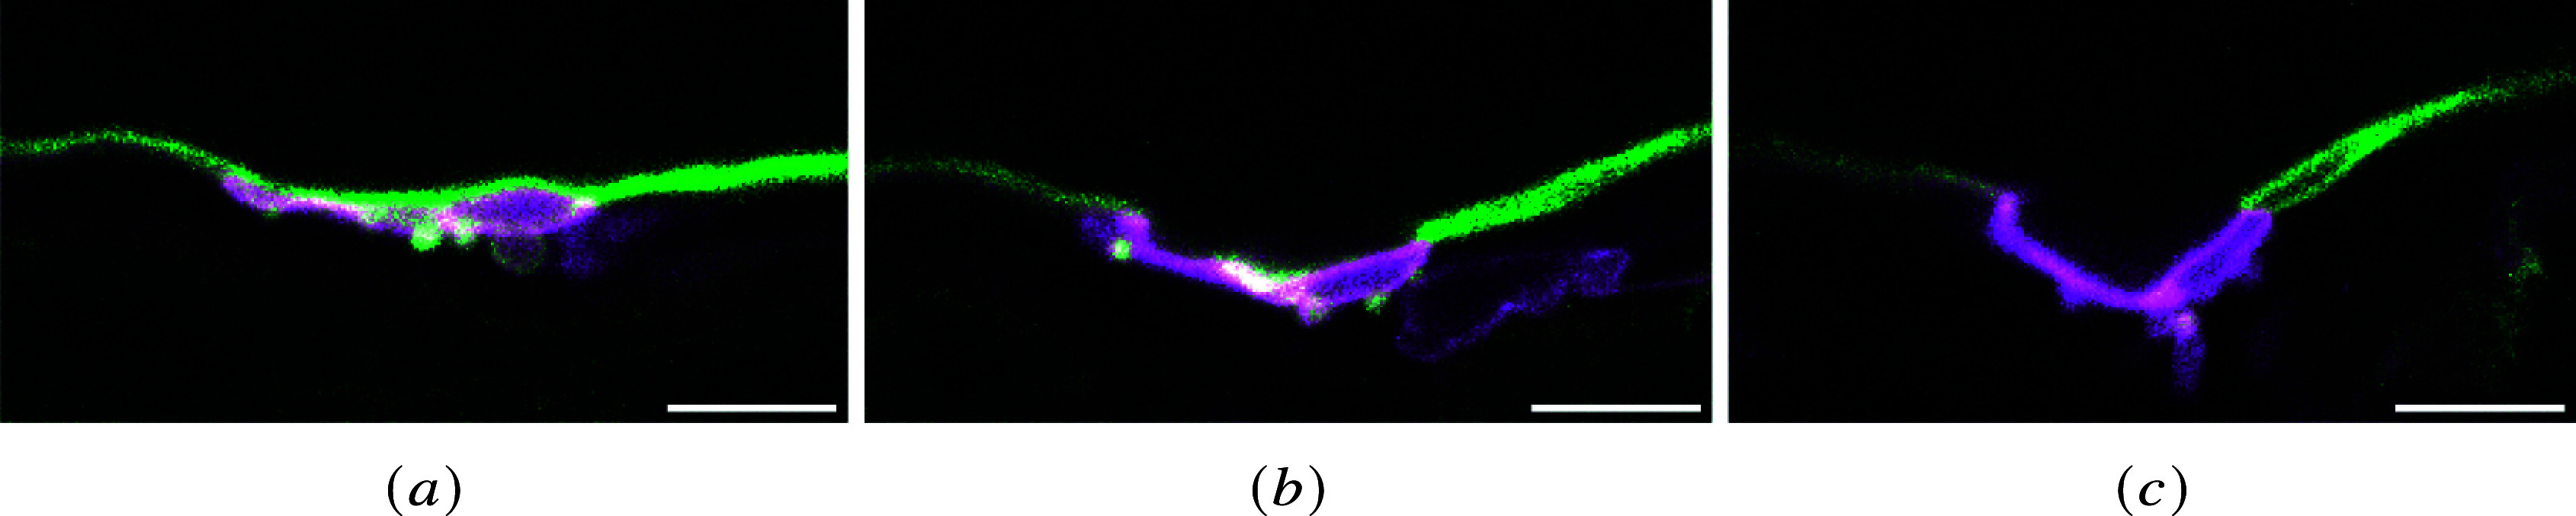
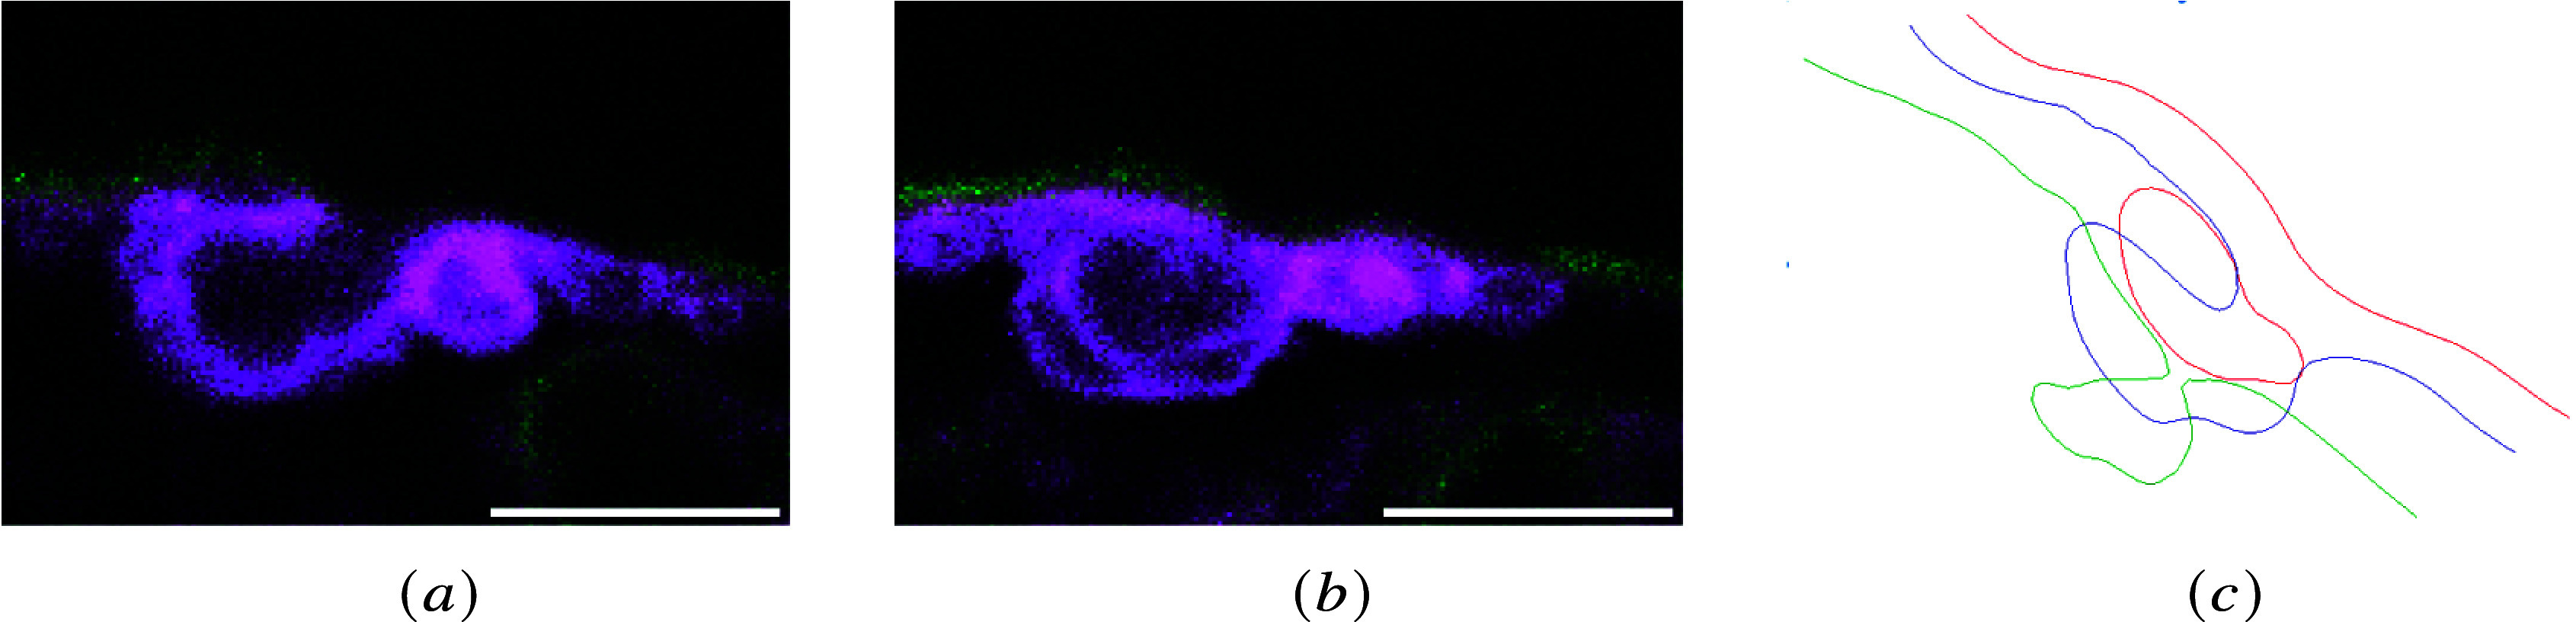
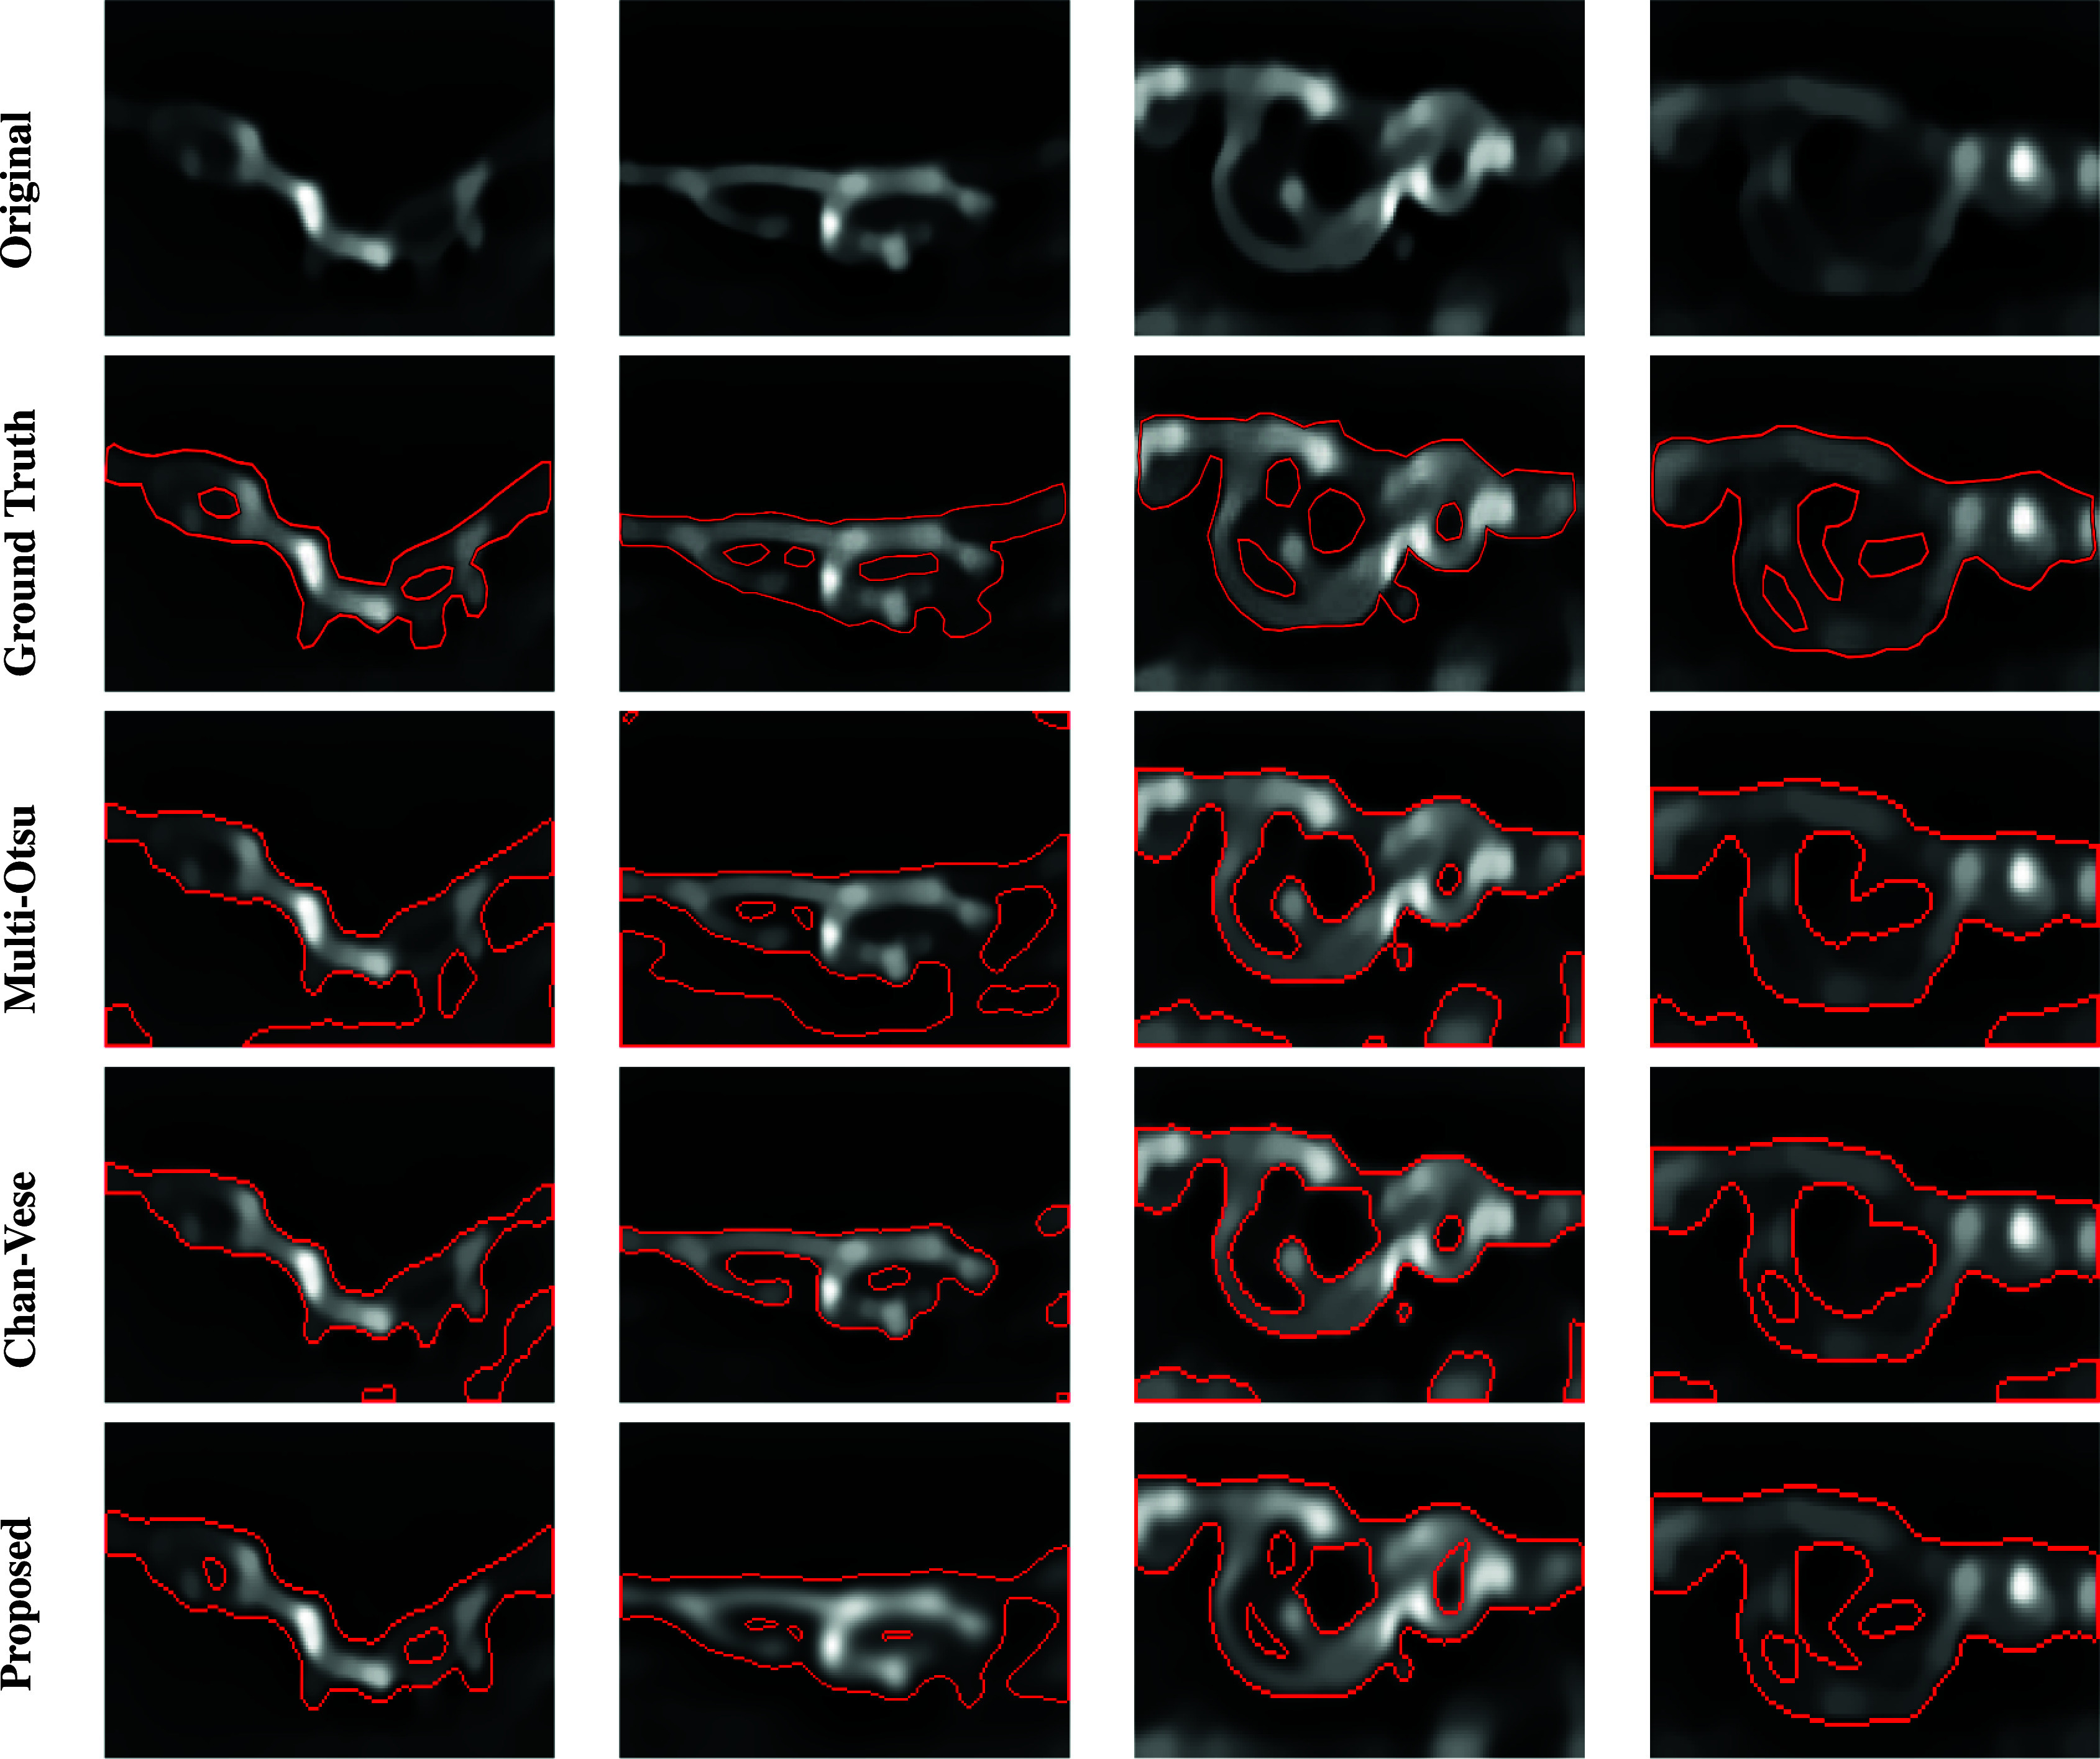
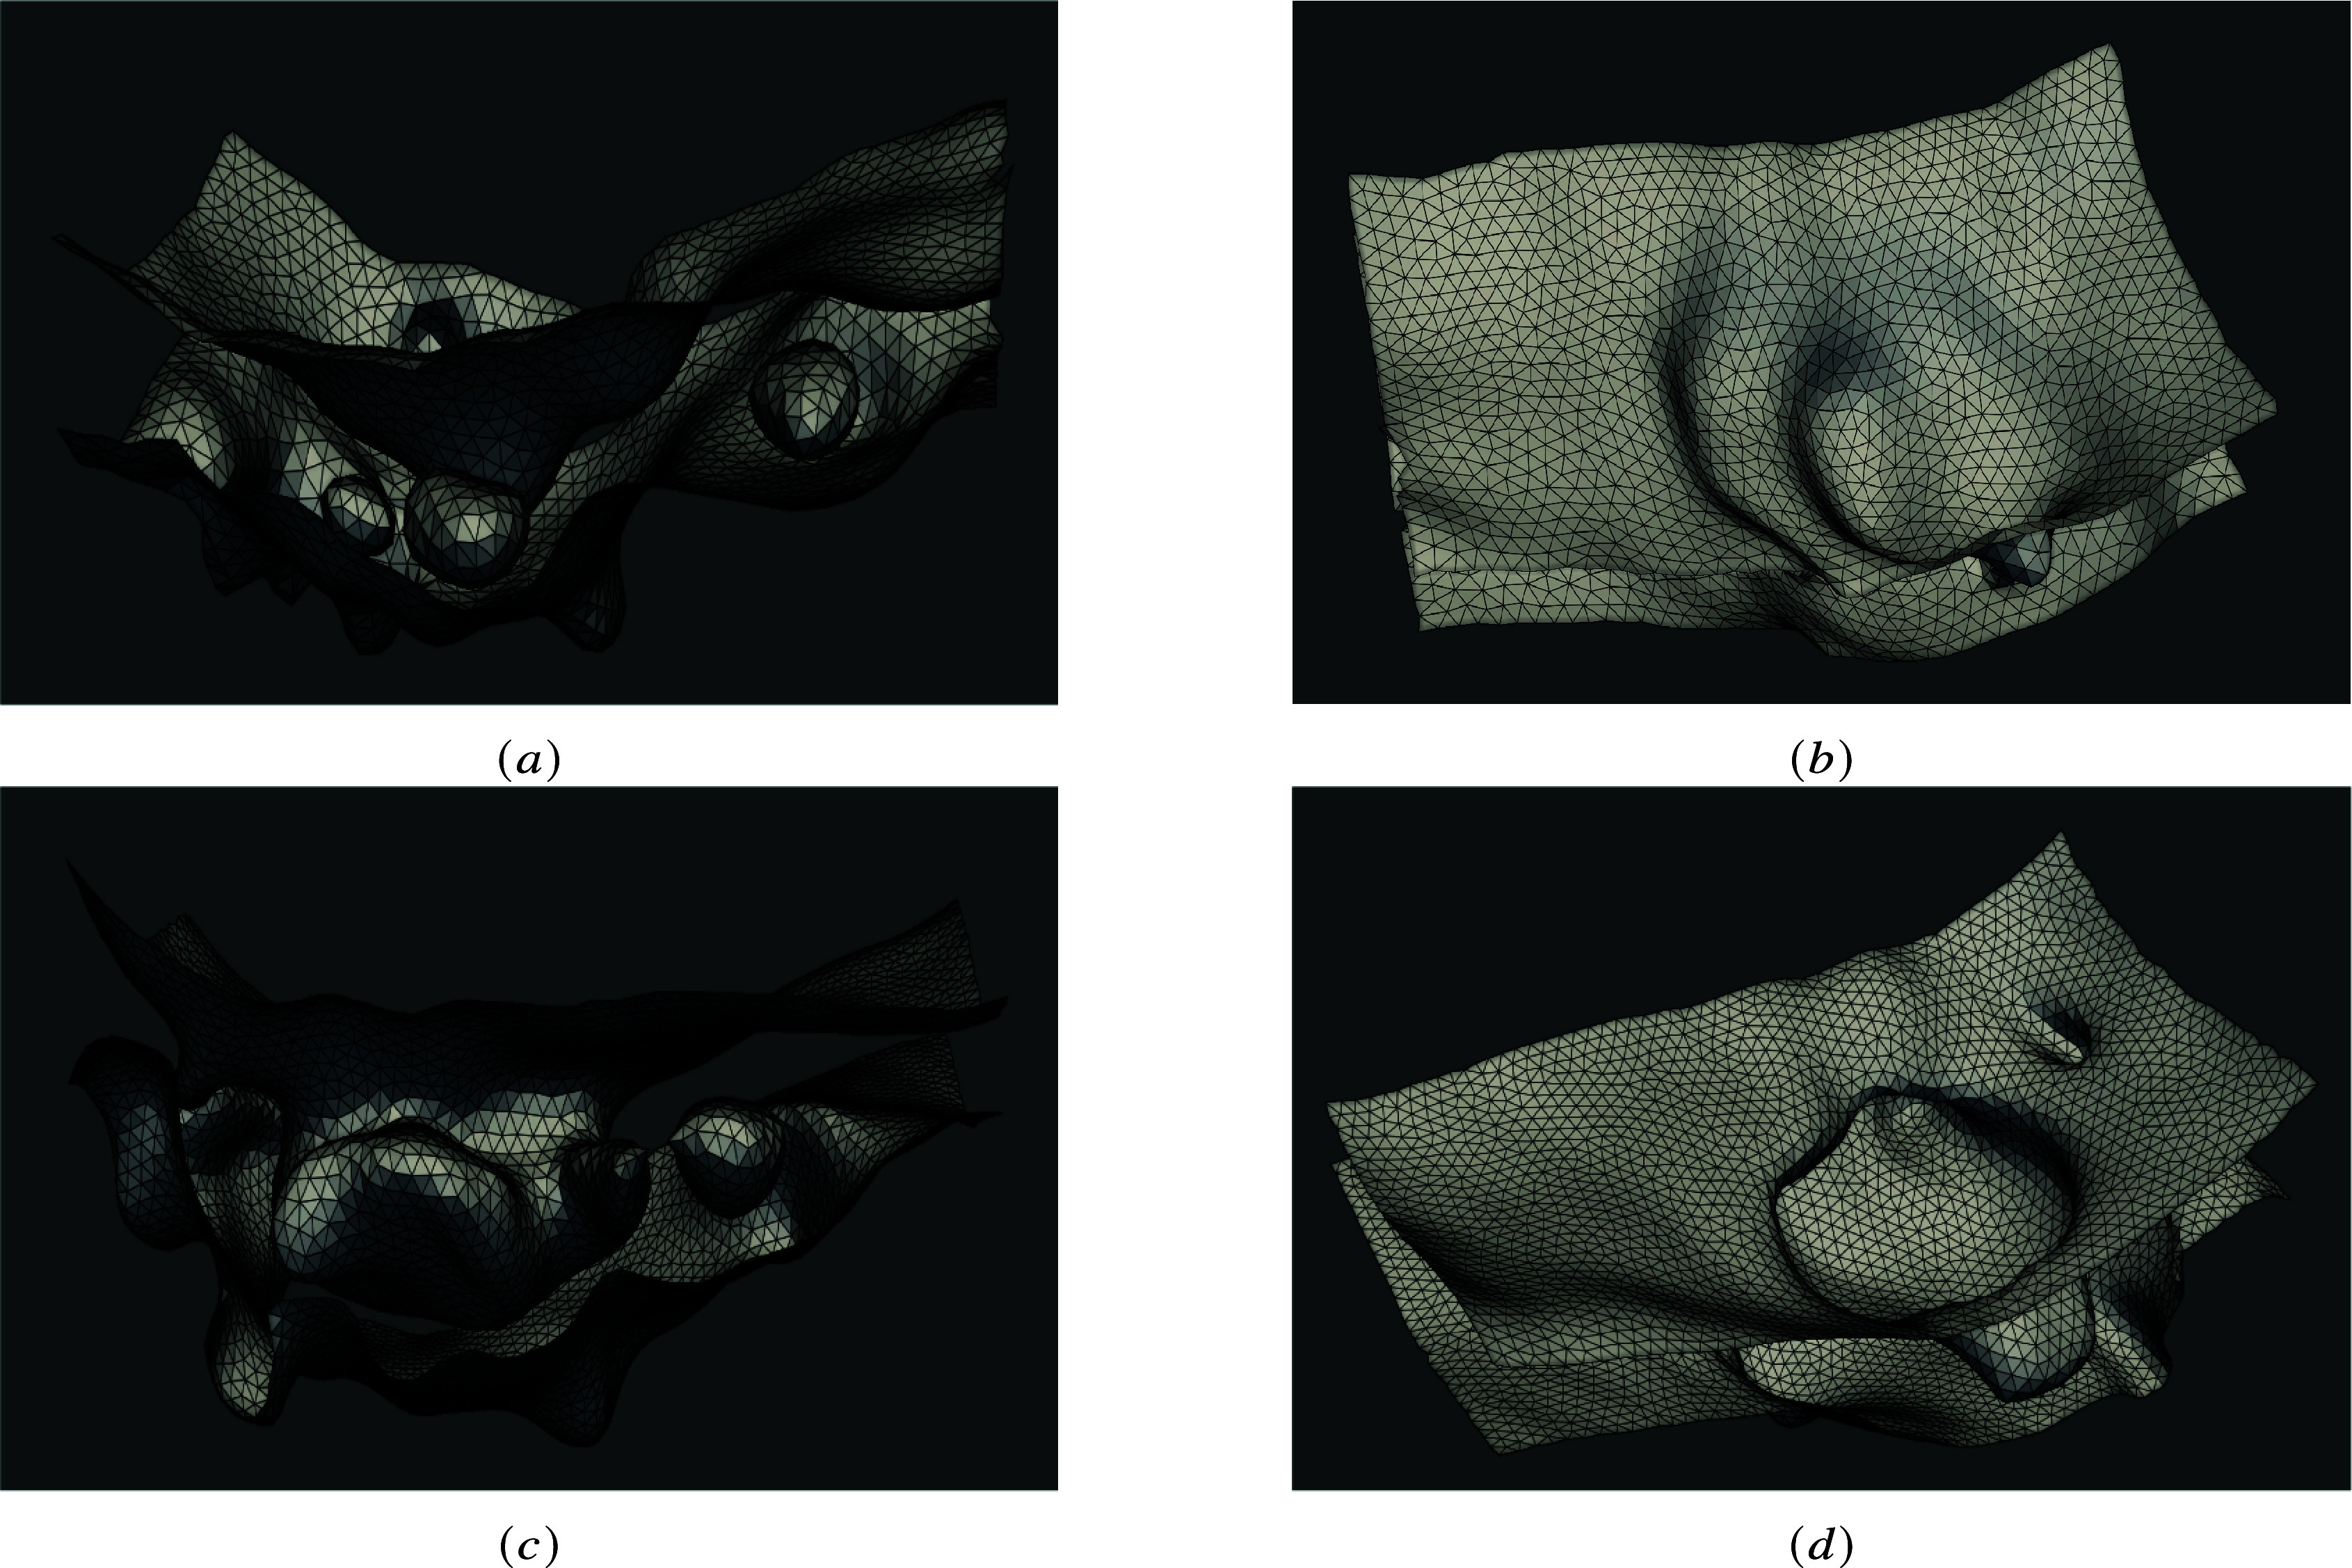
We develop a novel method for image segmentation of 3D confocal microscopy images of emerging hematopoietic stem cells. The method is based on the theory of persistent homology and uses an optimal threshold to select the most persistent cycles in the persistence diagram. This enables the segmentation of the image's most contrasted and representative shapes. Coupling this segmentation method with a meshing algorithm, we define a pipeline for 3D reconstruction of confocal volumes. Compared to related methods, this approach improves shape segmentation, is more ergonomic to automatize, and has fewer parameters. We apply it to the segmentation of membranes, at subcellular resolution, of cells involved in the endothelial-to-hematopoietic transition (EHT) in the zebrafish embryos.

Keywords: 3D segmentation; cell evolution; meshing; morphogenesis; persistent homology.


Conflict of interest statement

The authors declare no competing interests exist.

Figures

Figure 1.
Figure 1.
Filtration of lower-level sets and segmentation based on persistent diagram. Top panel: different steps of cycle segmentation based on the persistent diagram: (b) and (c) show the correspondence between points of the persistent diagram and related representatives, (d) shows the result of the refinement method for nested cycles proposed in this work. Bottom panel: image-level sets corresponding to birth and death intensity values of cycles belonging to the persistent diagram.
Figure 2.
Figure 2.
Segmentation of cell membranes: (a) the deconvolved original image; (b) persistence diagram and related optimum threshold (dashed line); (c) all the cycles displayed with the respective color used in (b); and (d) selected cycle with persistence larger than the optimum threshold.
Figure 3.
Figure 3.
Segmentation of internal cavities: (a) the deconvolved original image; (b) case of nested cycles; (c) separation of nested cycles; and (d) internal holes are drawn with the membrane profile.
Figure 4.
Figure 4.
Example of longitudinal sections of the ventral floor of the dorsal aorta (the scale bar corresponds to formula image ). From left to right, the figures show three typical sequential stages of the EHT: the flat shape of endothelial cells (a) becomes increasingly curved (b), and the central invagination gradually closes in on itself (c). Magenta: ras-mCherry recruited on plasma membranes; Green: the membrane marker podocalyxin fused with eGPF and enriched in the luminal membrane.
Figure 5.
Figure 5.
Different images from the same z-stack (the scale bar corresponds to formula image ). (a) membrane profile corresponding to the luminal opening of the invagination of the luminal membrane and a circular cavity corresponding to a bleb; (b) membrane profile showing different cavities below the luminal membrane: the central cavity is a section of the ramified invagination, and the others beneath correspond to cytoplasmic voids; and (c) the cartoon shows a schematic representation of different longitudinal sections of the luminal membrane within the same z-stack.
Figure 6.
Figure 6.
Comparison of segmentation approaches. From top to bottom: deconvolved original image, ground-truth, multi-Otsu thresholding, Chan-Vese method, and proposed method.
Figure 7.
Figure 7.
Membrane reconstruction. The meshes corresponding to different stages of the EHT are shown (90 min separate the acquisition timing between the top and the bottom panels). (a, c) a longitudinal view is shown, and we can observe the interior voids and blebs at the basal membrane and (b, d) the luminal part of the cellular membrane is shown, with its quite significant deepening and increased curvature at the rim (see (d)).

References

    1. Liao P-S, Chen T-S, Chung P-C, et al. (2001) A fast algorithm for multilevel thresholding. Journal of Information Science and Engineering 17(5), 713–727.
    1. Achanta R, Shaji A, Smith K, Lucchi A, Fua P and Süsstrunk S (2012) SLIC superpixels compared to state-of-the-art superpixel methods. IEEE Transactions on Pattern Analysis and Machine Intelligence 34(11), 2274–2282. - PubMed
    1. Chan T and Vese L (1999) An active contour model without edges. In International Conference on Scale-Space Theories in Computer Vision, pp. 141–151. Springer.
    1. Marquez-Neila P, Baumela L and Alvarez L (2013) A morphological approach to curvature-based evolution of curves and surfaces. IEEE Transactions on Pattern Analysis and Machine Intelligence 36(1), 2–17. - PubMed
    1. Schott B, Traub M, Schlagenhauf C, Takamiya M, Antritter T, Bartschat A, Löffler K, Blessing D, Otte JC, Kobitski AY et al. (2018) EmbryoMiner: A new framework for interactive knowledge discovery in large-scale cell tracking data of developing embryos. PLOS Computational Biology 14(4), e1006128. - PMC - PubMed

LinkOut - more resources