. 2024 Dec 16:4:e15.
doi: 10.1017/S2633903X24000163. eCollection 2024.

The quest for early detection of retinal disease: 3D CycleGAN-based translation of optical coherence tomography into confocal microscopy

Affiliations

The quest for early detection of retinal disease: 3D CycleGAN-based translation of optical coherence tomography into confocal microscopy

Xin Tian et al. Biol Imaging. .

Abstract

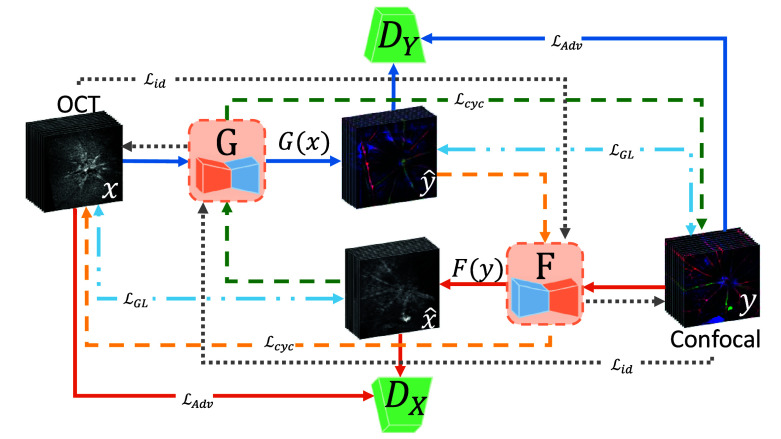
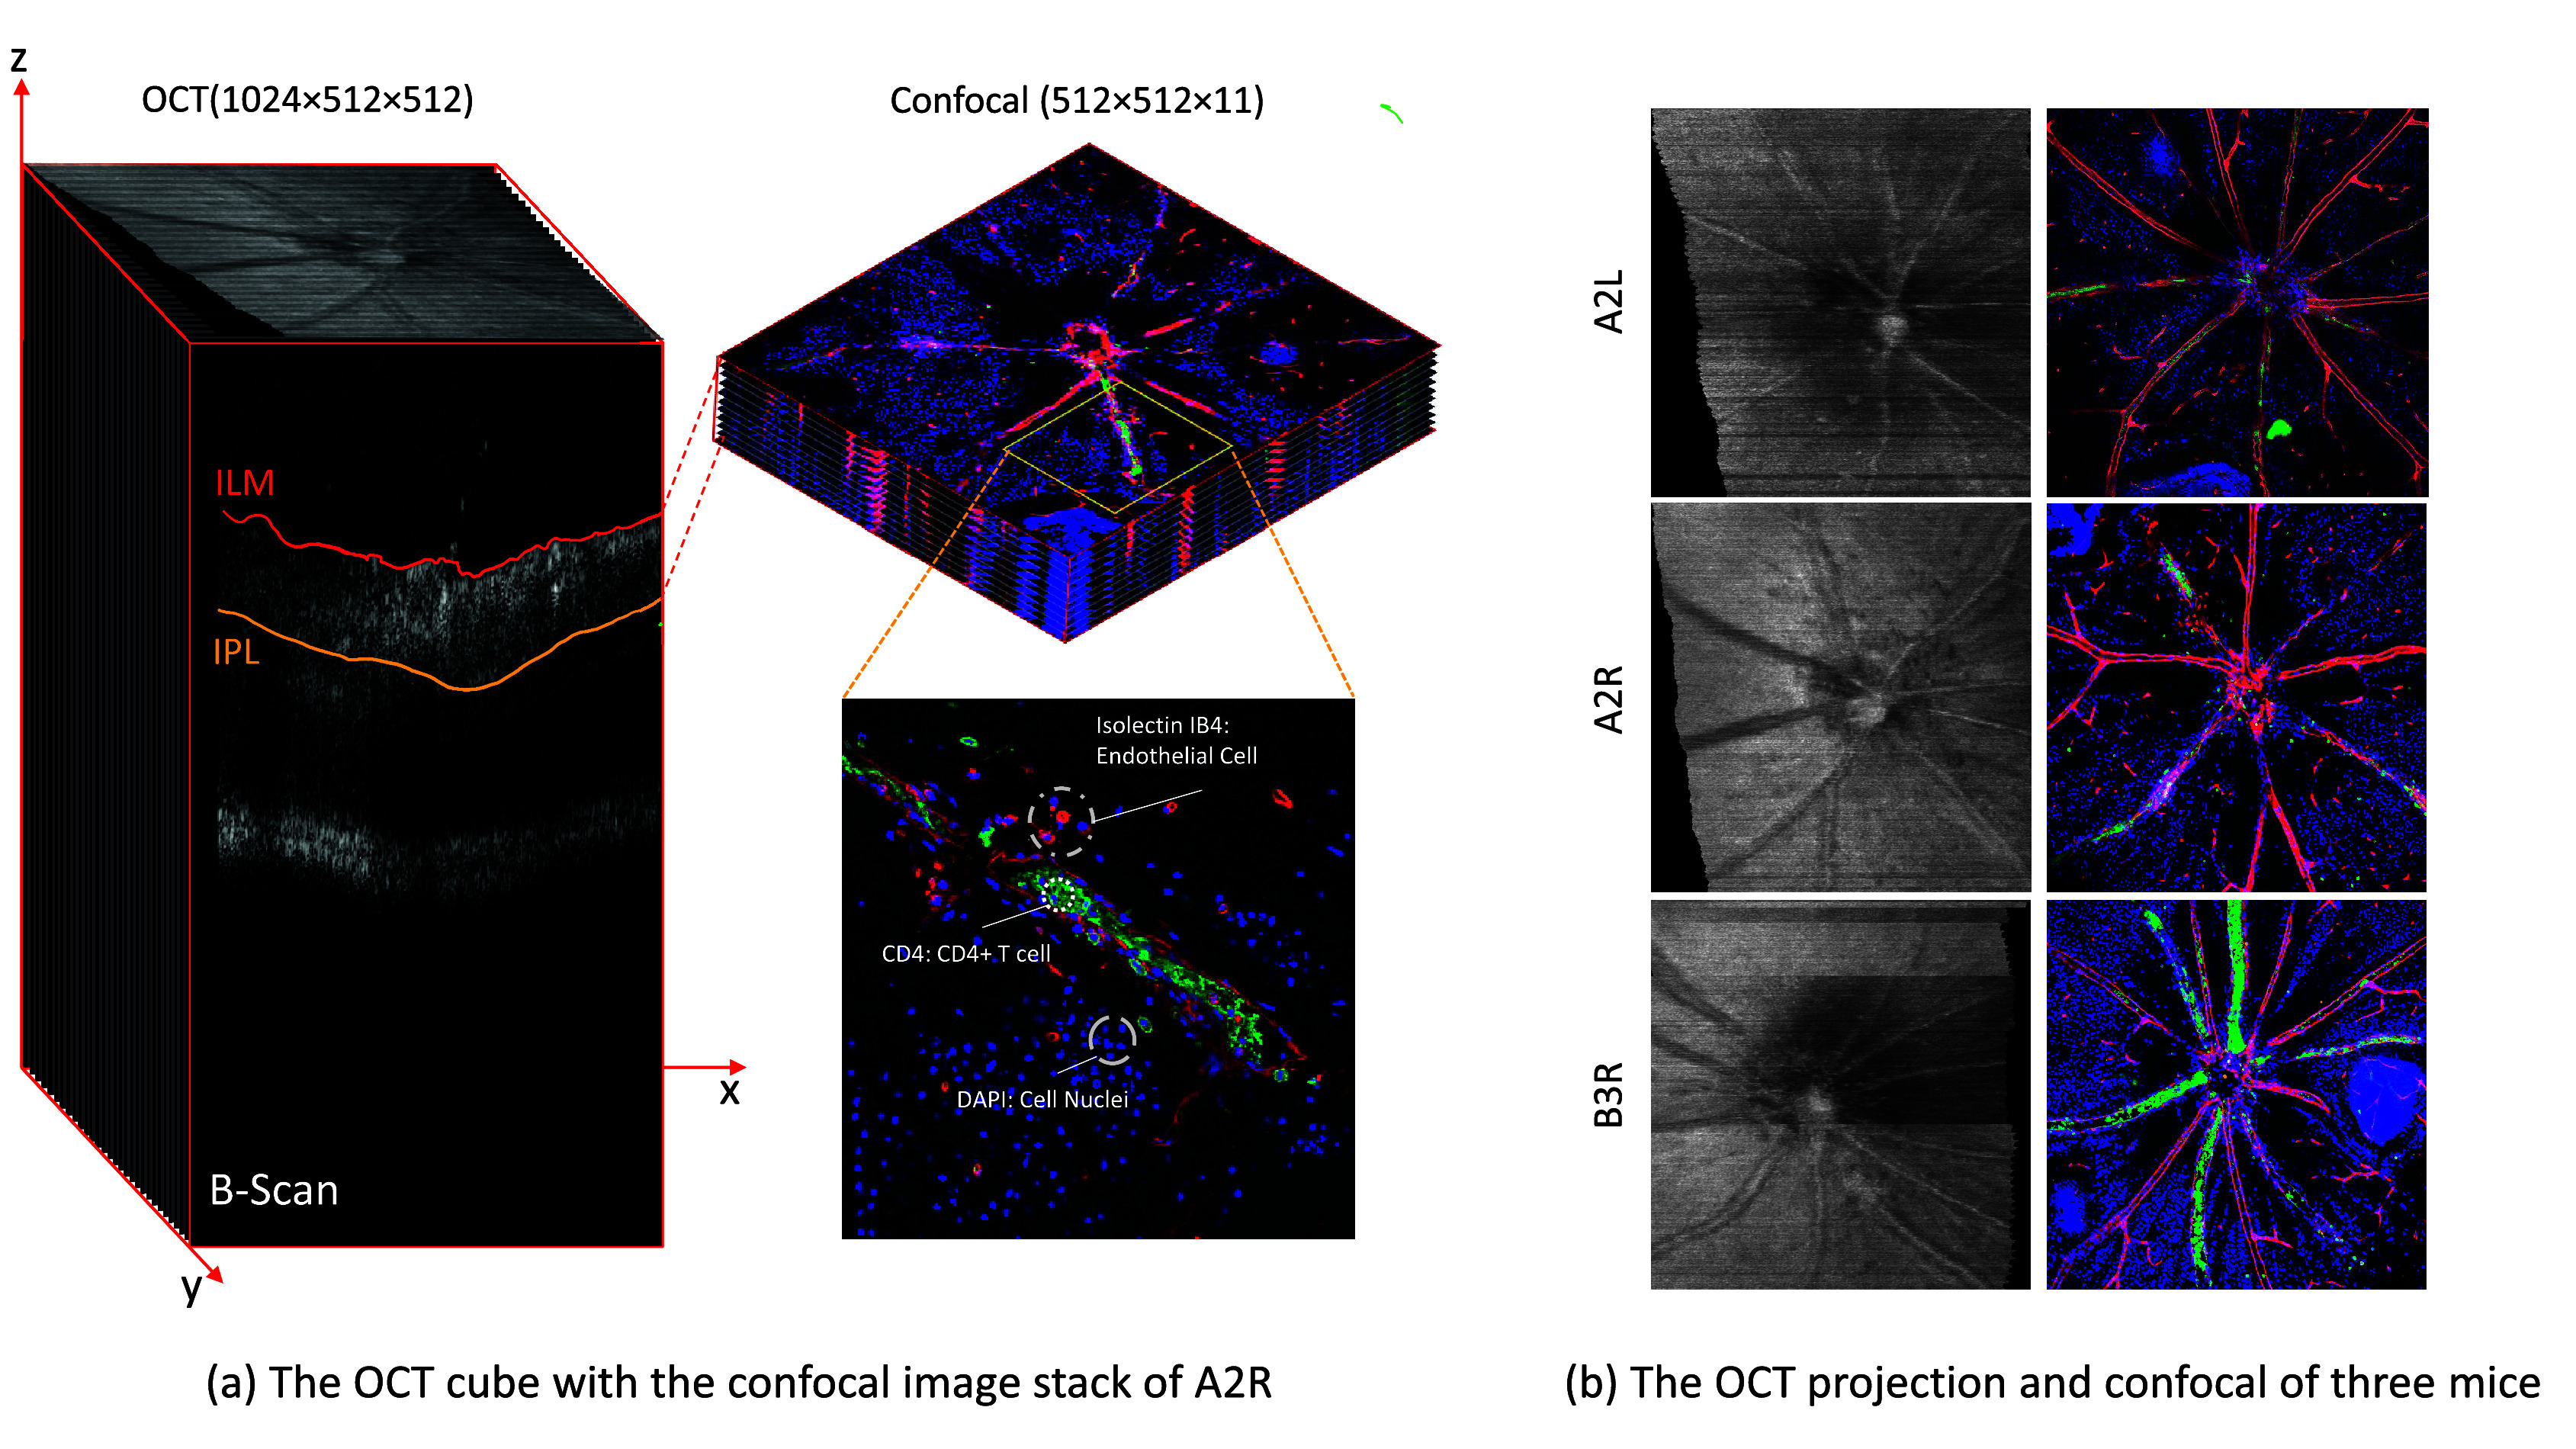
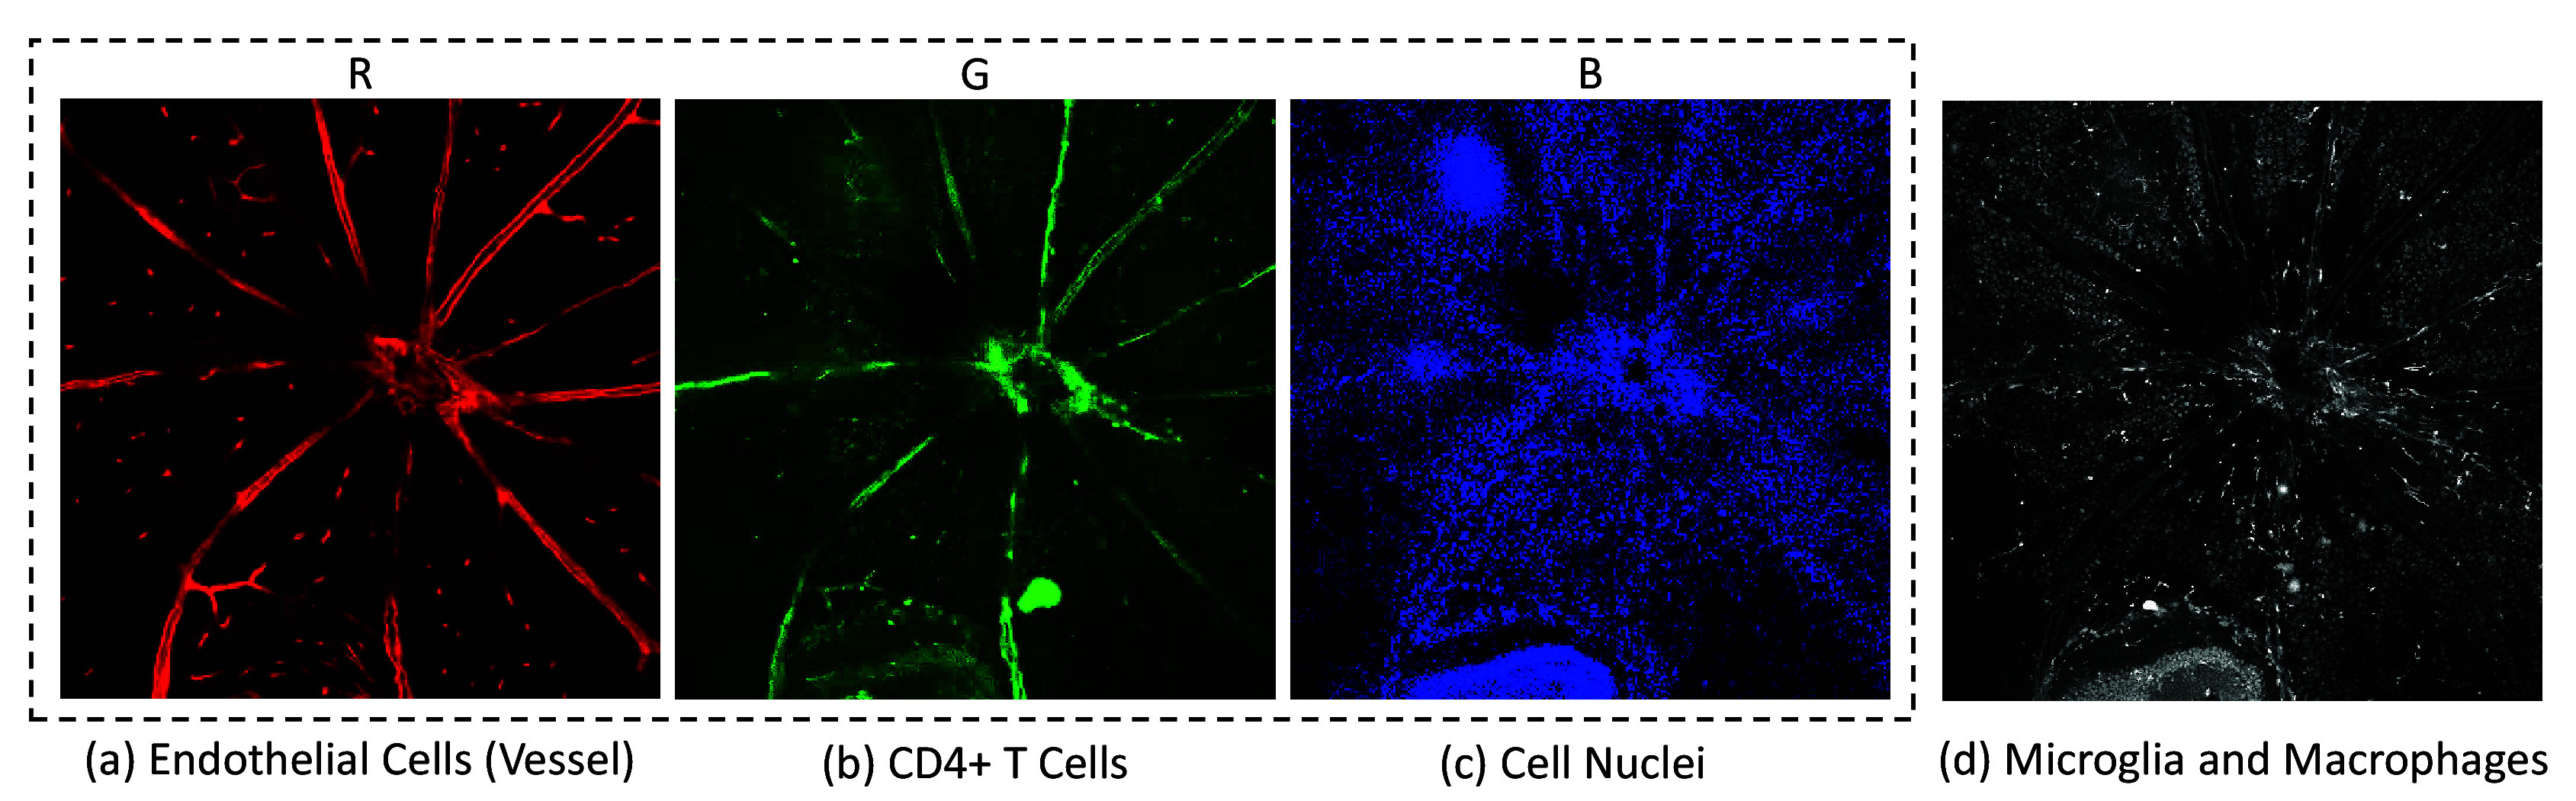
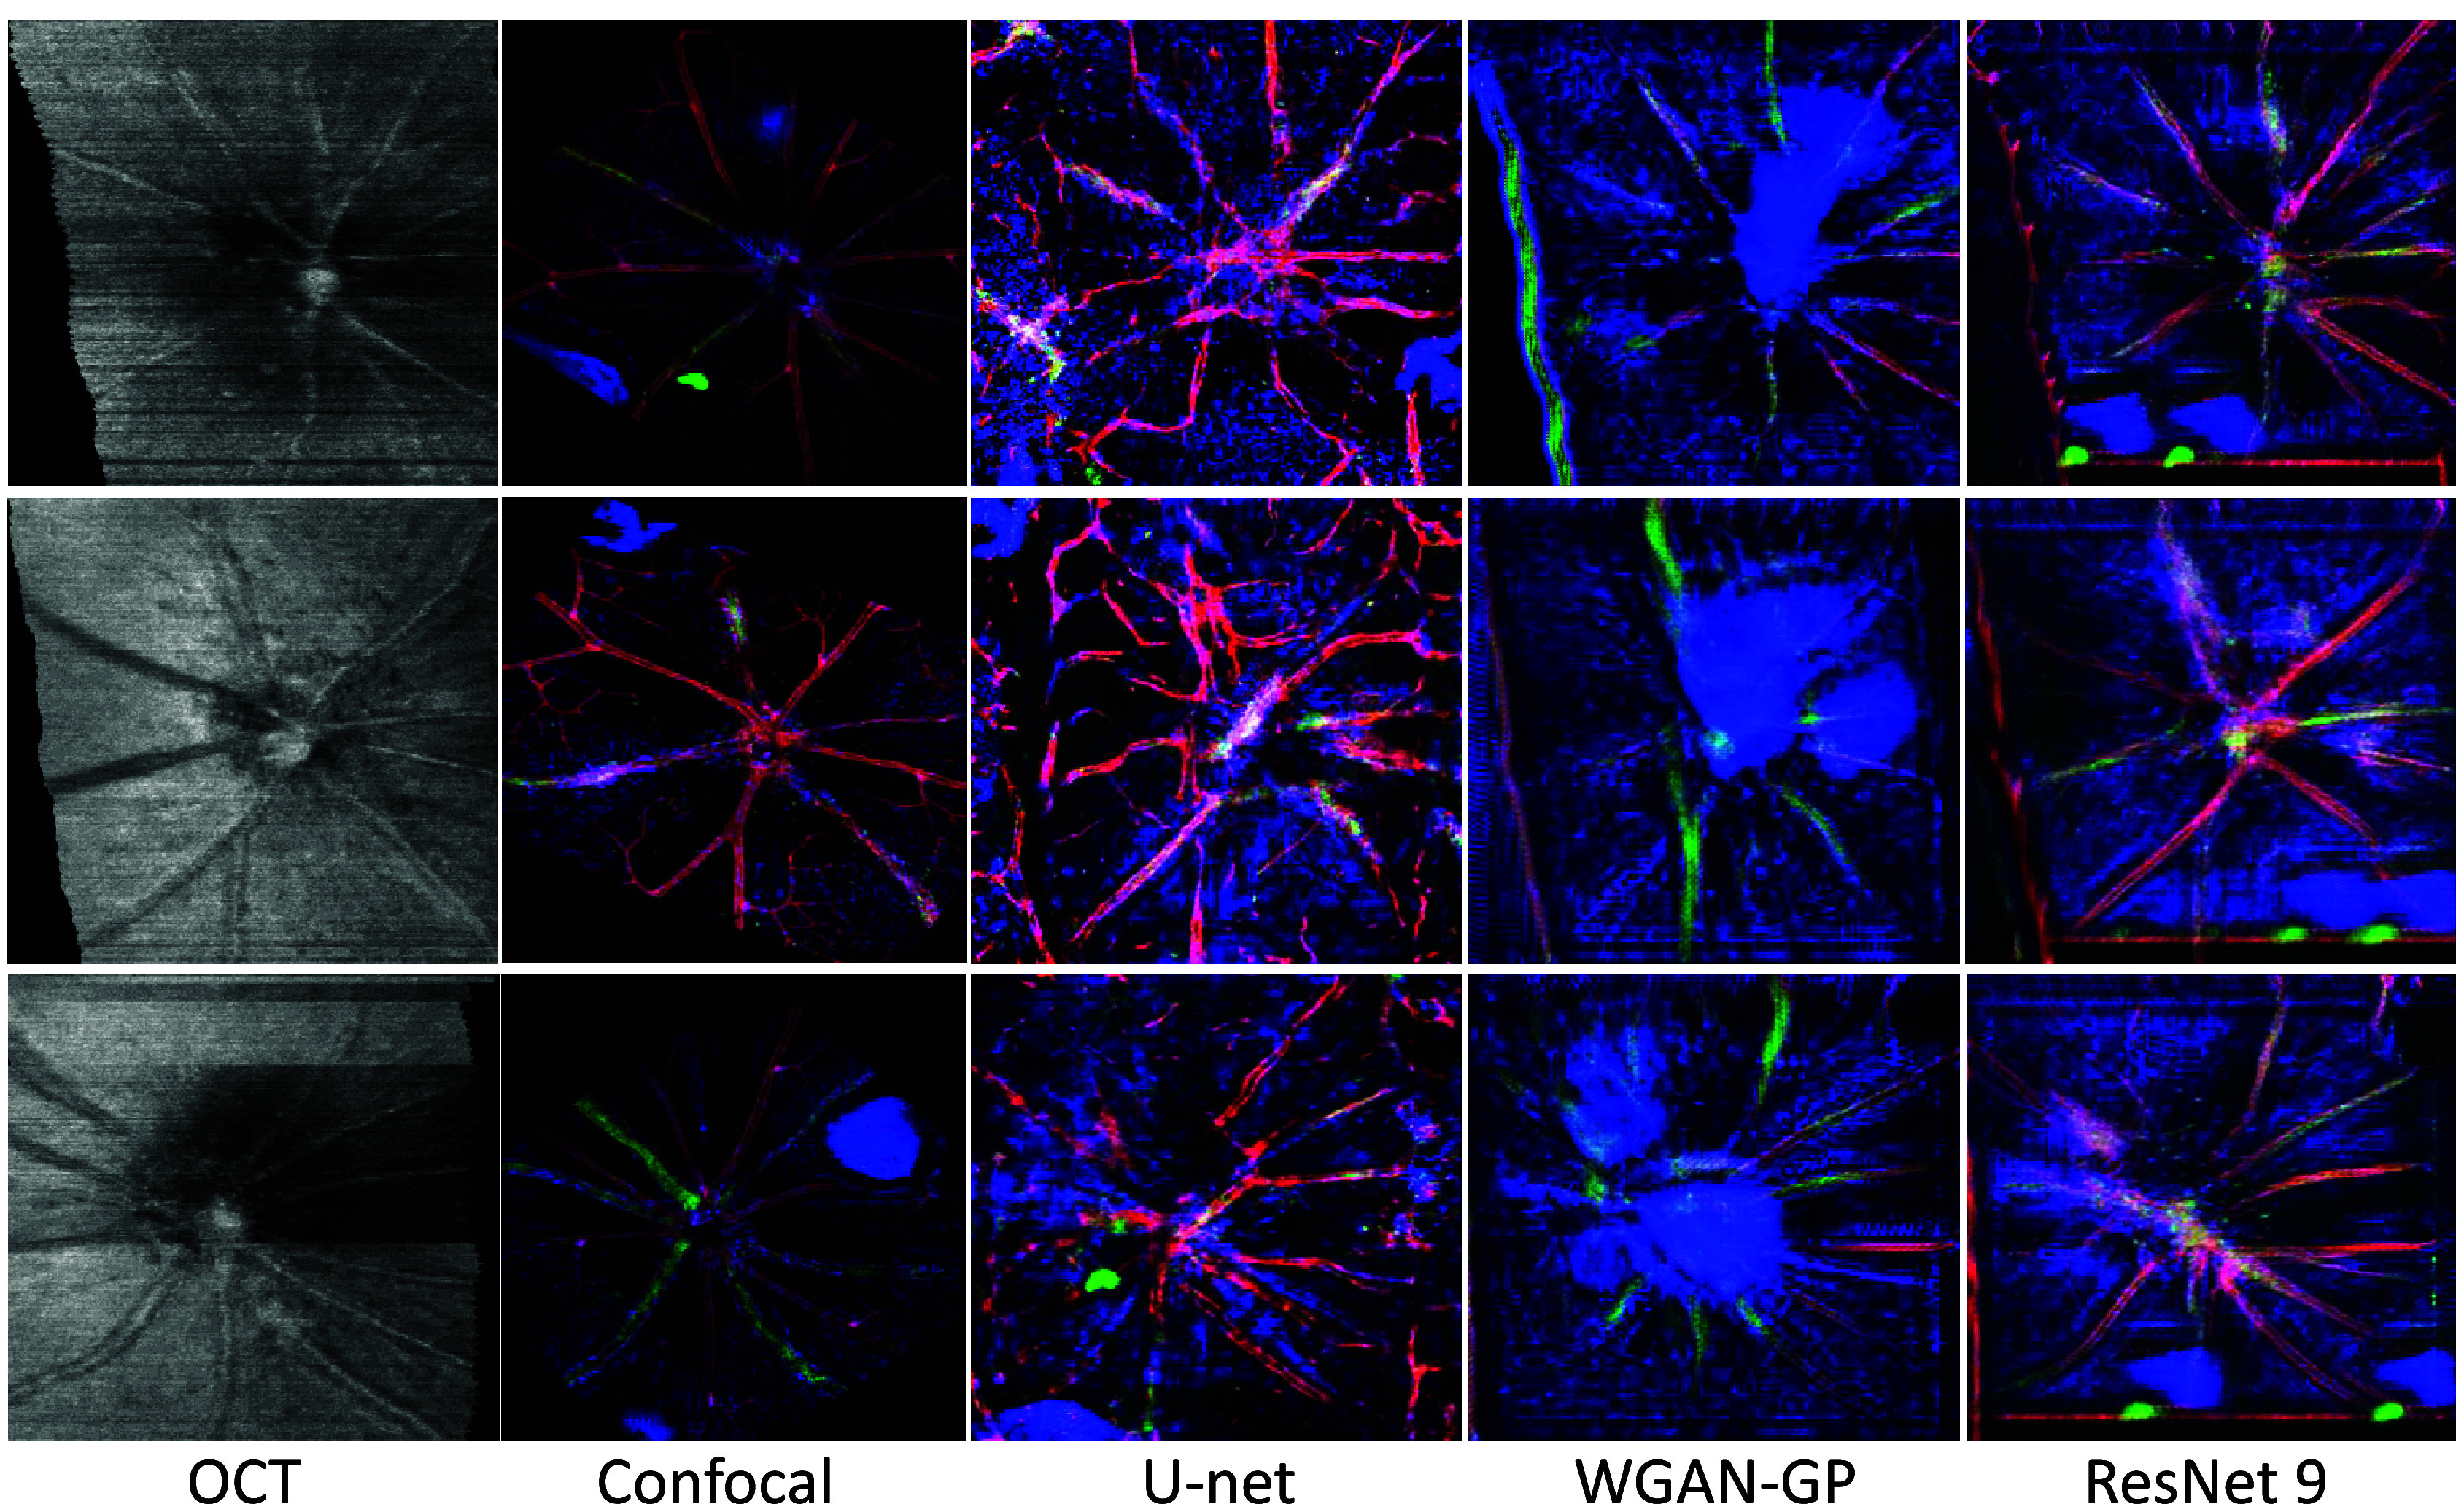
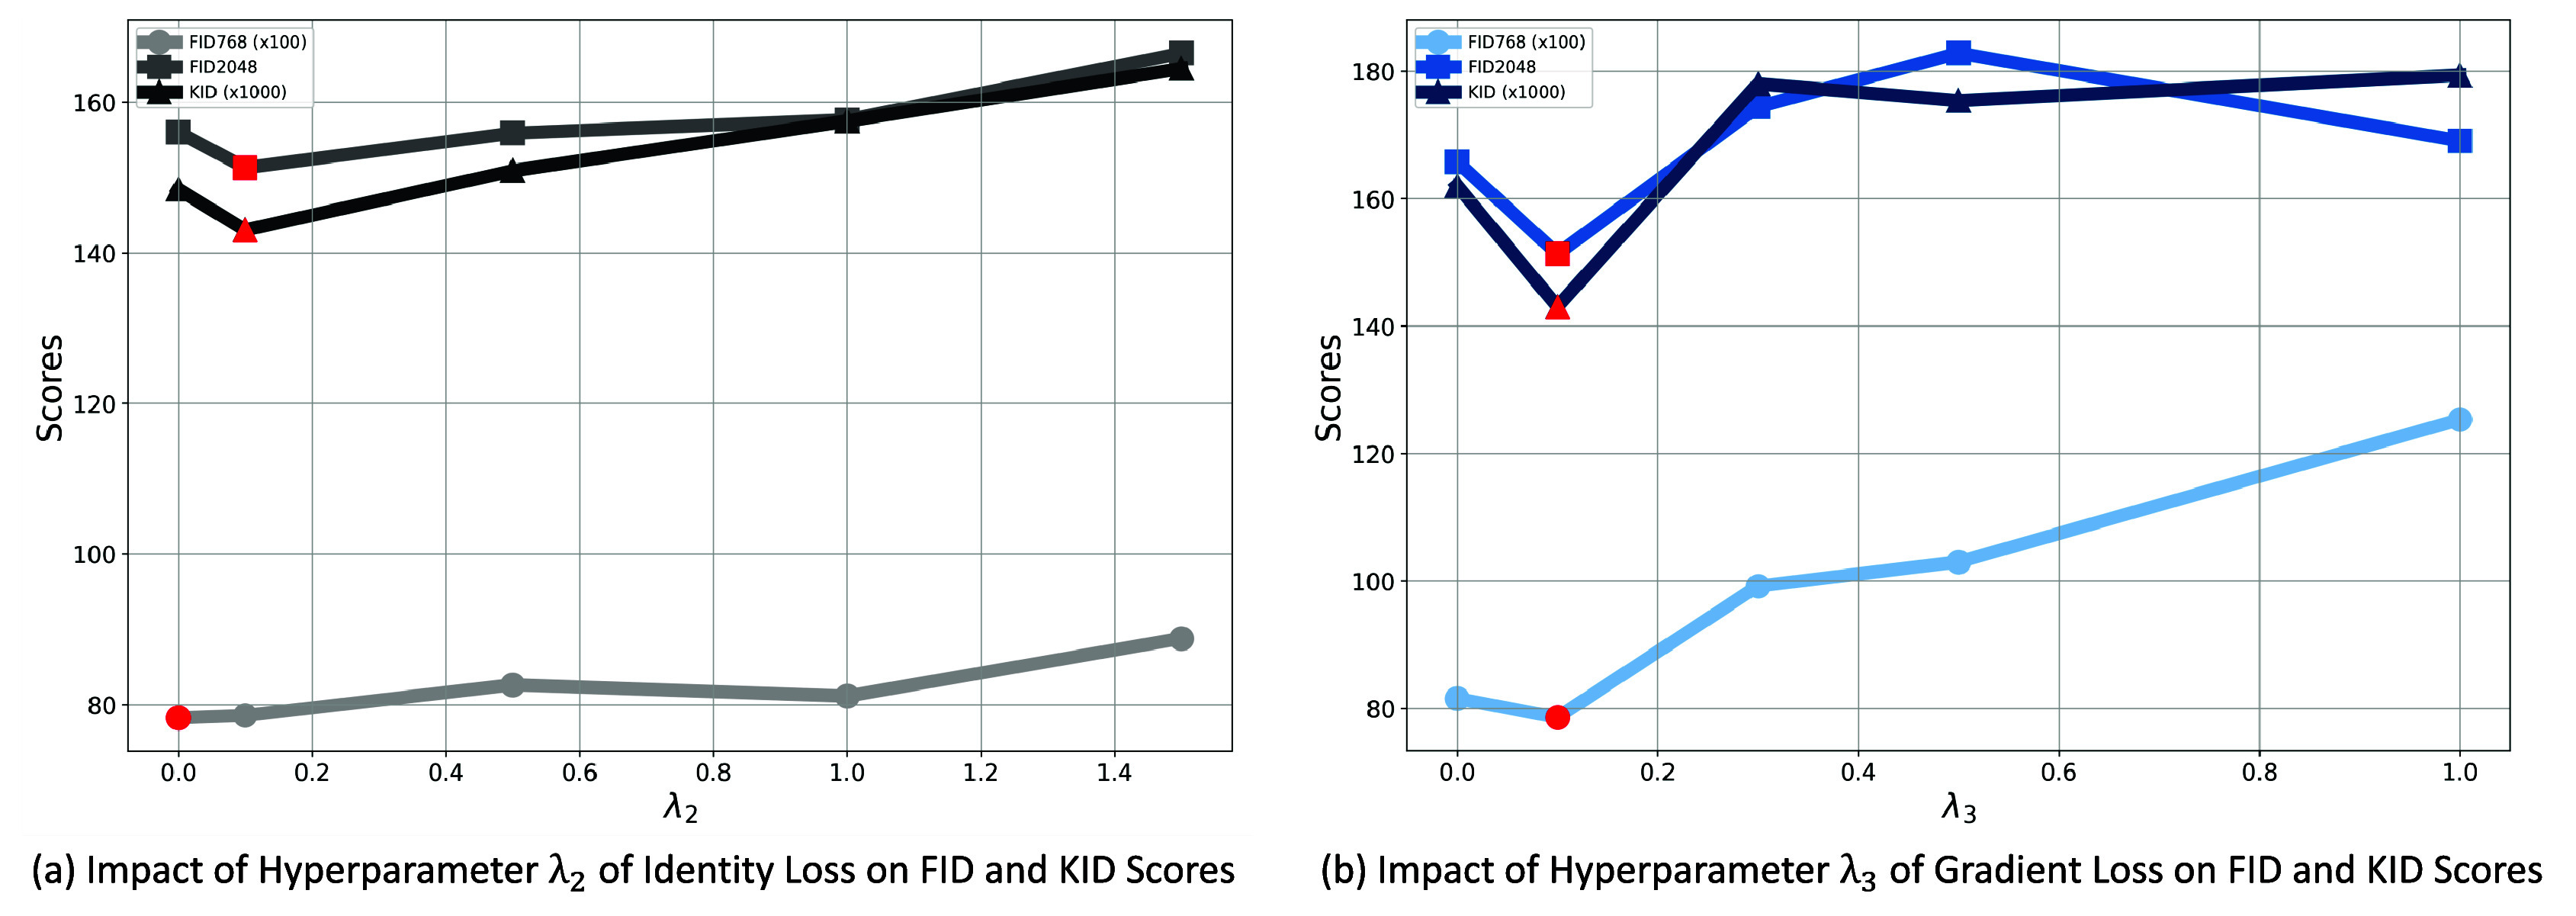
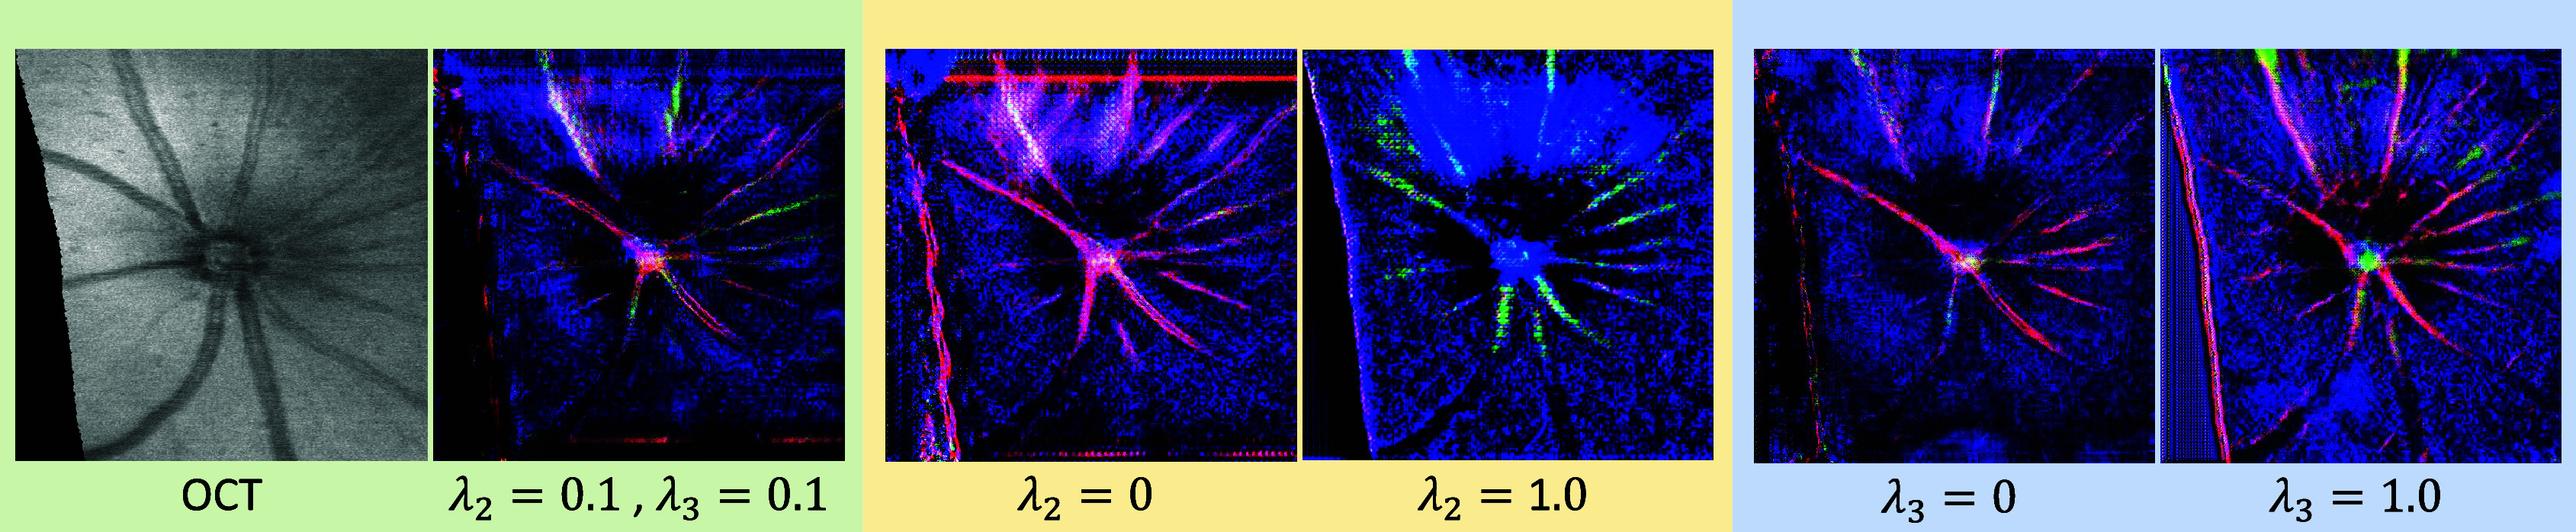
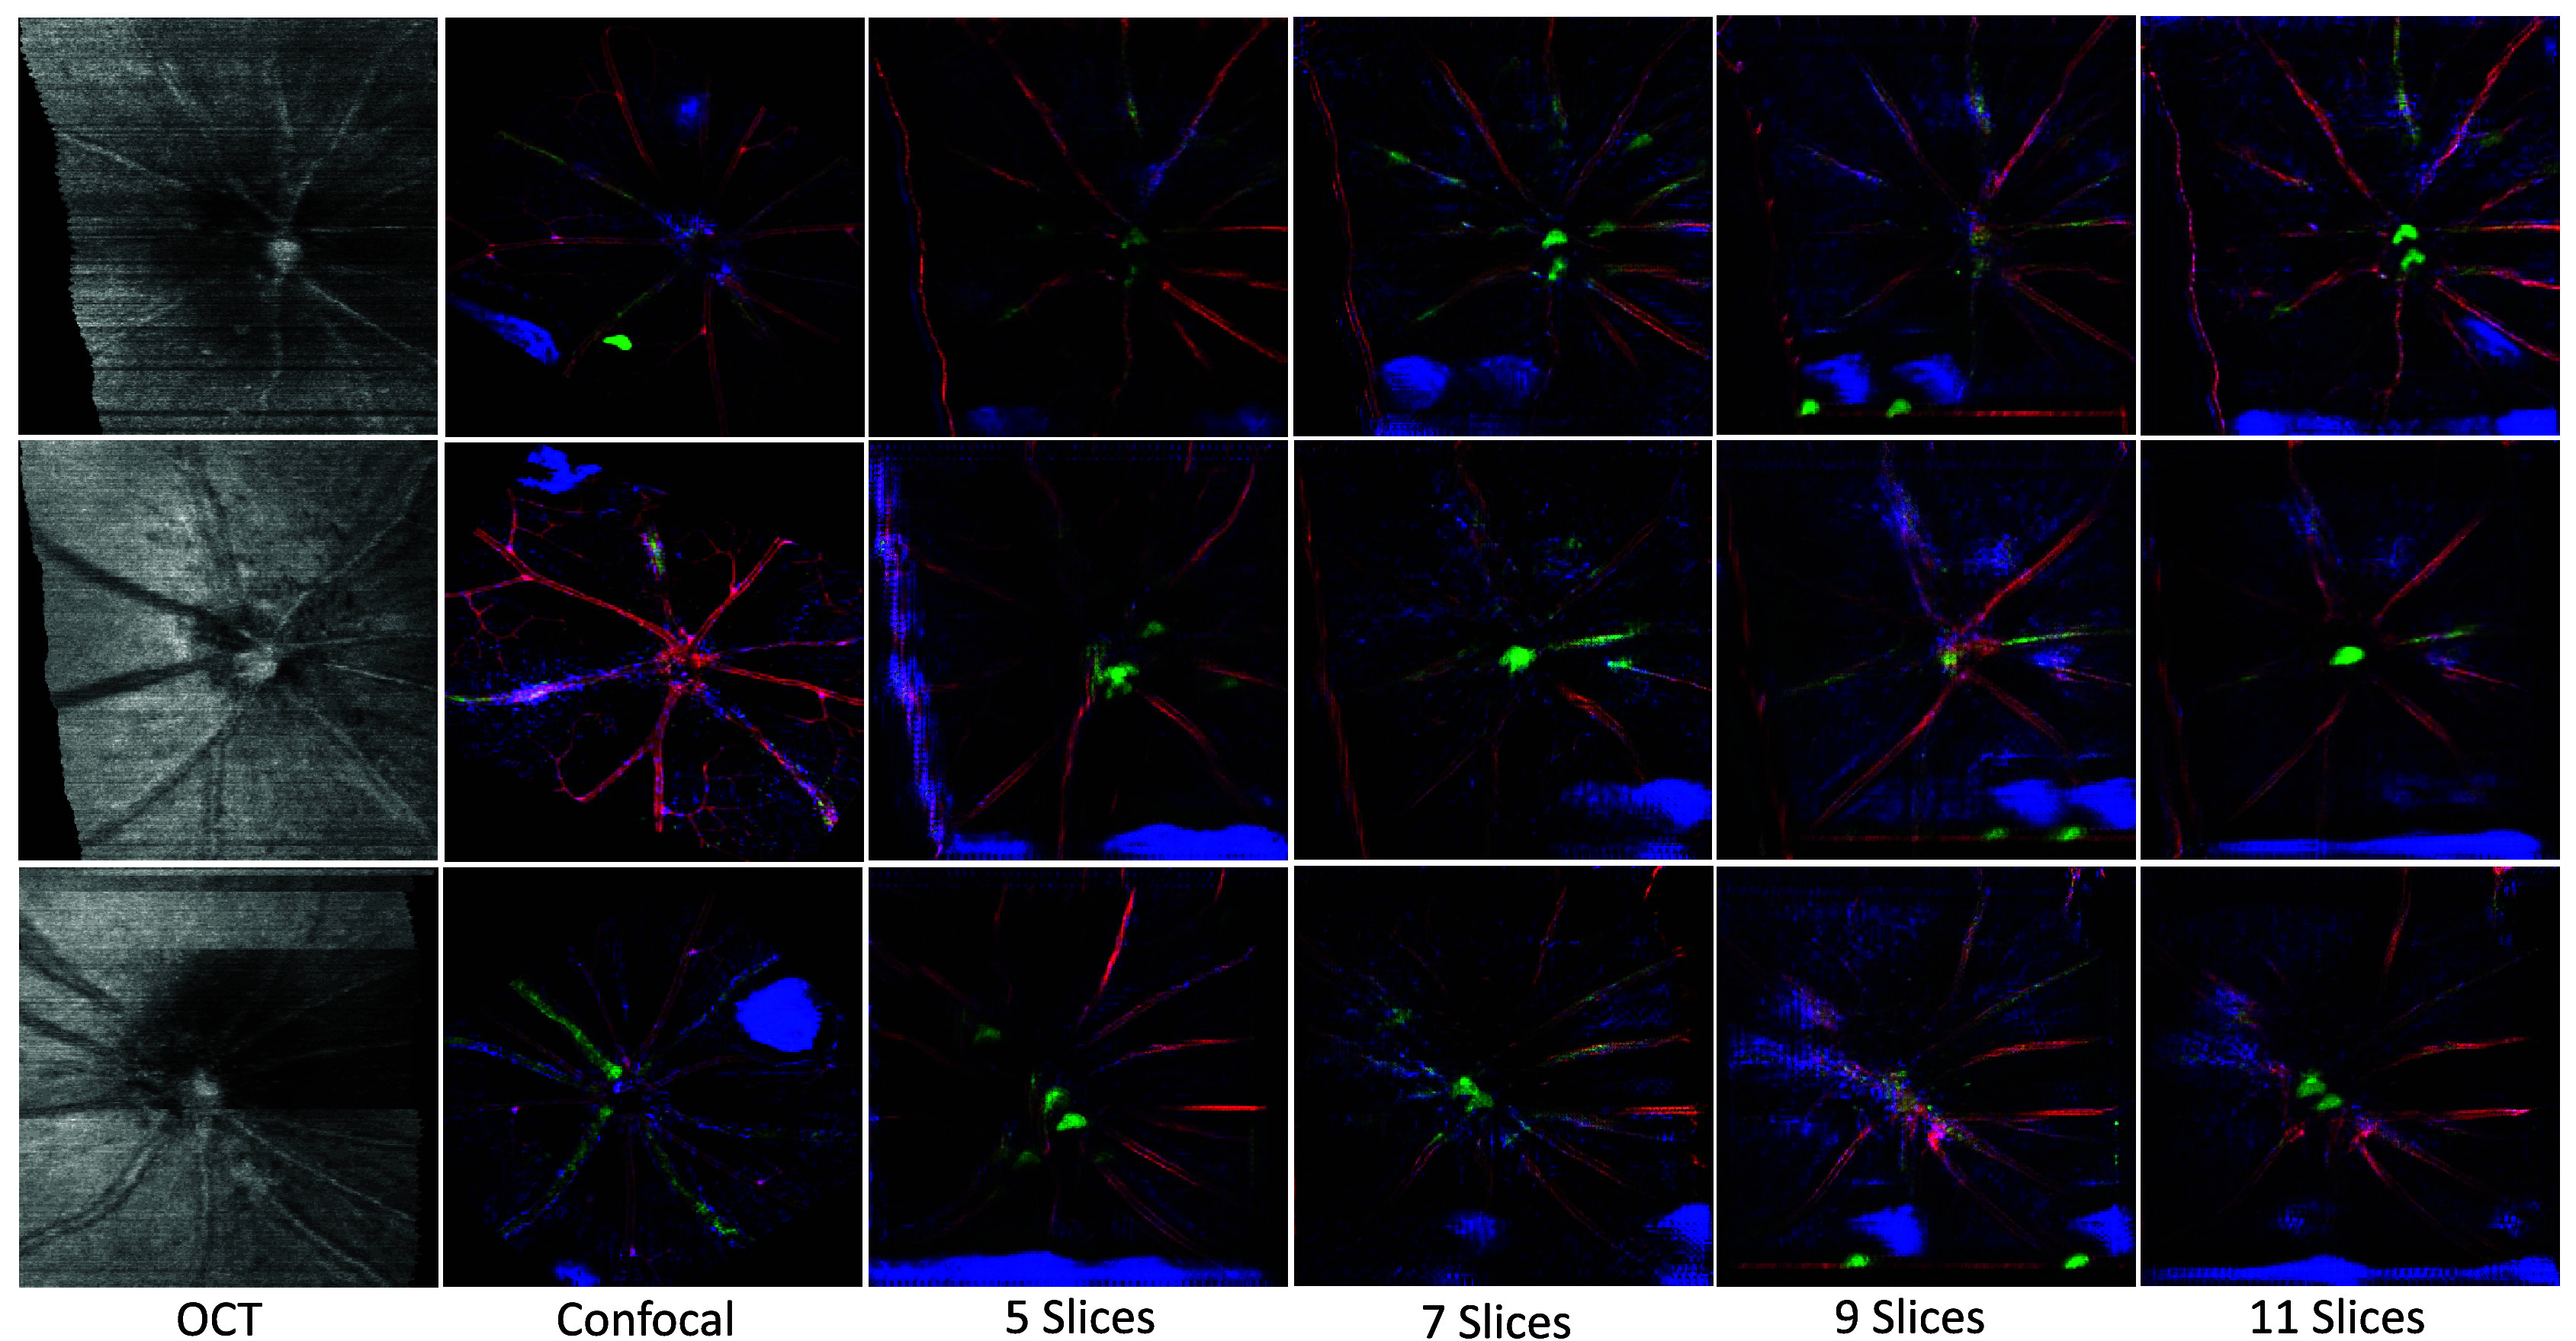
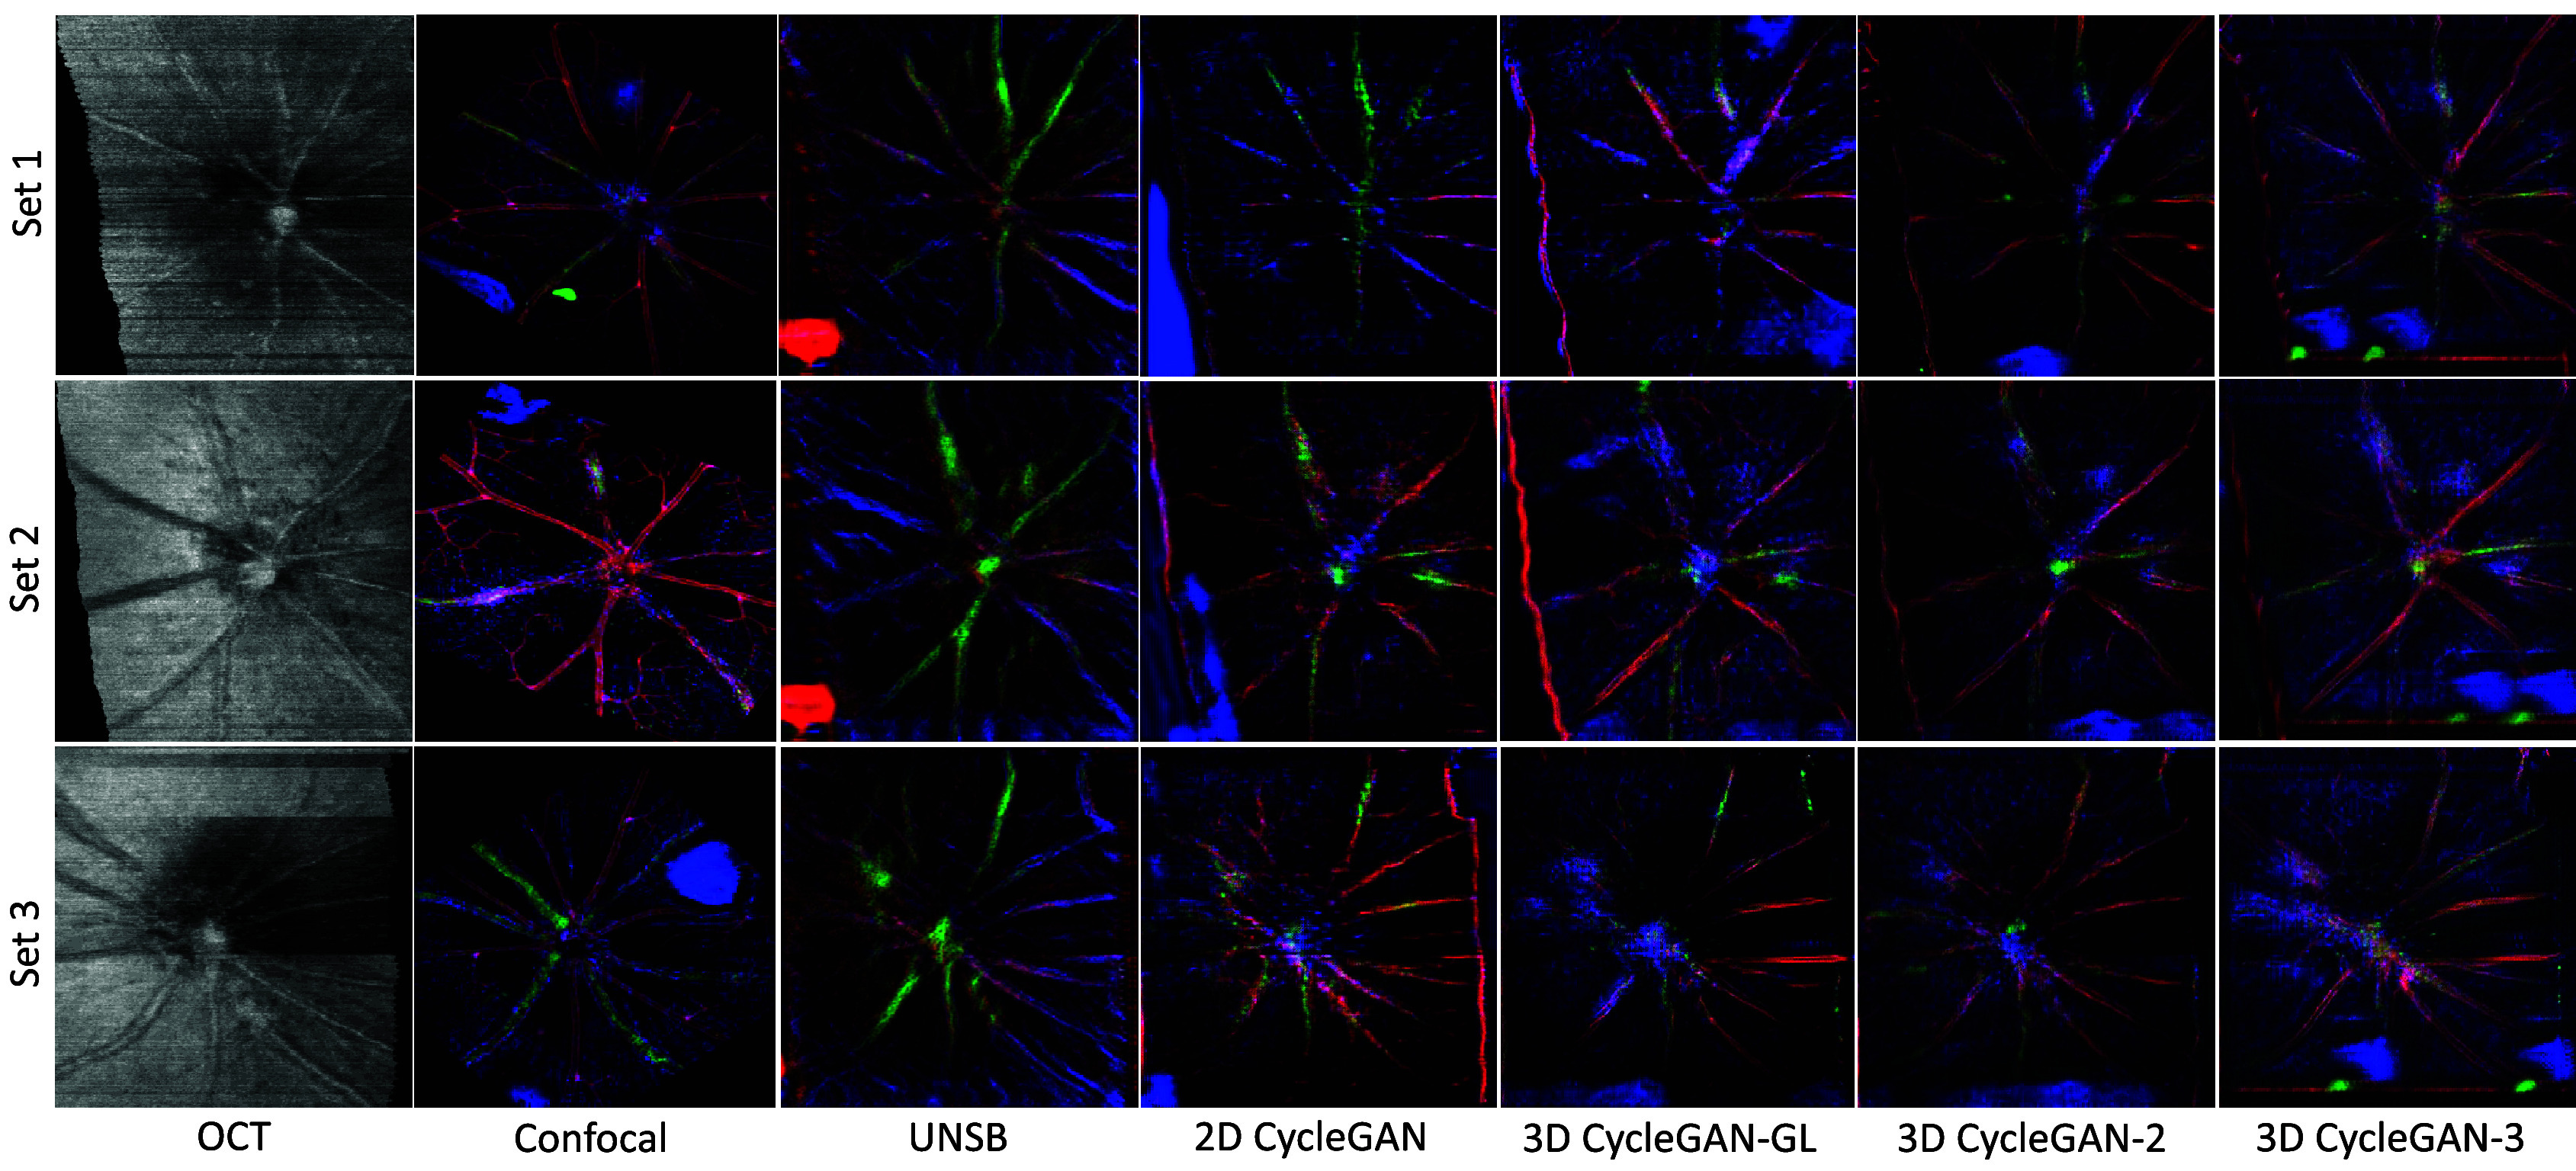
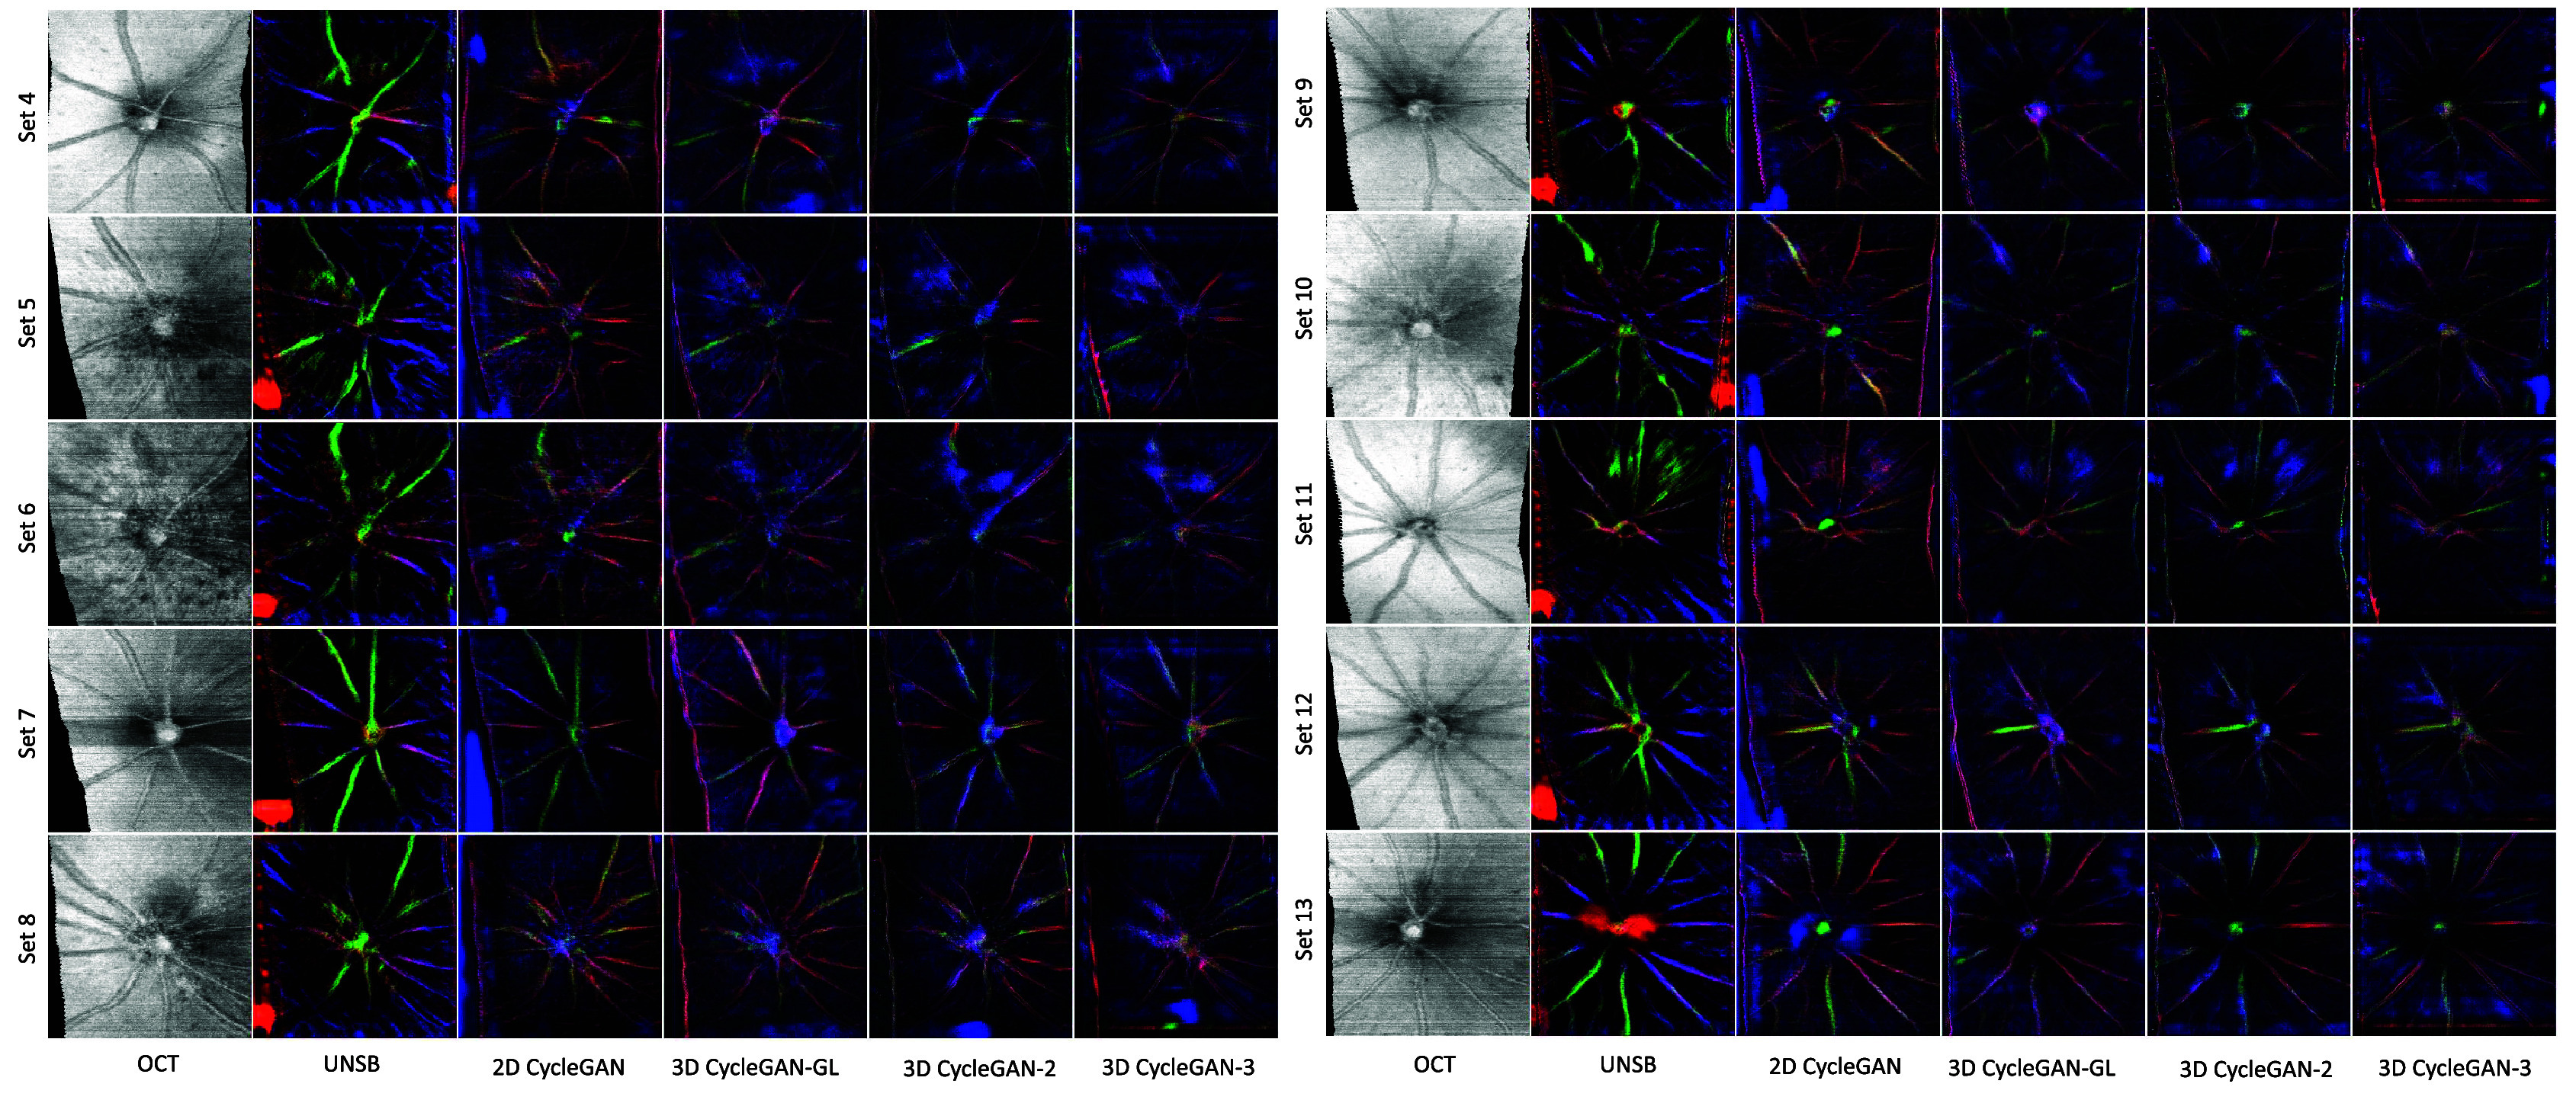
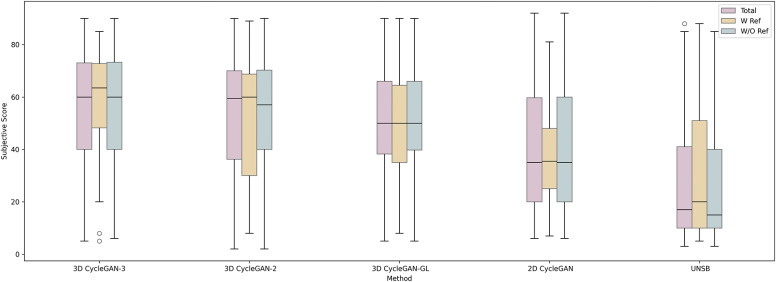
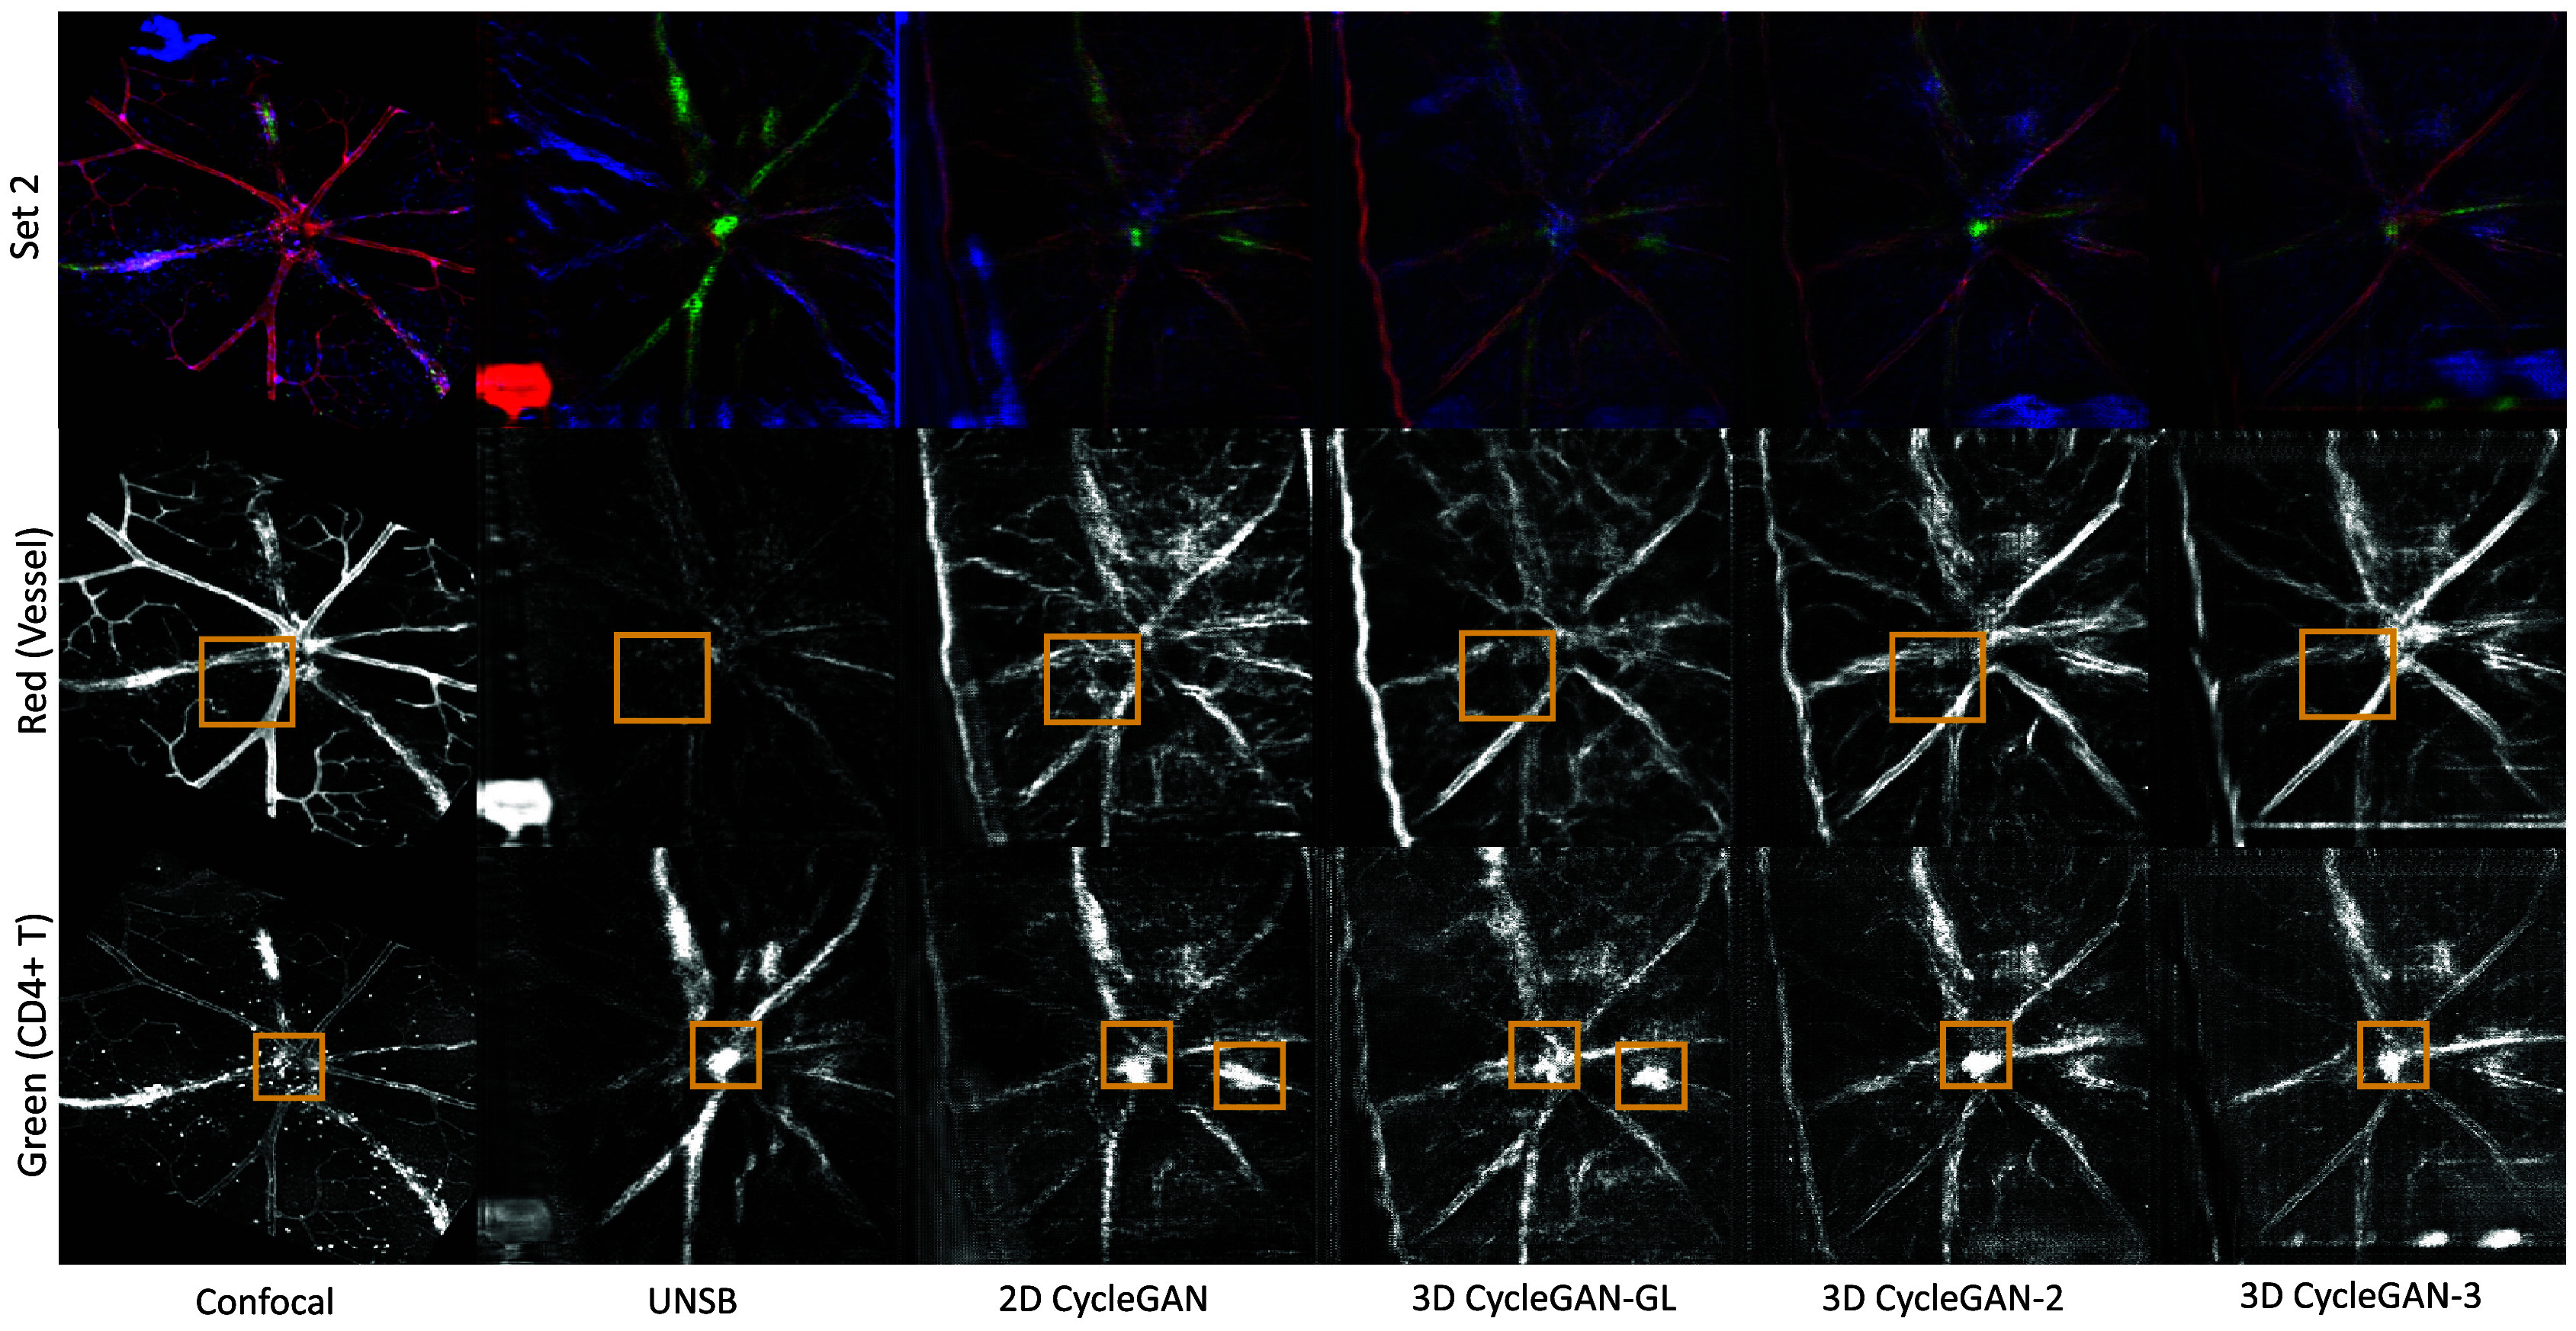
Optical coherence tomography (OCT) and confocal microscopy are pivotal in retinal imaging, offering distinct advantages and limitations. In vivo OCT offers rapid, noninvasive imaging but can suffer from clarity issues and motion artifacts, while ex vivo confocal microscopy, providing high-resolution, cellular-detailed color images, is invasive and raises ethical concerns. To bridge the benefits of both modalities, we propose a novel framework based on unsupervised 3D CycleGAN for translating unpaired in vivo OCT to ex vivo confocal microscopy images. This marks the first attempt to exploit the inherent 3D information of OCT and translate it into the rich, detailed color domain of confocal microscopy. We also introduce a unique dataset, OCT2Confocal, comprising mouse OCT and confocal retinal images, facilitating the development of and establishing a benchmark for cross-modal image translation research. Our model has been evaluated both quantitatively and qualitatively, achieving Fréchet inception distance (FID) scores of 0.766 and Kernel Inception Distance (KID) scores as low as 0.153, and leading subjective mean opinion scores (MOS). Our model demonstrated superior image fidelity and quality with limited data over existing methods. Our approach effectively synthesizes color information from 3D confocal images, closely approximating target outcomes and suggesting enhanced potential for diagnostic and monitoring applications in ophthalmology.

Keywords: CycleGAN; Image-to-image translation; OCT; confocal microscopy; retinal image.


Conflict of interest statement

The authors declare no competing interests exist.

Figures

Figure 1.
Figure 1.
The proposed OCT-to-Confocal image translation method is based on 3D CycleGAN.
Figure 2.
Figure 2.
OCT2Confocal data. (a) The OCT cube with the confocal image stack of A2R, (b) The OCT projection and confocal of 3 mice.
Figure 3.
Figure 3.
Example of one slice in an original four-color channel of retinal confocal image stack. The images show (from left to right):(a) Endothelial cells lining the blood vessels (red), (b) CD4+ T cells (green), (c) Cell nuclei stained with DAPI (blue), and (d) Microglia and macrophages (white).
Figure 4.
Figure 4.
Visual comparison of translated images using different generator architectures. This figure displays the translated confocal images using U-Net, WGAN-GP, and ResNet 9 architectures.
Figure 5.
Figure 5.
Impact of Gradient and Identity Loss Hyperparameters formula image and formula image on FID and KID. The lowest (optimal) score is highlighted in red.
Figure 6.
Figure 6.
Visual comparison of translated confocal images with different formula image and formula image values against the optimized setting.
Figure 7.
Figure 7.
Visual comparison of translated images with varying input slice depths (5, 7, 9, 11 slices). This figure demonstrates the impact of different slice depths on the quality of image translation by the 3D CycleGAN-3 model.
Figure 8.
Figure 8.
Visual comparative translation results with reference.
Figure 9.
Figure 9.
Visual comparative translation results without reference.
Figure 10.
Figure 10.
Boxplot of subjective evaluation scores for comparison across scenarios with reference (‘W Ref’), without reference (‘W/O Ref’), and the combined total (‘Total’). The circles indicate outliers in the data.
Figure 11.
Figure 11.
Example of model hallucination analysis. Focusing on the red channel for vascular structures and the green channel for CD4+ T cells. Areas highlighted (yellow boxes) show where each model introduces inaccuracies in the representation of vascular and immune cell distributions.

Similar articles

References

    1. Abràmoff M, Garvin M and Sonka M (2010) Retinal imaging and image analysis. IEEE Reviews in Biomedical Engineering 3, 169–208. - PMC - PubMed
    1. Kang Y, Yeung L, Lee Y, et al. (2021) A multimodal imaging–based deep learning model for detecting treatment-requiring retinal vascular diseases: model development and validation study. JMIR Medical Informatics 9(5), e28868. - PMC - PubMed
    1. Meleppat R, Ronning K, Karlen S, Burns M, Pugh E and Zawadzki R (2021) In vivo multimodal retinal imaging of disease-related pigmentary changes in retinal pigment epithelium. Scientific Reports 2(2), 16252. - PMC - PubMed
    1. Morano J, Hervella Á, Barreira N, Novo J and Rouco J (2020) Multimodal transfer learning-based approaches for retinal vascular segmentation. arXiv preprint arXiv:2012.10160
    1. Hu Z, Niemeijer M, Abràmoff M and Garvin M (2012) Multimodal retinal vessel segmentation from spectral-domain optical coherence tomography and fundus photography. IEEE Transactions on Medical Imaging 31(10), 1900–1911. - PMC - PubMed

LinkOut - more resources