

The Investigation of the Relationship Between Individual Pain Perception, Brain Electrical Activity, and Facial Expression Based on Combined EEG and Facial EMG Analysis
- PMID: 39776765
- PMCID: PMC11705972
- DOI: 10.2147/JPR.S477658
The Investigation of the Relationship Between Individual Pain Perception, Brain Electrical Activity, and Facial Expression Based on Combined EEG and Facial EMG Analysis
Abstract
Purpose: Pain is a multidimensional, unpleasant emotional and sensory experience, and accurately assessing its intensity is crucial for effective management. However, individuals with cognitive impairments or language deficits may struggle to accurately report their pain. EEG provides insight into the neurological aspects of pain, while facial EMG captures the sensory and peripheral muscle responses. Our objective is to explore the relationship between individual pain perception, brain activity, and facial expressions through a combined analysis of EEG and facial EMG, aiming to provide an objective and multidimensional approach to pain assessment.
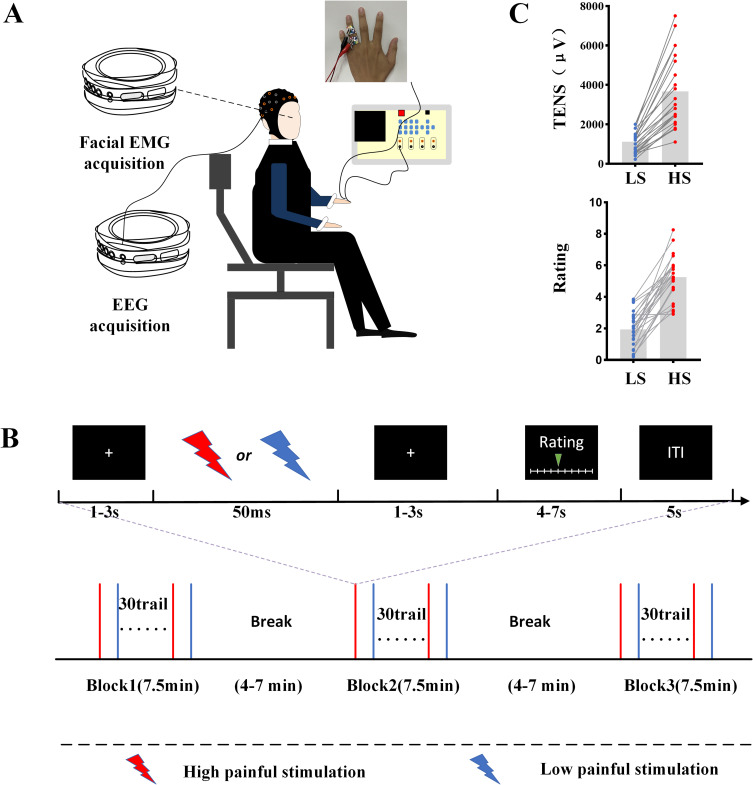
Methods: We investigated pain perception in response to electrical stimulation of the middle finger in 26 healthy subjects. The 32-channel EEG and 3-channel facial EMG signals were simultaneously recorded during a pain rating task. Group difference and correlation analysis were employed to investigate the relationship between individual pain perception, EEG, and facial EMG. The general linear model (GLM) was used for multidimensional pain assessment.
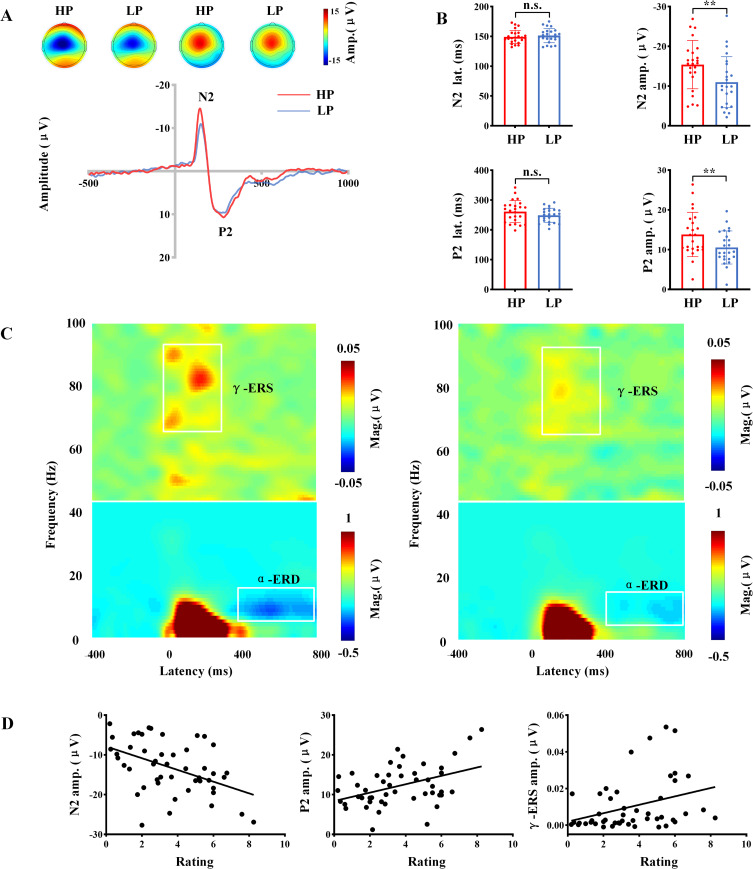
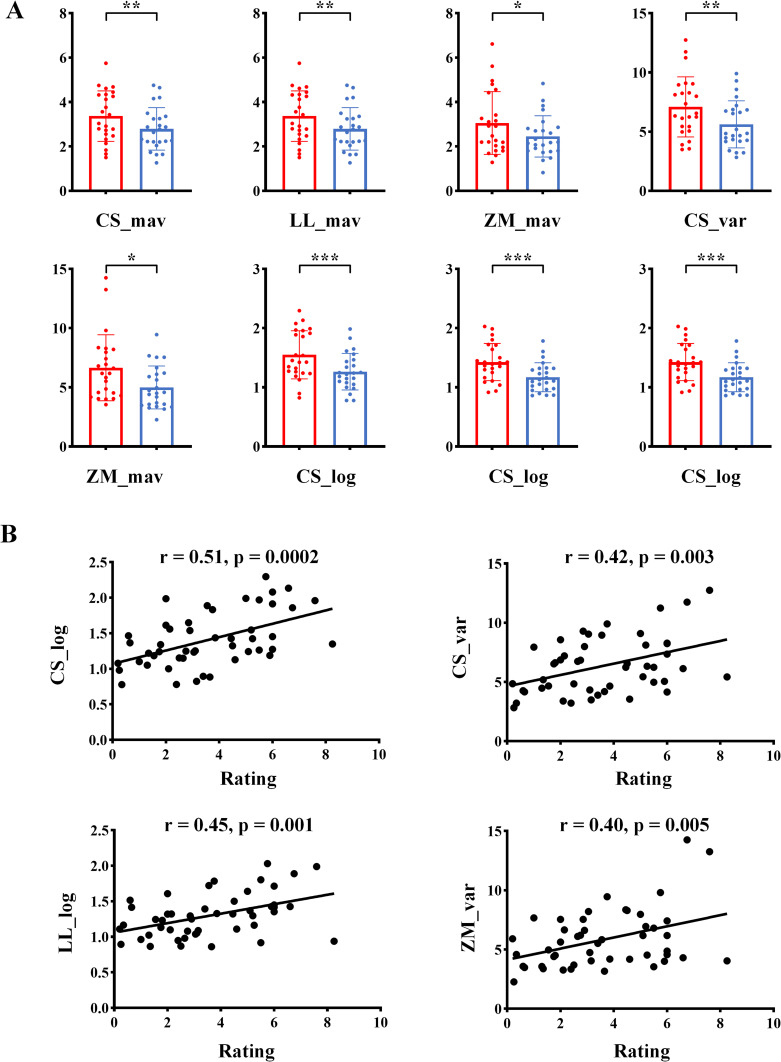
Results: The EEG analysis revealed that painful stimuli induced N2-P2 complex waveforms and gamma oscillations, with substantial variability in response to different stimuli. The facial EMG signals also demonstrated significant differences and variability correlated with subjective pain ratings. A combined analysis of EEG and facial EMG data using a general linear model indicated that both N2-P2 complex waveforms and the zygomatic muscle responses significantly contributed to pain assessment.
Conclusion: Facial EMG signals provide pain descriptions which are not sufficiently captured by EEG signals, and integrating both signals offers a more comprehensive understanding of pain perception. Our study underscores the potential of multimodal neurophysiological measurements in pain perception, offering a more comprehensive framework for evaluating pain.
Keywords: electroencephalogram; facial electromyogram; general linear model; multiple physiological signals; pain assessment.
© 2025 Ma et al.
Conflict of interest statement
The authors report no conflicts of interest in this work.
Figures
References
-
- Gruss S, Geiger M, Werner P, et al. Multi-modal signals for analyzing pain responses to thermal and electrical stimuli. JoVE. 2019;146:e59057. - PubMed
LinkOut - more resources
Full Text Sources
