. 2025 Jan 1;15(3):1057-1076.
doi: 10.7150/thno.100998. eCollection 2025.

Bisphosphonate-mineralized nano-IFNγ suppresses residual tumor growth caused by incomplete radiofrequency ablation through metabolically remodeling tumor-associated macrophages

Affiliations

Bisphosphonate-mineralized nano-IFNγ suppresses residual tumor growth caused by incomplete radiofrequency ablation through metabolically remodeling tumor-associated macrophages

Zhicheng Yan et al. Theranostics. .

Abstract

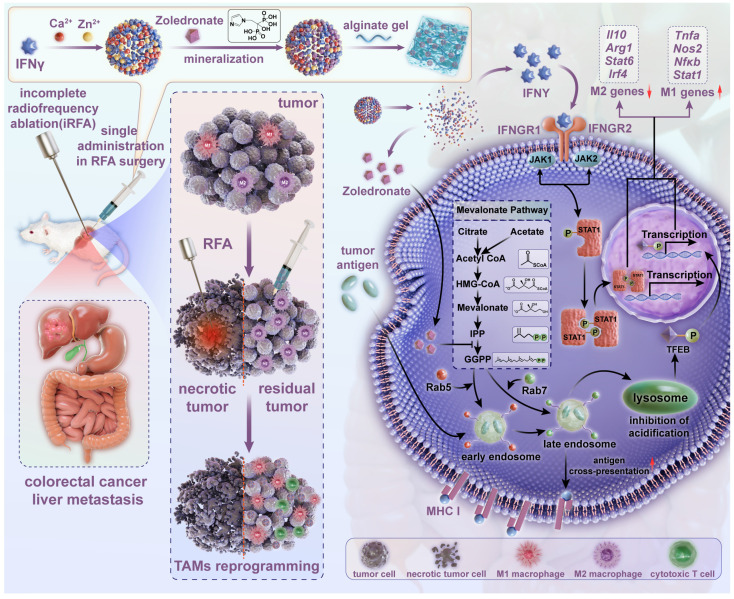
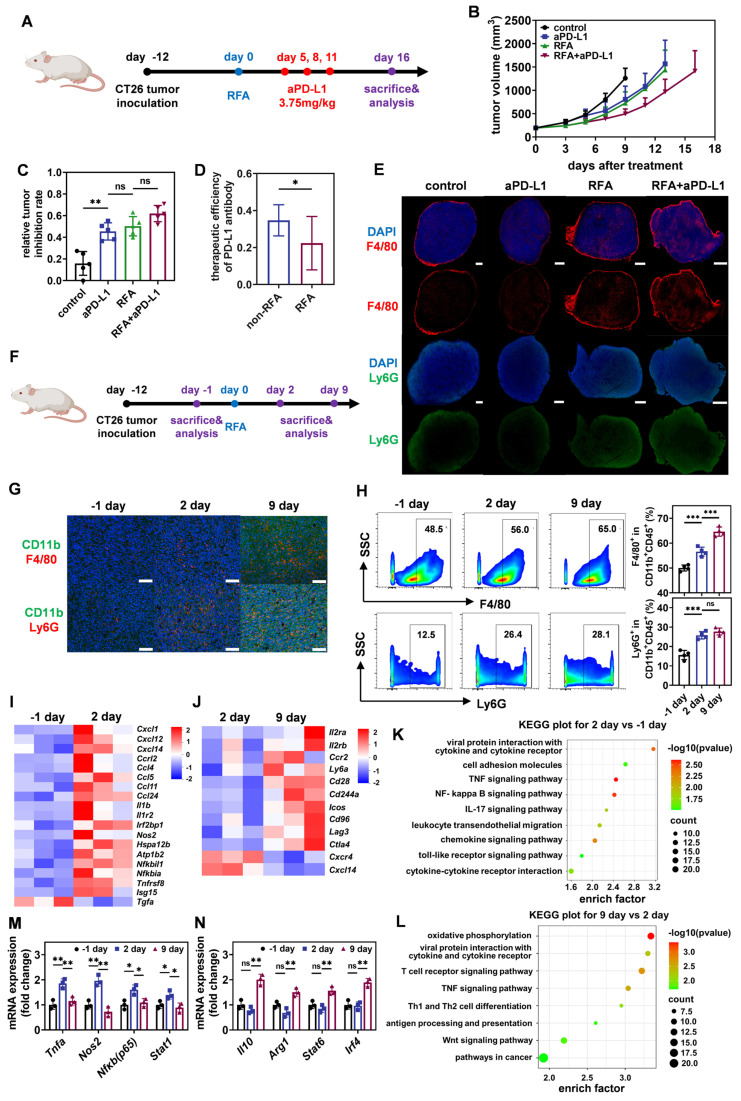
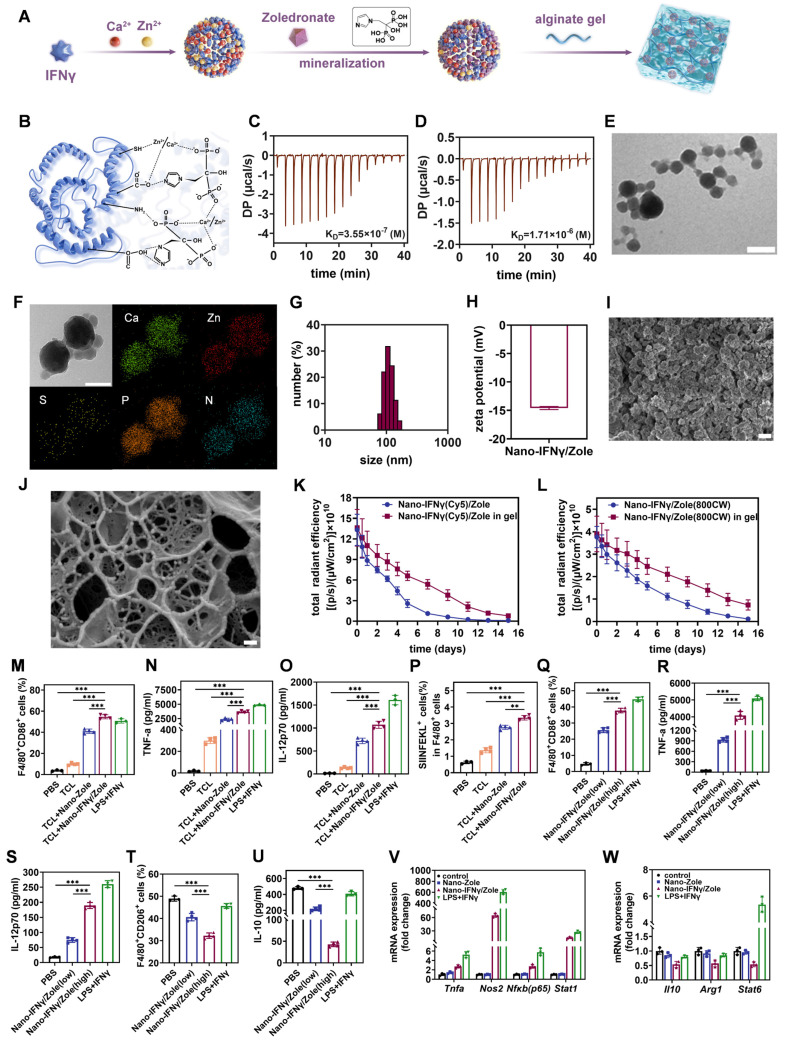
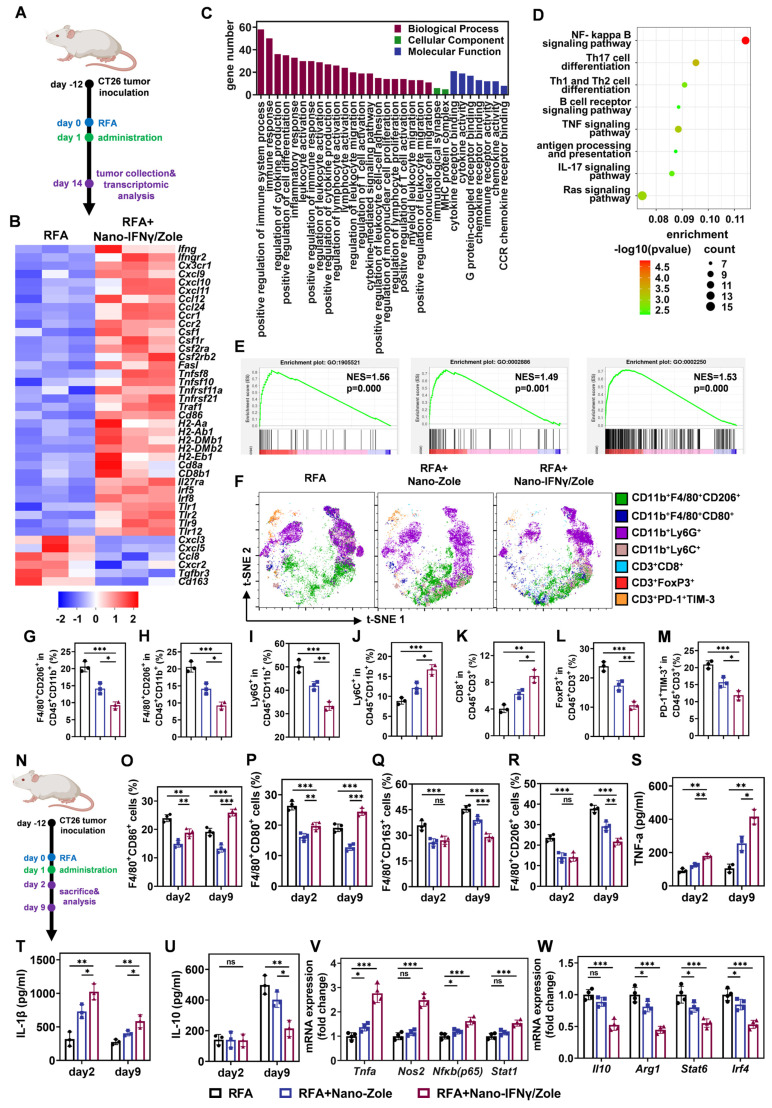
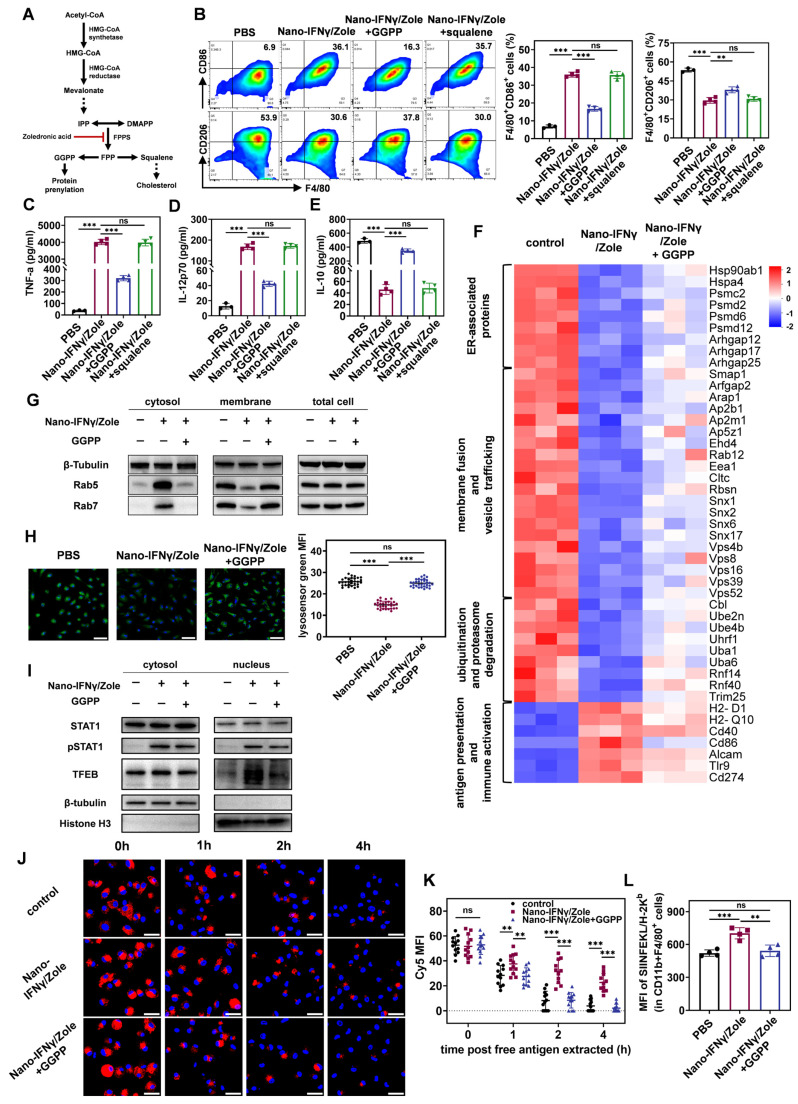
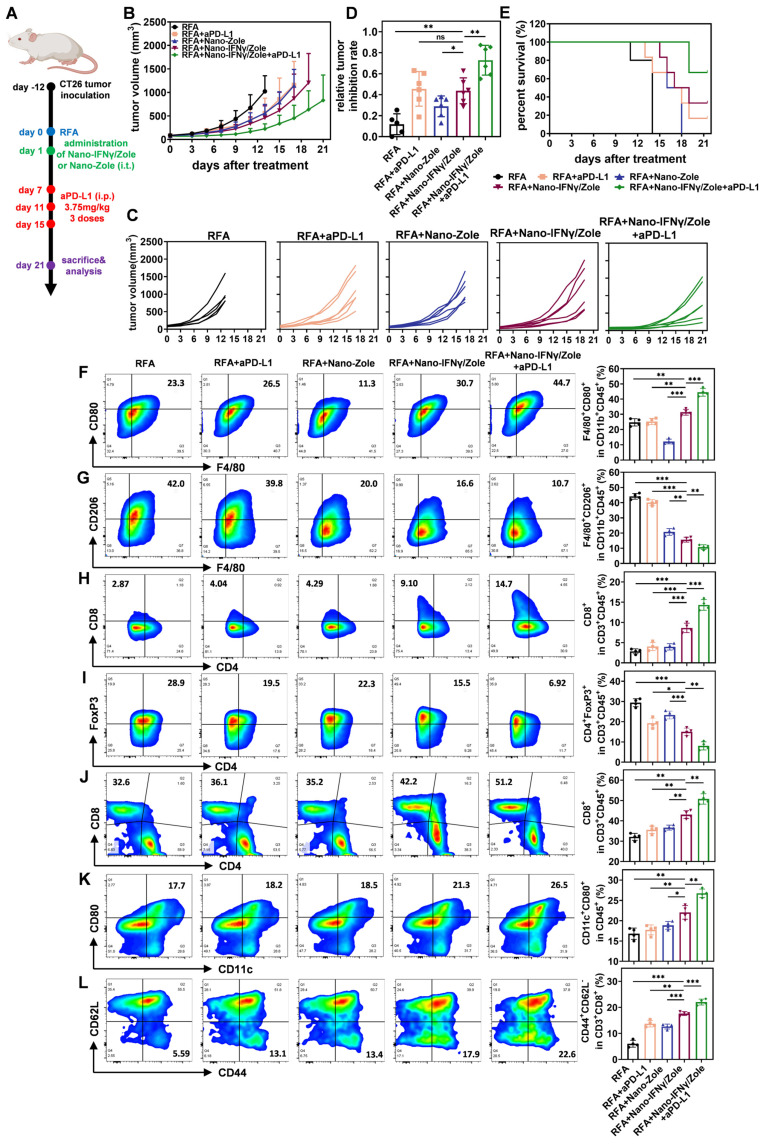
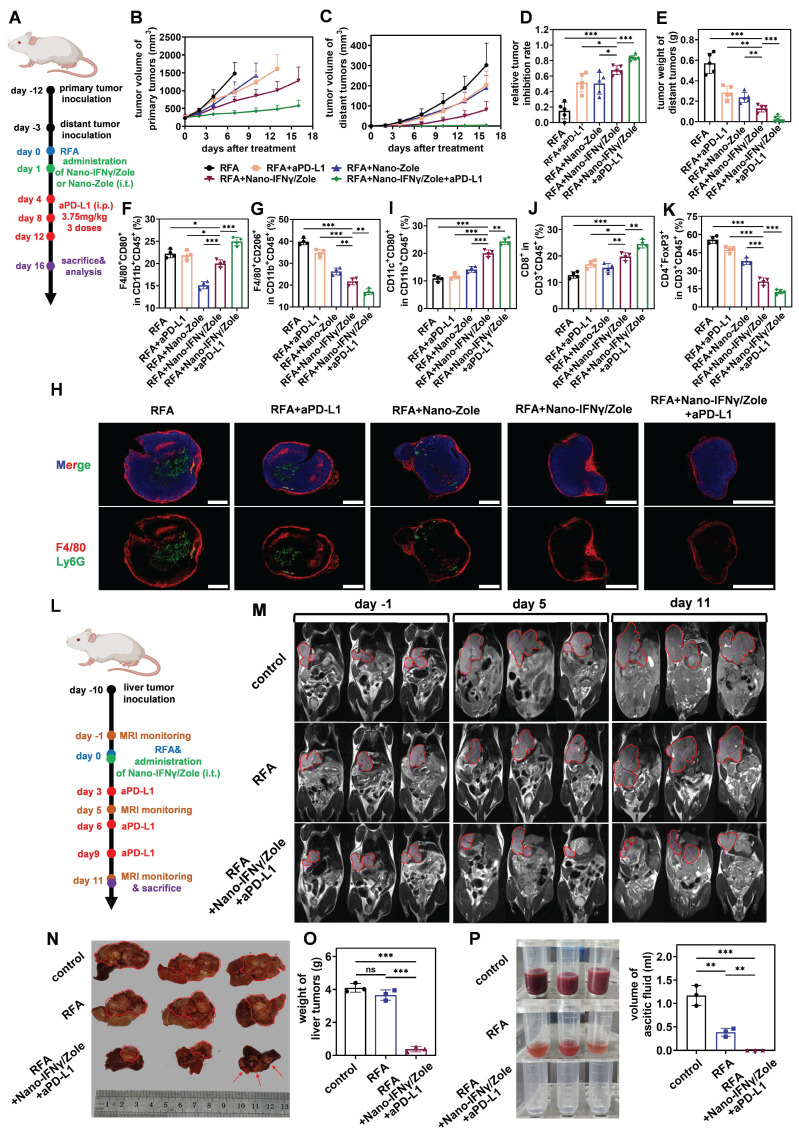
Rationale: Radiofrequency ablation (RFA), as a minimally invasive surgery strategy based on local thermal-killing effect, is widely used in the clinical treatment of multiple solid tumors. Nevertheless, RFA cannot achieve the complete elimination of tumor lesions with larger burden or proximity to blood vessels. Incomplete RFA (iRFA) has even been validated to promote residual tumor growth due to the suppressive tumor immune microenvironment (TIME). Therefore, exploring strategies to remodel TIME is a key issue for the development of RFA therapy. Methods: The negative effect of iRFA on colorectal cancer therapy was firstly investigated. Then a zoledronate-mineralized nanoparticle loaded with IFNγ (Nano-IFNγ/Zole) was designed and its tumor suppressive efficacy was evaluated. Finally, the metabolic reprogramming mechanism of Nano-IFNγ/Zole on tumor-associated macrophages (TAMs) was studied in detail. Results: We found iRFA dynamically altered TIME and promoted TAM differentiation from M1 to M2. Nano-IFNγ/Zole was fabricated to metabolically remodel TAMs. IFNγ in Nano-IFNγ/Zole concentrated in the ablation site to play a long-term remodeling role. Acting on mevalonate pathway, Nano-IFNγ/Zole was discovered to reduce lysosomal acidification and activate transcription factor TFEB by inhibiting isoprene modification of the Rab protein family. These mechanisms, in conjunction with IFNγ-activated JAK/STAT1 signaling, accelerated the reprogramming of TAMs from M2 to M1, and suppressed tumor recurrence after iRFA. Conclusions: This study elaborates the synergistic mechanism of zoledronate and IFNγ in Nano-IFNγ/Zole to reshape suppressive TIME caused by iRFA by remodeling TAMs, and highlights the important value of metabolically induced cellular reprogramming. Since both zoledronate and IFNγ have already been approved in clinics, this integrative nano-drug delivery system establishes an effective strategy with great translational promise to overcome the poor prognosis after clinically incomplete RFA.

Keywords: interferon-γ; mevalonate metabolic pathway; radiofrequency ablation; tumor immune microenvironment; tumor-associated macrophages.


Conflict of interest statement

Competing Interests: The authors have declared that no competing interest exists.

Figures

Figure 1
Figure 1
Scheme of establishment and application of Nano-IFNγ/Zole for remodeling the suppressive TIME induced by iRFA. Bisphosphonate-mineralized nano-IFNγ (Nano-IFNγ/Zole) was dispersed in alginate gel and injected into the peripheral tumor during the final stage of RFA surgery. A single administration of Nano-IFNγ/Zole can exert a long-term immune regulatory effect by retaining in residual tumors after iRFA. Zoledronate acts as an immune regulator by blocking the mevalonate metabolic pathway in TAMs, delaying the acidification process in intracellular lysosomes through blockade of isoprene modification of small GTPase in the mevalonate metabolic pathway. Inhibited lysosomal acidification activates TFEB signaling and promotes its nuclear translocation, which collaborates with IFNγ-mediated JAK/STAT1 pathway on reprogramming the immunosuppressive M2 TAMs to M1 type, thereby reshaping the suppressive TIME of CRCLM after iRFA and delaying the recurrence and metastasis of residual tumors.
Figure 2
Figure 2
Transformation of TAMs induced by iRFA leads to a suppressive TIME and impairs the therapeutic efficacy of ICIs. (A) Schematic illustration of the assessment of the influence of iRFA on the therapeutic efficacy of PD-L1 antibody. (B) Growth curves of tumor volume after different treatment (n = 5). (C) Therapeutic efficiency of PD-L1 antibody with or without iRFA. (D) Relative tumor inhibition rate based on tumor weight after different treatment (n = 5). (E) Immunofluorescence images of tumor-infiltrating macrophages and neutrophils, scale bar: 1 mm. (F) Schematic illustration of the assessment of tumor immune microenvironment before and after iRFA treatment. (G) Representative immunofluorescence images of tumor-infiltrating macrophages and neutrophils before and after iRFA, scale bar: 100 μm. (H) Representative FCM plots and corresponding quantification of tumor-infiltrating macrophages and neutrophils before and after iRFA (n = 4). (I) Heatmap of differentially expressed genes in tumor tissue 1 day before and 2 days after iRFA (n = 3). (J) Heatmap of differentially expressed genes in tumor tissue 2 days and 9 days after iRFA (n = 3). (K) KEGG enrichment analysis of differentially expressed genes in tumor tissue 1 day before and 2 days after iRFA (n = 3). (L) KEGG enrichment analysis of differentially expressed genes in tumor tissue 2 days and 9 days after iRFA (n = 3). (M and N) qRT-PCR analysis of M1-type genes (M) or M2-type genes(N) expressed in tumor tissue before and after iRFA treatment (n = 4). All statistical data are presented as mean ± SD; data were analyzed with two-tailed unpaired t tests; ns, no significance; *, p < 0.05; **, p < 0.01; ***, p < 0.001.
Figure 3
Figure 3
Preparation, characterization, and in vitro immune-activation capacity of bisphosphonate-mineralized nano-IFNγ (Nano-IFNγ/Zole) hydrogel system. (A) Schematic illustration of the preparation of Nano-IFNγ/Zole hydrogel system (B) Schematic illustration of the interaction between different components in Nano-IFNγ/Zole. (C and D) ITC profiles indicating the titration of zoledronate with IFNγ (C) and the titration of Ca2+/Zn2+ with IFNγ (D). (E) Representative TEM image of Nano-IFNγ/Zole, scale bar: 100 nm. (F) Element distribution of Nano-IFNγ/Zole measured by TEM, scale bar: 100 nm. (G) Particle size distribution of Nano-IFNγ/Zole measured by DLS. (H) Zeta potential of Nano-IFNγ/Zole measured by DLS. (I) Representative SEM image of Nano-IFNγ/Zole, scale bar: 100 nm. (J) Representative Cyro-SEM image of Nano-IFNγ/Zole in gel, scale bar: 100 nm. (K) Quantitative analysis of total radiant efficiency of IVIS images of necrotic tumor after Nano-IFNγ(Cy5)/Zole or Nano-IFNγ(Cy5)/Zole in gel administration (n = 3). (L) Quantitative analysis of total radiant efficiency of IVIS images of necrotic tumor after Nano-IFNγ/Zole(800CW) or Nano-IFNγ/Zole(800CW) in gel administration (n = 3). (M-O) Quantitative analysis of in vitro activation of BMDMs after different treatment, by detecting CD86 expression on F4/80+ BMDMs (M), and pro-inflammatory cytokines release of TNF-α (N) and IL-12p70 (O) (n = 3~4), TCL represents Tumor Cell Lysates. (P) Quantitative analysis of antigen cross-presentation ability of BMDMs after different treatment (n = 3~4), TCL represents Tumor Cell Lysates. (Q-U) Quantitative analysis of in vitro trans-differentiation of M2-BMDMs after different treatment, by detecting CD86 (Q) and CD206 (T) expression on F4/80+ BMDMs, and cytokines release of TNF-α (R), IL-12p70 (S) and IL-10 (U) (n = 3~4). (V and W) qRT-PCR analysis of M1-type genes (V) or M2-type genes (W) in M2-BMDMs after different treatment (n = 3). All statistical data are presented as mean ± SD; data were analyzed with two-tailed unpaired t tests; **, p < 0.01; ***, p < 0.001.
Figure 4
Figure 4
Nano-IFNγ/Zole induced trans-differentiation of TAMs from M2 to M1 type after iRFA. (A) Schematic illustration of the transcriptomic analysis of tumors after iRFA and Nano-IFNγ/Zole treatment. (B) Heatmap of DEGs associated with tumor progression and immune regulation after indicated treatment (n = 3). (C-E) GO analysis (C), KEGG analysis (D), and GSEA plot (E) of DEGs after indicated treatment (n = 3). (F) Representative t-SNE plots of tumor-infiltrating immune cell subpopulation 12 days after indicated treatment, using full spectrum FCM. (G-M) Percentage of tumor-infiltrating M2-TAMs(G), M1-TAMs(H), Ly6G+ MDSCs (I), Ly6C+ MDSCs (J), CD8+ T cells (K), Treg cells (L) and PD-1+TIM-3+ exhausted T cells (M) after indicated treatment (n = 3). (N) Schematic illustration of the dynamic analysis of TAMs differentiation after iRFA and Nano-IFNγ/Zole treatment. (O-R) Percentage of tumor-infiltrating CD86+/CD80+ M1-TAMs (O and P) and CD163+/CD206+ M2-TAMs (Q and R) in different groups 2 days or 9 days after indicated treatment (n = 4). (R-T) Tumor-infiltrating cytokines IL-1β (T), TNF-α (U), and IL-10 (V) 2 days or 9 days after indicated treatment (n = 3). (V and W) qRT-PCR analysis of M1-type genes (V) or M2-type genes (W) expressed in sorted TAMs from tumor tissue after indicated treatment (n = 4). All statistical data are presented as mean ± SD; data were analyzed with two-tailed unpaired t tests; ns, no significance; *, p < 0.05; **, p < 0.01; ***, p < 0.001.
Figure 5
Figure 5
TAM trans-differentiation induced by Nano-IFNγ/Zole relies on the synergistic effect of IFNγ and zoledronate on mevalonate metabolism inhibition. (A) Schematic illustration of the mevalonate pathway and the mechanism of bisphosphonates in this pathway. (B-E) Mechanism study of BMDM trans-differentiation, by detecting the expression of CD86 and CD206 on F4/80+ BMDMs (B), and the release of cytokines TNF-α (C), IL-12p70 (D) and IL-10 (E) by BMDMs (n = 3~4). (F) Heat map for protein expressing profile of M2-BMDMs after indicated treatment (n = 3). (G) Expression of Rab5 and Rab7 in M2-BMDMs after indicated treatment. (H) Representative fluorescence images and corresponding quantification of lysosome acidification of M2-BMDMs after indicated treatment (n = 30~31 cells), scale bar: 50 μm. (I) Expression of STAT1, pSTAT1 and TFEB in M2-BMDMs after indicated treatment. (J and K) Representative fluorescence images (J) and corresponding quantification (K) of Cy5-labeled OVA retained in M2-BMDMs after indicated treatment (n = 12 cells), scale bar: 50 μm. (L) FCM analysis of antigen cross-presentation ability of M2-BMDMs after indicated treatment (n = 4). All statistical data are presented as mean ± SD; data were analyzed with two-tailed unpaired t tests; ns, no significance; *, p < 0.05; **, p < 0.01; ***, p < 0.001.
Figure 6
Figure 6
Nano-IFNγ/Zole inhibits the recurrence of subcutaneous CRC after iRFA by reshaping the suppressive TIME. (A) Schematic illustration of the assessment of the in vivo anti-tumor efficacy of Nano-IFNγ/Zole and its synergistic effect with PD-L1 antibody; i.t., intratumoral injection; i.p. intraperitoneal injection. (B and C) Growth curves of tumor volume after different treatment (n = 5~6). (D) Relative tumor inhibition rate based on tumor weight (n = 5~6). (E) Survival curves of all experiment groups (n=5~6). (F-I) Representative FCM plots and corresponding quantification of tumor-infiltrating M1-TAMs (F), M2-TAMs (G), CD8+ T cells (H) and Treg cells (I) after different treatment (n = 4). (J-L) Representative FCM plots and corresponding quantification of spleen-infiltrating CD8+ T cells (J), matured DC cells (K), and effector memory T cells (L) after different treatment (n = 4). All statistical data are presented as mean ± SD; data were analyzed with two-tailed unpaired t tests; ns, no significance; *, p < 0.05; **, p < 0.01; ***, p < 0.001.
Figure 7
Figure 7
Nano-IFNγ/Zole inhibits the metastasis of subcutaneous CRC and the recurrence of in-situ CRCLM after iRFA. (A) Schematic illustration of the assessment of the distant anti-tumor efficacy of Nano-IFNγ/Zole and its synergistic effect with PD-L1 antibody; i.t., intratumoral injection; i.p. intraperitoneal injection. (B and C) Growth curves of tumor volume of primary tumors (B) and distant tumors (C) after different treatment (n = 5~6). (D) Relative tumor inhibition rate of primary tumors (n = 5~6). (E) Weight of the distant tumors (n = 5~6). (F and G) FCM analysis of tumor-infiltrating M1-TAMs (F), M2-TAMs (G) in distant tumors after different treatment (n = 4). (H) Immunofluorescence images of tumor-infiltrating macrophages and neutrophils in distant tumors, scale bar: 2 mm. (I to K) FCM analysis of tumor-infiltrating matured DC cells (I), CD8+ T cells (J) and Treg cells (K) in distant tumors after different treatment (n = 4). (L) Schematic illustration of the assessment of in-situ anti-tumor efficacy of Nano- IFNγ/Zole plus PD-L1 antibody against CRCLM; i.t., intratumoral injection. PD-L1 antibody was administered intratumorally at 3.75 mg/kg. (M) T2-weighted MRI images of mice abdomen after different treatment. (n = 4). (N and O) Photograph (N) and corresponding weight of (O) liver tumors after different treatment (n = 3). (P) Photographs and corresponding volume of ascitic fluid collected from mice abdomen after different treatment (n = 3). All statistical data are presented as mean ± SD; data were analyzed with two-tailed unpaired t tests; ns, no significance; *, p < 0.05; **, p < 0.01; ***, p < 0.001.

Similar articles

Cited by

References

    1. Chu KF, Dupuy DE. Thermal ablation of tumours: biological mechanisms and advances in therapy. Nat Rev Cancer. 2014;14:199–208. - PubMed
    1. Stewart CL, Warner S, Ito K, Raoof M, Wu GX, Kessler J. et al. Cytoreduction for colorectal metastases: liver, lung, peritoneum, lymph nodes, bone, brain. When does it palliate, prolong survival, and potentially cure? Curr Probl Surg. 2018;55:330–379. - PMC - PubMed
    1. Crocetti L, de Baere T, Lencioni R. Quality improvement guidelines for radiofrequency ablation of liver tumours. Cardiovasc Intervent Radiol. 2009;33:11–17. - PMC - PubMed
    1. Chen M, Peng Z, Xu L, Zhang Y, Liang H, Li J. Role of radiofrequency ablation in the treatment of hepatocellular carcinoma: experience of a cancer center in China. Oncology. 2011;81:100–104. - PubMed
    1. Shi L, Wang J, Ding N, Zhang Y, Zhu Y, Dong S. et al. Inflammation induced by incomplete radiofrequency ablation accelerates tumor progression and hinders PD-1 immunotherapy. Nat Commun. 2019;10:5421. - PMC - PubMed

Publication types

MeSH terms