. 2025 Jan 1;15(3):850-874.
doi: 10.7150/thno.100079. eCollection 2025.

Ex vivo enhancement of CD8+ T cell activity using functionalized hydrogel encapsulating tonsil-derived lymphatic endothelial cells

Affiliations

Ex vivo enhancement of CD8+ T cell activity using functionalized hydrogel encapsulating tonsil-derived lymphatic endothelial cells

Heesun Hong et al. Theranostics. .

Abstract

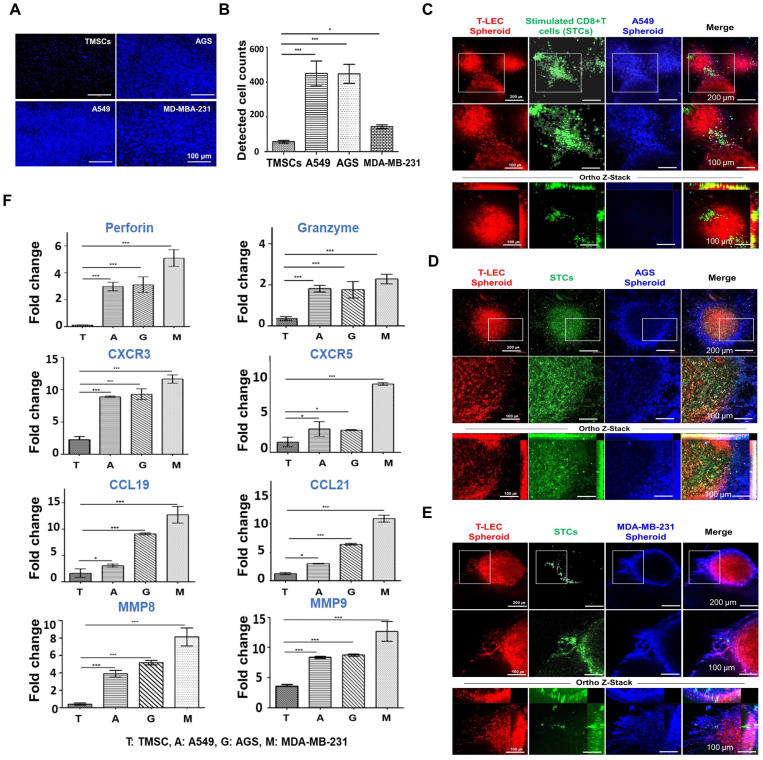
Rationale: This study investigates a method for programming immune cells using a biomaterial-based system, providing an alternative to traditional ex vivo cell manipulation techniques. It addresses the limitations of engineered adoptive T cell therapies, such as T cell exhaustion, by introducing a gelatin-hyaluronic acid (GH-GMA) hydrogel system. Methods: We characterized tonsil mesenchymal stem cells (TMSCs), lymphatic endothelial cells (T-LECs), stimulated T-CD8+ T cells (STCs), and GH-GMA biomaterials. The 10% 5:1 GH-GMA hydrogel, loaded with anti-CD28, cytokines interleukin-2 (IL-2) and vascular endothelial growth factor C (VEGF-C), forms a functional hydrogel capable of releasing these immune-stimulating factors. T-LEC spheroids, derived from tonsil mesenchymal stem cells (TMSCs), were encapsulated within the hydrogel to act as antigen-presenting cells for T cells. Results: Co-encapsulation of STCs and T-LEC spheroids in the functional hydrogel resulted in significant expansion and enrichment of STCs during cultivation. Moreover, when cancer cells were co-encapsulated with STCs and T-LECs, there was increased migration of STCs towards the cancer cells and elevated expression of PD-L1 on the cancer cells. Conclusions: These findings suggest that the GH-GMA hydrogel, combined with anti-CD28, IL-2, VEGF-C, and T-LEC spheroids, enhances T cell activity, presenting a promising platform for cancer immunotherapies and modulation of the suppressive tumor microenvironment.

Keywords: Cancer immunology; Gelatin-hyaluronic acid based hydrogel; T cell activation; Tonsil derived CD8+ T cells; Tonsil derived lymphatic endothelial cells.


Conflict of interest statement

Competing Interests: The authors have declared that no competing interest exists.

Figures

Figure 1
Figure 1
Synthesis, preparation, and characterization of GH-GMA pre-hydrogel. (A) Synthetic scheme of HA-GMA: Hyaluronic acid (HA) is modified with glycidyl methacrylate (GMA) through reaction with carboxyl or hydroxyl moieties on HA. (B) Synthetic scheme of Gel-GMA: Gelatin is conjugated with GMA, reacting with primary amine or hydroxyl groups on the gelatin. Both reactions proceed through transesterification or epoxy ring opening. (C) Schematic representation of GH-GMA hydrogel formation: Crosslinking between Gel-GMA and HA-GMA produces a hybrid GH-GMA hydrogel. UV irradiation with LAP generates free radicals, crosslinking liquid GH-GMA via vinyl polymerization. (D) 1H-NMR of GH-GMA pre-hydrogel. Peaks at δ = 6.2 ppm and δ = 5.7 ppm (a, b) correspond to the methacrylate group, while the peak at δ = 1.9 ppm (c) represents methyl protons. (E) FT-IR Spectroscopic analysis, and (F) X-ray diffraction (XRD) patterns (see Figure S2 for detail pattern).
Figure 2
Figure 2
Characterization of GH-GMA hydrogel. (A) Rheological analysis: Comparison of storage (G') and loss (G'') modulus using a rheometer of pre-hydrogels (B) Scanning electron microscopic (SEM) findings (Scale bar showed 100 µm), (C) in vitro swelling test in PBS (pH7.0) for 6 h, (D) swollen status at 1.5 h after immersed in PBS, (E) in vitro degradation of hydrogels in PBS contained 40 mU/ml of hyaluronidase for 72 h, and (F) IL-2 cytokine release test by ELISA of hydrogels. 10% GH-GMA composites at different compositions (3:1, 5:1, and 7:1 of Gel-GMA and HA-GMA) were compared with 10% Gel-GMA and 5% HA-GMA) in all tests. Three independent experiments were performed in all analysis.
Figure 3
Figure 3
Characterization of human tonsil-derived mesenchymal stem cells (TMSCs). (A) Morphological changing of TMSCs were observed in a passage dependent manner using inverted microscope (x40), scale bar=500 μm (see Figure S1 for the flow chart). (B) Immunophenotypic changes of TMSCs with passage dependent analysis. Specific antigenicity of TMSCs were characterized and analyzed with mesenchymal stem cell-specific surface markers (CD44, CD73, CD90, and CD105), and haematopoietic & immune cell markers (CD34, CD11b, CD19, CD45, and CD HLA-DR) using flow cytometer. (C) qRT-PCR. Stemness confirmation of induced TMSCs with specific gene expression (OCT4, SOX2, NANOG, and c-Myc) by qRT-PCR from passage dependent. Non-induced TMSCs were used as a control. (see Figure S3A for gel electrophoresis). (D-F) qRT-PCR. After trilineage differentiation of TMSCs, specific gene expression was compared at the day 3 (passage no 1), day 7 (passage no 2), and day 15 (passage no 4) compared to non-induced TMSCs as a control. (D) LPL, PPAR-γ, and FABP4 involved in adipogenesis, (E) COL2A1, aggrecan, and SOX9 are involved in chondrogenesis, and (F) OC, ALPL, and BMP2 involved in osteogenesis. (see Figure S3B for gel electrophoresis). Gene expression levels were normalized to that of GAPDH, and showed in fold changes as marker gene vs GAPDH ratio. (G-I) Immunostaining. On the 21st day of the induction culture, trilineage differentiation of TMSCs at passages no 1, 3, and 5 was compared with BMSCs (passage no 3). Evaluation of (G) adipogenic differentiation by Oil Red O staining to visualize lipid accumulation, (H) chondrogenic differentiation potential by Alcian blue staining to see glycosaminoglycan, and (I) osteogenic differentiation by Alizarin red staining to visualize calcium deposition. Magnification x40. Scale bar = 500 μm. Three independent experiments were performed in all analysis. Data are expressed as the means ± S.D. of triplicate samples. *p < 0.05, **p < 0.01, ***p < 0.001.
Figure 4
Figure 4
Evaluations of tonsil derived lymphatic endothelial cells (T-LEC) and T-LEC based spheroids. (A) Development of T-LECs and formation of T-LEC spheroids. (l) Inverted microscopic observation was performed cultivation day at 5, 10, 15, and 20 compared to non-induced TMSCs. (r) Generated T-LEC spheroids were stained with lymphatic specific marker, podoplanin and DAPI for nuclear at induction day 5. Scale bar= 200 µm. (B) Flow cytometry quantification. Generated T-LEC at day 5 and day 14 were analyzed using flow cytometer stained with LEC specific markers, VEGF-R3, Prox-1, LYVE-1, and PDPL. (See Figure S4A for their plots). (C) qRT-PCR. Lymphatic specific gene expression in induced T-LECs were analyzed using VEGF-R3, Prox-1, LYVE-1, and PDPL compared with CD31 and Flk1 genes. HUVEC and non-induced TMSCs were used as controls. (See Figure S4B for the result of gel electrophoresis) (D) Lymphatic network formation using MatrigelTM of induced T-LECs and confirmation of their specific phenotypes with podoplanin (PDPL), VEGF-R3, LYVE-1, and Prox-1 by immunofluorescent staining. DAPI (blue) used for nuclear staining. Scale bar = 200 µm. (See Figure S4C for enlarged images of small boxes highlighted in Figure 4D) (E-G) Characteristics of T-LEC spheroids encapsulated in the hydrogels. T-LEC spheroids were encapsulated in 10% Gel-GMA, 5% HA-GMA, three 10% GH-GMA composite-hydrogels supplemented with VEGF-C for 3 days. (E) Cell viability test using Live & Dead assay with Calcein AM (live cells, green) and ethidium homodimer-1 (dead cells, red) in the hydrogel. Scale bar = 100 µm. (F) Lymphatic sprouting activity of induced T-LEC spheroids. (G) Enlarged area of the T-LEC spheroid that is highlighted in (F). Scale bar = 50 µm (F) and 100 µm (E and G), respectively. Experiments were performed three times replicate. Data are expressed as the mean ± S.D. *p < 0.05, **p < 0.01, ***p < 0.001. ns = no significant for Figure 4B-C.
Figure 5
Figure 5
Preparation and Characterization of stimulated CD8+ T cells (STCs). (A) Morphologies during activation and expansion of sorted tonsil derived CD4+ and CD8+ T cells by anti-CD3 and anti-CD28 antibodies supplemented with IL-2 up to 10 days cultivation. Scale bars= 500 μm (x40) and 200 μm (x100) (See Figure S5-6 for more details) (B-D) Flow cytometry. (B) CD4+ or CD8+ T cell populations before sorting by flow cytometer. (C) Quantification of cell populations. (D) Proliferated T cell population after both sorting and 2 steps activation. (E-F) Double color analysis CD8+ T cells from PBMC and tonsils after 3 days activation. Each cell was stained with anti-CD8 APC/anti-CD69 PE and anti-CD62L PE/anti-CD44 FITC monoclonal antibodies. (E) Plots and (F) quantification of flow cytometer. (G-I) The secretion of intracellular cytokines, IL-2 and IFN-γ, by STCs (G) Plots after double staining using flow cytometry. (H-I) ELISA. (H) IL-2 and (I) IFN-γ. Mock samples were utilized as controls, representing the unstimulated CD8+ T cells. Experiments were performed three times replicate. Data are expressed as the mean ± S.D. *p < 0.05, **p < 0.01, ***p < 0.001.
Figure 6
Figure 6
Co-encapsulation of induced T-LEC spheroid and STCs in the functionalized hydrogel. (A) Co-encapsulation of induced T-LEC spheroid and STCs for 1 day and 3 days cultivation in 10% 5:1 GH-GMA hydrogel supplemented with IL-2 and VEGF-C. T-LEC spheroid was stained with podoplanin (red), CD8+ T cell with CD8 (green) and nucleus with DAPI (blue). Scale bars = 100 µm, 50 µm and 20 µm, from top to bottom. (B) T cell migration-related genes using quantitative RT-PCR. Encapsulated T-LEC spheroid and STCs in 10% 5:1 GH-GMA hydrogel supplemented IL-2 and VEGF-C was analyzed with CCR7, CXCR3, LFA-1, and ICAM-1 for T cell homing abilities. TMSCs in 10% 5:1 GH-GMA hydrogel without IL-2 used as a control. Data were quantified and normalized to the expression levels of GAPDH. (C) Quantitative analysis of IL-2 secretion from STCs co-culture with or without T-LEC spheroids. 2D liquid culture and 3D culture in 10% 5:1 GH-GMA hydrogel were compared. The mock group consisted of culturing only the functional hydrogel without cells. Each supernatant from culture condition were collected from the indicated cell cultures at day 1 and day 3. Experiments were performed three times replicate. Data are expressed as the mean ± S.D. (n=3, *p < 0.05, **p < 0.01, ***p < 0.001, and ns = no-significant).
Figure 7
Figure 7
Ex vivo reconstituted 3D organotypic culture with cancer spheroids (see Figure S7 for experimental setting) (A-B) STCs migration assay (A) DAPI staining of STCs migrated from upper chamber, Scale bar = 100 µm. (B) Quantification of DAPI staining. Graph shows a comparison of migratory activity represented in the average number of transmigrated STCs per microscopic field of different cancer cell lines. (C-E) Ex vivo organotypic culture of (C) A549, (D) AGS, and (E) MDA-MB-231 cancer cell lines with encapsulated T-LEC and STCs in 10% 5:1 GH-GMA hydrogel for 3 days. Each cancer cell line was stained with podoplanin for T-LEC (red), CD8 for CD8+ T cell (green), and cell tracker violet (blue) for each cancer cell lines, and detected confocal microscope. Scale bar = 200 µm, 100 µm, and 100 µm from top to bottom. (F) Quantitative RT-PCR for ex vivo organotypic culture with cancer spheroids for 3 days. Perforin, Granzyme, CXCR3, CXCR5, CCL19, CCL21, MMP8, and MMP9 were quantified and normalized to the expression levels of GAPDH. Experiments were performed three times replicate. Data are expressed as the mean ± S.D. n=3, *p < 0.05, **p < 0.01, ***p < 0.001.
Figure 8
Figure 8
PD-L1 expression from cancer cell lines under ex vivo organotypic culture. Three cancer cell lines were encapsulated in a functional hydrogel (10% 5:1 GH-GMA hydrogel including IL-2 and VEGF-C) containing T-LEC and STCs. (A-C) Flow cytometry. (A) PD-L1 expression plots. (B) Quantification of PD-L1 positive cell population and (C) Mean Fluorescent Intensity (MFI) of PD-L1 positive cell population. Mock condition was cancer cell lines only. (D) Immunofluorescent staining of PD-L1 expressed on three cancer cell lines under ex vivo organotypic culture with functional hydrogel containing T-LEC and STCs. Scale bar = 100 μm (See Figure S8 for enlarged images of small boxes highlighted in Figure 8D). Experiments were performed three times replicate. Data are expressed as the mean ± S.D. n=3, *p < 0.05, **p < 0.01, ***p < 0.001 for Figure 8B-C.

Similar articles

Cited by

References

    1. Isser A, Livingston NK, Schneck JP. Biomaterials to enhance antigen-specific T cell expansion for cancer immunotherapy. Biomaterials. 2021;268:120584. - PMC - PubMed
    1. Li J, Luo Y, Li B, Xia Y, Wang H, Fu C. Implantable and injectable biomaterial scaffolds for cancer immunotherapy. Front bioeng biotechnol. 2020;8:612950. - PMC - PubMed
    1. Qin Y-T, Li Y-P, He X-W, Wang X, Li W-Y, Zhang Y-K. Biomaterials promote in vivo generation and immunotherapy of CAR-T cells. Front immunol. 2023;14:1165576. - PMC - PubMed
    1. Dunn ZS, Mac J, Wang P. T cell immunotherapy enhanced by designer biomaterials. Biomaterials. 2019;217:119265. - PMC - PubMed
    1. Altman A, Coggeshall KM, Mustelin T. Molecular events mediating T cell activation. Adv Immunol. 1990;48:227–360. - PubMed

Publication types

MeSH terms