. 2025 Jan 1;15(3):766-783.
doi: 10.7150/thno.95334. eCollection 2025.

Vascularized tumor on a microfluidic chip to study mechanisms promoting tumor neovascularization and vascular targeted therapies

Affiliations

Vascularized tumor on a microfluidic chip to study mechanisms promoting tumor neovascularization and vascular targeted therapies

Magdalena Skubal et al. Theranostics. .

Abstract

The cascade of events leading to tumor formation includes induction of a tumor supporting neovasculature, as a primary hallmark of cancer. Developing vasculature is difficult to evaluate in vivo but can be captured using microfluidic chip technology and patient derived cells. Herein, we established an on chip approach to investigate the mechanisms promoting tumor vascularization and vascular targeted therapies via co-culture of cancer spheroids and endothelial cells in a three dimensional environment. Methods: We investigated both, tumor neovascularization and therapy, via co-culture of human derived endothelial cells and adjacently localized metastatic renal cell carcinoma spheroids on a commercially available microfluidic chip system. Metastatic renal cell carcinoma spheroids adjacent to primary vessels model tumor, and induce vessels to sprout neovasculature towards the tumor. We monitored real time changes in vessel formation, probed the interactions of tumor and endothelial cells, and evaluated the role of important effectors in tumor vasculature. In addition to wild type endothelial cells, we evaluated endothelial cells that overexpress Prostate Specific Membrane Antigen (PSMA), that has emerged as a marker of tumor associated neovasculature. We characterized the process of neovascularization on the microfluidic chip stimulated by enhanced culture medium and the investigated metastatic renal cell carcinomas, and assessed endothelial cells responses to vascular targeted therapy with bevacizumab via confocal microscopy imaging. To emphasize the potential clinical relevance of metastatic renal cell carcinomas on chip, we compared therapy with bevacizumab on chip with an in vivo model of the same tumor. Results: Our model permitted real-time, high-resolution observation and assessment of tumor-induced angiogenesis, where endothelial cells sprouted towards the tumor and mimicked a vascular network. Bevacizumab, an antiangiogenic agent, disrupted interactions between vessels and tumors, destroying the vascular network. The on chip approach enabled assessment of endothelial cell biology, vessel's functionality, drug delivery, and molecular expression of PSMA. Conclusion: Observations in the vascularized tumor on chip permitted direct and conclusive quantification of vascular targeted therapies in weeks as opposed to months in a comparable animal model, and bridged the gap between in vitro and in vivo models.

Keywords: confocal imaging; microfluidic chip; neovascularization; optoacoustic imaging; targeted therapies.


Conflict of interest statement

Competing Interests: The authors have declared that no competing interest exists.

Figures
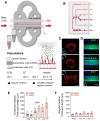
Figure 1
Figure 1
Vascularization model on the microfluidic chip. (A) Visualization and experimental design of vasculature on the MFC. The chip is filled with a collagen-based ECM (gray area) that supports cell growth. Two parallel channels (red and pink, ø100 μm) at the center of the chip allowed the seeding of EC and mimicked vessels. Arrows indicate the direction of constant flow (1 μL/min). (B) Schematic representation of the double channel MFC system built of ECM (gray area), vessels (red and pink), inlet and outlet ports (red and pink arrows) (detailed description in Figure S1) (C) Representative images of the front, side, and 3D view of the channel with red fluorescent protein (RFP) labeled EC. Scale bar 100 μm for all panels. (D) Immunostaining of the organized vessel of endothelial cells EC control confirming the presence of adhesion markers CD31, VE-cadherin and ZO-1 (green) two days after cultured on the MFC system. Scale bars 100 μm. (E) Quantification of EC control (n = 7) and EC PSMA (n = 5) showing accelerated cell sprouting when exposed to enhanced medium. (F) Quantification of EC control (n = 3) and EC PSMA (n = 3) growth when exposed to regular medium. Significance (p) value is based upon a parametric two-tailed unpaired t test.
Figure 2
Figure 2
Vascularized tumor model on the microfluidic chip. (A) Schematic visualization of the set-up with vascularized tumor on the MFC. (B) Confocal microscopy images of EC control and mRCC spheroids co-cultured on the MFC at days 5, 10 and 15. (C) Quantification of mRCC spheroid growth (n = 5). (D) Quantification of EC control (n = 3) and (E) EC PSMA (n = 3) sprouting driven by mRCC spheroids. (F) Immunostaining showing PSMA expression on EC control cells co-cultured with mRCC spheroids for 15 days on the MFC. PSMA (green) expression was induced on the newly formed vessels (CD31, magenta) surrounding the mRCC spheroid. Endothelial and cancer cell nuclei stained with DAPI (blue). Scale bars 100 μm. (G) 2D and (H) 3D visualization of PSMA (green), CD31 (magenta) and DAPI (blue) staining. Scale bars 100 μm. (I) Quantification of induced PSMA expression in the area surrounding mRCC spheroid (n = 3). Displayed p values are based upon a two-tailed t test.
Figure 3
Figure 3
Modelling blood flow and drug delivery. (A) The functionality of tumor associated blood vessels was tested by perfusion of ø10 μm fluorescent beads representing the size of immune cells. Beads injected into the chip (n = 1) with well-developed vasculature (day 15) through the port, entered the chips channels and newly formed vessels surrounding the surface of tumor spheroid. (B) Confocal microscopy images of beads traveling through the chip captured at 0 s and 40 s after injection (additional timepoints in Figure S9). Left panels represent mRCC spheroids with EC and green fluorescent beads (white light with green fluorescence channel), while the right panels represent red labeled EC with green labeled fluorescent beads (red and green fluorescence channels). Scale bars 100 μm. (C) Beads were tracked while traveling through chip channels and vasculature and became lodged within the vascular network surrounding the cancer spheroid. (D) Beads tracks and their mean speed. (E) Schematic illustration of fluorescence signal retention tested by perfusion of fluorescein (0.001 g/mL) through multiple chips (n = 4) at days ranging from 5-10. Fluorescein was pumped into the chip through the bottom channel for 120 min followed by a washing out phase by pumping regular (fluorescein free) medium for 420 min. (F) Confocal microscopy images showing clear fluorescein retention in the mRCC spheroid at 0 min, 90 min (0-120 min fluorescein wash in phase), 150 min and 240 min (120-240 min fluorescein wash out phase). (G) Quantification of fluorescence signal retained in the mRCC spheroids. Scale bars 100 μm.
Figure 4
Figure 4
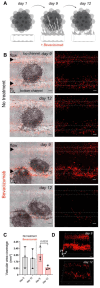
Vascular targeted therapy on the microfluidic chip. (A) The response to vascular targeted therapy on the MFC evaluated by treatment with bevacizumab. EC controls were co-cultured with mRCC spheroids for 9 days followed by perfusion with either regular EC medium (no treatment, n = 3) or EC medium supplemented with 250 μg/mL of bevacizumab (46) (n = 3) for 3 days. (B) Confocal microscopy images of chips before (day 9) and after (day 12) bevacizumab treatment. Left panels represent mRCC spheroids (no fluorescence) with endothelial cells (red fluorescence), right panels represent endothelial cells (red fluorescence only). Scale bars 100 μm. (C) Quantification of cell coverage before and after treatment. (D) 3D visualization of EC response to bevacizumab therapy before (day 9) and after (day 12) treatment. Significance (p) value is based upon a parametric two-tailed unpaired t test.
Figure 5
Figure 5
Vascular targeted therapy in vivo. (A) Response of mRCC mouse xenografts to vascular targeted therapy with bevacizumab. (B) mRCC tumors volume measured before and after treatment: mRCC tumors were grown for 100 days before receiving either saline (control group, 50 uL saline each, n = 7) or bevacizumab (treated group, 20 mg/kg bevacizumab in saline each, n = 8) 3 times a week for 2 weeks. (C) Representative RSOM images taken 24 h before treatment commencement (day 100), and 24 h after treatment completion (day 115). Images of large vessels (11-33 MHz) and small vessels (33-99 MHz). Scale bars 1 mm. The arrow highlights a tracked vessel for both conditions with the treated mouse showing vessel disruption in response to bevacizumab. Quantification of (D) vascular length, (E) vascular area fraction, (F) number of branches, (G) vessel tortuosity and (H) nearest neighbor distance (NND). Displayed p values are based upon a two-tailed t test.

Update of

Similar articles

Cited by

References

    1. Hanahan D. Hallmarks of Cancer: New Dimensions. Cancer Discov. 2022;12(1):31–46. - PubMed
    1. Carmeliet P, Jain RK. Angiogenesis in cancer and other diseases. Nature. 2000;407(6801):249–57. - PubMed
    1. Siemann DW, Horsman MR. Vascular targeted therapies in oncology. Cell Tissue Res. 2009;335(1):241–8. - PMC - PubMed
    1. Sharma SV, Haber DA, Settleman J. Cell line-based platforms to evaluate the therapeutic efficacy of candidate anticancer agents. Nat Rev Cancer. 2010;10(4):241–53. - PubMed
    1. Mak IW, Evaniew N, Ghert M. Lost in translation: animal models and clinical trials in cancer treatment. Am J Transl Res. 2014;6(2):114–8. - PMC - PubMed

MeSH terms

LinkOut - more resources