. 2025 Jan 1;15(3):836-849.
doi: 10.7150/thno.101882. eCollection 2025.

Monitoring of cancer ferroptosis with [18F]hGTS13, a system xc- specific radiotracer

Affiliations

Monitoring of cancer ferroptosis with [18F]hGTS13, a system xc- specific radiotracer

Abraham Moses et al. Theranostics. .

Abstract

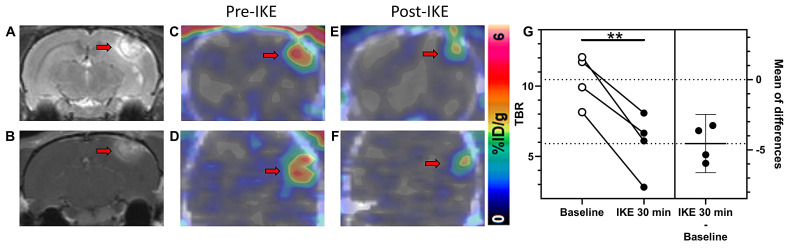
Glioblastoma multiforme (GBM) is the most common and aggressive primary brain tumor in adults, characterized by resistance to conventional therapies and poor survival. Ferroptosis, a form of regulated cell death driven by lipid peroxidation, has recently emerged as a promising therapeutic target for GBM treatment. However, there are currently no non-invasive imaging techniques to monitor the engagement of pro-ferroptotic compounds with their respective targets, or to monitor the efficacy of ferroptosis-based therapies. System xc-, an important player in cellular redox homeostasis, plays a critical role in ferroptosis by mediating the exchange of cystine for glutamate, thus regulating the availability of cysteine, a crucial precursor for glutathione synthesis, and influencing the cellular antioxidant defense system. We have recently reported the development and validation of [18F]hGTS13, a radiopharmaceutical specific for system xc-. Methods: In the current work, we characterized the sensitivity of various cell lines to pro-ferroptotic compounds and evaluated the ability of [18F]hGTS13 to distinguish between sensitive and resistant cell lines and monitor changes in response to ferroptosis-inducing investigational compounds. We then associated changes in [18F]hGTS13 uptake with cellular glutathione content. Furthermore, we evaluated [18F]hGTS13 uptake in a rat model of glioma, both before and after treatment with imidazole ketone erastin (IKE), a pro-ferroptotic inhibitor of system xc- activity. Results: Treatment with erastin2, a system xc- inhibitor, significantly decreased [18F]hGTS13 uptake and cellular glutathione content in vitro. Dynamic PET/CT imaging of C6 glioma-bearing rats with [18F]hGTS13 revealed high and sustained uptake within the intracranial glioma and this uptake was decreased upon pre-treatment with IKE. Conclusion: In summary, [18F]hGTS13 represents a promising tool to distinguish cell types that demonstrate sensitivity or resistance to ferroptosis-inducing therapies that target system xc-, and monitor the engagement of these drugs.

Keywords: PET imaging; [18F]hGTS13; ferroptosis; system xc-.


Conflict of interest statement

Competing Interests: AM, LR, and CB have filed a provisional application for the method of using system xc- radiotracers in the context of cancer ferroptosis. The authors otherwise declare no conflicts of interest.

Figures

Figure 1
Figure 1
Overview of ferroptosis. System xc imports cystine which enables the biosynthesis of glutathione (GSH). GSH is then used by glutathione peroxidase 4 (GPX4) to prevent the accumulation of lethal lipid ROS by reducing reactive polyunsaturated fatty acids (PUFA) phospholipid hydroperoxides (PUFA-PL-OOH) to non-reactive and non-lethal PUFA phospholipid alcohols (PUFA-PL-OH). PUFA-PLs are oxidized by labile Fe(II) and Fe(II)-dependent enzymes. Ferroptosis may be induced via pharmacological inhibition of system xc (with erastin/sulfasalazine) or inhibition of GPX4 (with RSL3). Ferroptosis can be suppressed by treatment with ferrostatin-1. [18F]hGTS13 is a radiotracer that is specifically transported via system xc-.
Figure 2
Figure 2
Evaluation of erastin2-induced ferroptosis. Overview of erastin2-induced ferroptosis using real-time live cell imaging and flow cytometry. (A-C) Plots of green object fluorescence in HT-1080, H460, and C6 cell lines, respectively, over 24h co-incubation with varying concentrations of erastin2 and 1.5 µM BODIPY 581/591 C11 lipid peroxidation sensor. (D-F) Corresponding plots of cell confluence resulting from treatments in A-C. (G-I) Flow cytometric analyses of HT-1080, H460, and C6 cell lines. Treatments: 0 μM erastin2 (grey); 150 nM erastin2 (orange); 150 nM erastin2 + 1 μM ferrostatin-1 (blue). All treatments were co-incubated with 1.5 µM BODIPY 581/591 C11. Data represent mean +/- SD. (n = 4, each condition).
Figure 3
Figure 3
Evaluation of RSL3-induced ferroptosis. Overview of RLS3-induced ferroptosis using real-time live cell imaging and flow cytometry. (A-C) Plots of green object fluorescence in HT-1080, H460, and C6 cell lines, respectively, over 24h co-incubation with varying concentrations of RSL3 and 1.5 µM BODIPY 581/591 C11 lipid peroxidation sensor. (D-F) Corresponding plots of cell confluence resulting from treatments in A-C. (G-I) Flow cytometric analyses of HT-1080, H460, and C6 cell lines. Treatments: 0 μM RSL3 (grey); 300 nM RSL3 (orange); 300 nM RSL3 + 1 μM ferrostatin-1 (blue). All treatments co-incubated with 1.5 µM BODIPY 581/591 C11.
Figure 4
Figure 4
[18F]hGTS13 uptake and glutathione production in the presence of erastin2. Overview of differential radiotracer uptake and glutathione production in ferroptosis-sensitive and -resistant cell lines in response to treatment with erastin2. (A) Baseline radiotracer uptake in HT-1080, H460, and C6 cells. (B-D) Radiotracer uptake in HT-1080, H460, and C6 cells following treatment with erastin2 (E2) (150 nM) and/or ferrostatin-1 (F) (1 μM) for 12 h. (E) Baseline total glutathione (GSH+GSSG) content. (F-H) Total glutathione (GSH+GSSG) content of HT-1080, H460, and C6 following treatment with erastin2 (150 nM) and/or ferrostatin-1 (1 μM) for 12 h. **p < 0.01, ***p < 0.001, ****p < 0.0001, ns = not significant; 1-way ANOVA, multiple comparisons with Bonferroni correction. E2 = erastin2, F = ferrostatin-1.
Figure 5
Figure 5
[18F]hGTS13 uptake and glutathione production in the presence of RSL3. Overview of differential radiotracer uptake and glutathione production in ferroptosis-sensitive and -resistant cell lines in response to treatment with RSL3. (A) Baseline radiotracer uptake in HT-1080, H460, and C6 cells. (B-D) Radiotracer uptake in HT-1080, H460, and C6 cells following treatment with RSL3 (300 nM) and/or ferrostatin-1 (1 μM) for 2.5h. (E) Baseline total glutathione (GSH+GSSG) content. (F-H) Total glutathione (GSH+GSSG) content of HT-1080, H460, and C6 following treatment with RSL3 (300 nM) and/or ferrostatin-1 (1 μM) for 2.5h. *p < 0.05, **p < 0.01, ***p < 0.001, ****p < 0.0001. ns = not significant. 1-way ANOVA, multiple comparisons with Bonferroni correction. F = ferrostatin-1.
Figure 6
Figure 6
[18F]hGTS13 Uptake in C6 orthotopic glioma-bearing rats. In vivo and ex vivo evaluation of [18F]hGTS13 uptake and retention. (A) Representative [18F]hGTS13 MRI and fused PET/MRI image of orthotopic C6 glioma-bearing rat, summed 30 - 60 min post-injection. (B) Time activity curves of [18F]hGTS13 uptake in C6 glioma and healthy contralateral brain. (C) Ex vivo autoradiography, H&E staining, and corresponding overlay of an excised rat brain bearing an orthotopic C6 glioma following PET/MR imaging.
Figure 7
Figure 7
[18F]hGTS13 PET-based monitoring of pro-ferroptotic drug engagement. In vivo monitoring of drug engagement using [18F]hGTS13-PET. Representative (A) T1- and (B) T2-weighted MR images of C6 glioma-bearing rat. (C) Axial and (D) coronal PET/CT images of the same rat. (E) Axial and (F) coronal PET/CT images of the same rat 48 h later, following administration of IKE at 25 mg/kg and 30 min treatment. (G) Estimation plot of TBR before (baseline) and after IKE administration (n=4). **p < 0.01; Two-tailed Student's paired t test. Arrow = tumor.
Figure 8
Figure 8
System xc- expression in glioma subsets and healthy brain tissue. Relative fold-changes in system xc- subunit SLC7A11 mRNA expression of glioma subsets compared to healthy brain. WT = GBM, IDH-wild type; IDH = GBM, IDH-mutation; AA = anaplastic astrocytoma; OG = oligodendroglioma; DA = diffuse astrocytoma. Horizontal line bisecting graph = expression of xCT mRNA in healthy brain tissue; baseline expression set to a value of 1.

References

    1. Dixon SJ, Lemberg KM, Lamprecht MR, Skouta R, Zaitsev EM, Gleason CE. et al. Ferroptosis: an iron-dependent form of nonapoptotic cell death. Cell. 2012;149:1060–72. - PMC - PubMed
    1. Stockwell BR. Ferroptosis turns 10: emerging mechanisms, physiological functions, and therapeutic applications. Cell. 2022;185:2401–21. - PMC - PubMed
    1. Liang C, Zhang X, Yang M, Dong X. Recent progress in ferroptosis inducers for cancer therapy. Adv Mater. 2019;31:1904197. - PubMed
    1. Shen Z, Song J, Yung BC, Zhou Z, Wu A, Chen X. Emerging strategies of cancer therapy based on ferroptosis. Adv Mater. 2018;30:1704007. - PMC - PubMed
    1. Holland EC. Glioblastoma multiforme: the terminator. Proc Natl Acad Sci U S A. 2000;97:6242–4. - PMC - PubMed

Publication types

Substances