. 2025 Jan 1;15(3):1185-1204.
doi: 10.7150/thno.98660. eCollection 2025.

OTUB2 contributes to vascular calcification in chronic kidney disease via the YAP-mediated transcription of PFKFB3

Affiliations

OTUB2 contributes to vascular calcification in chronic kidney disease via the YAP-mediated transcription of PFKFB3

Yalan Li et al. Theranostics. .

Abstract

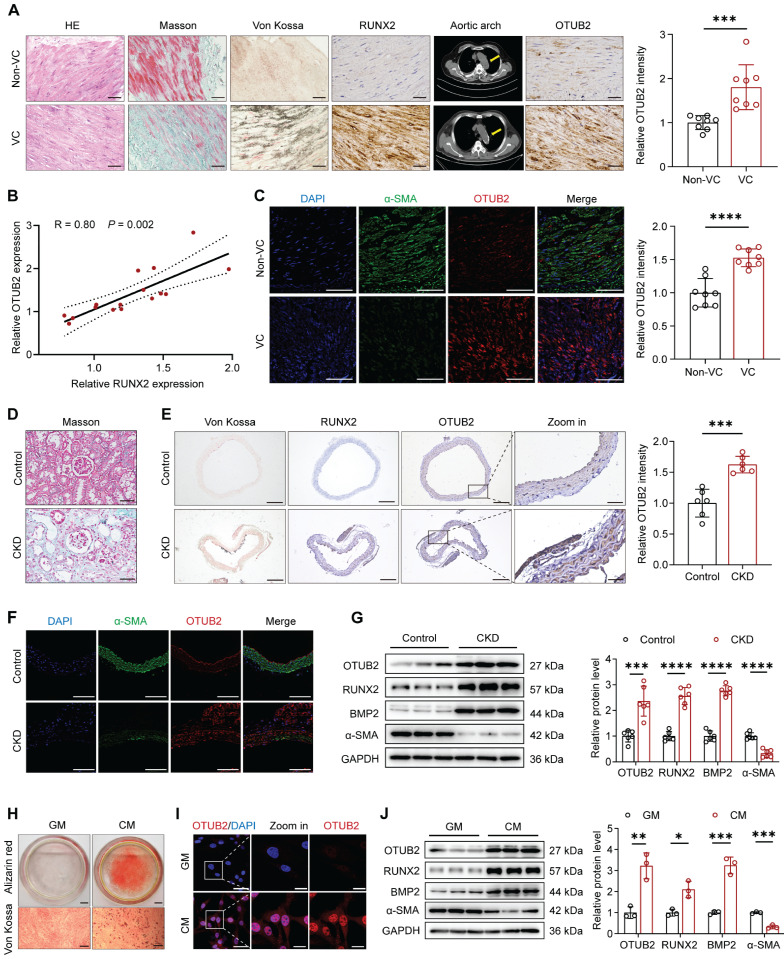
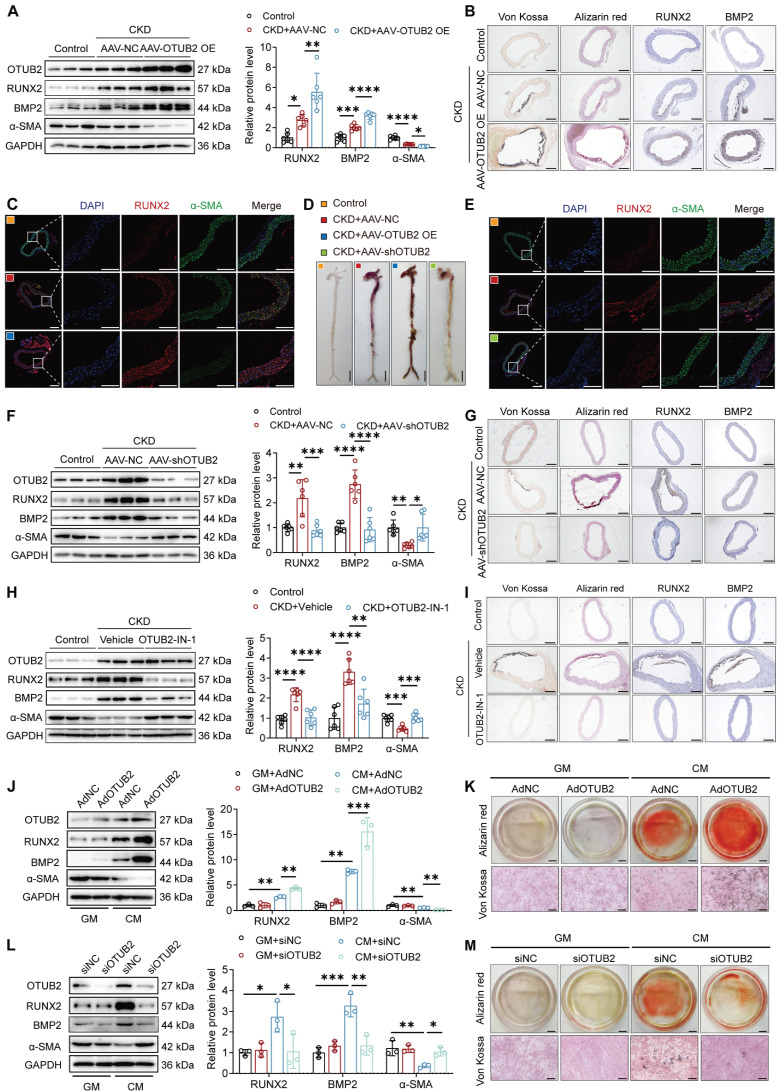
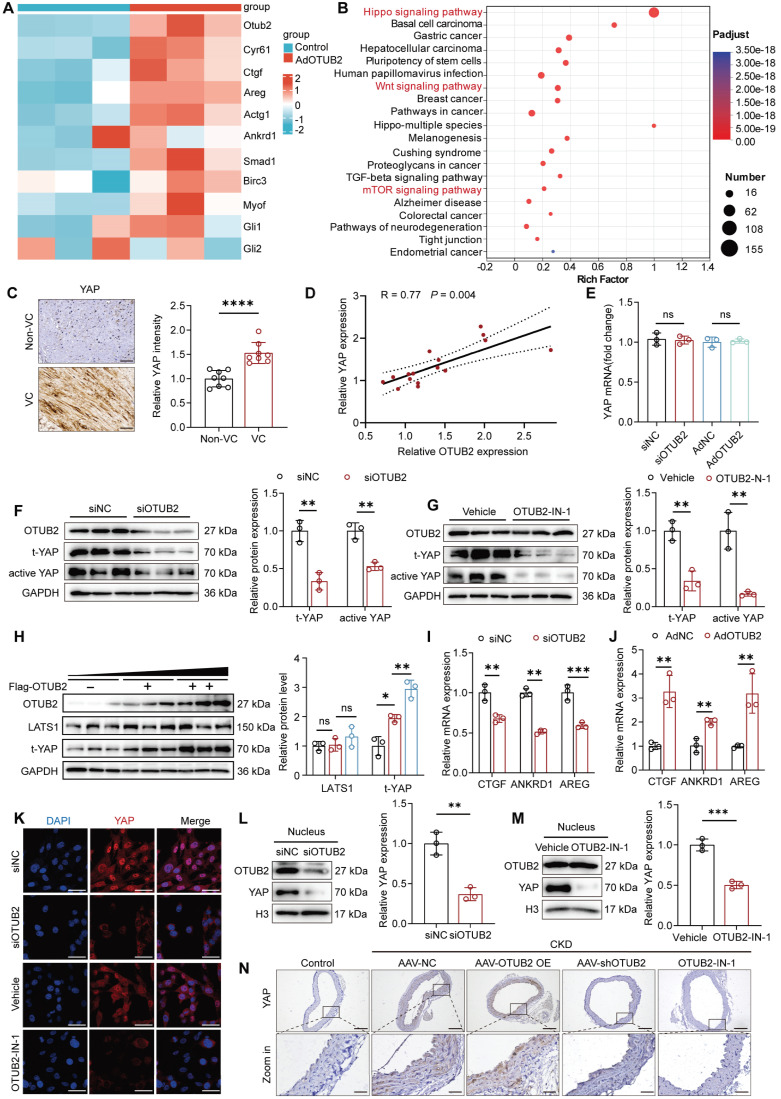
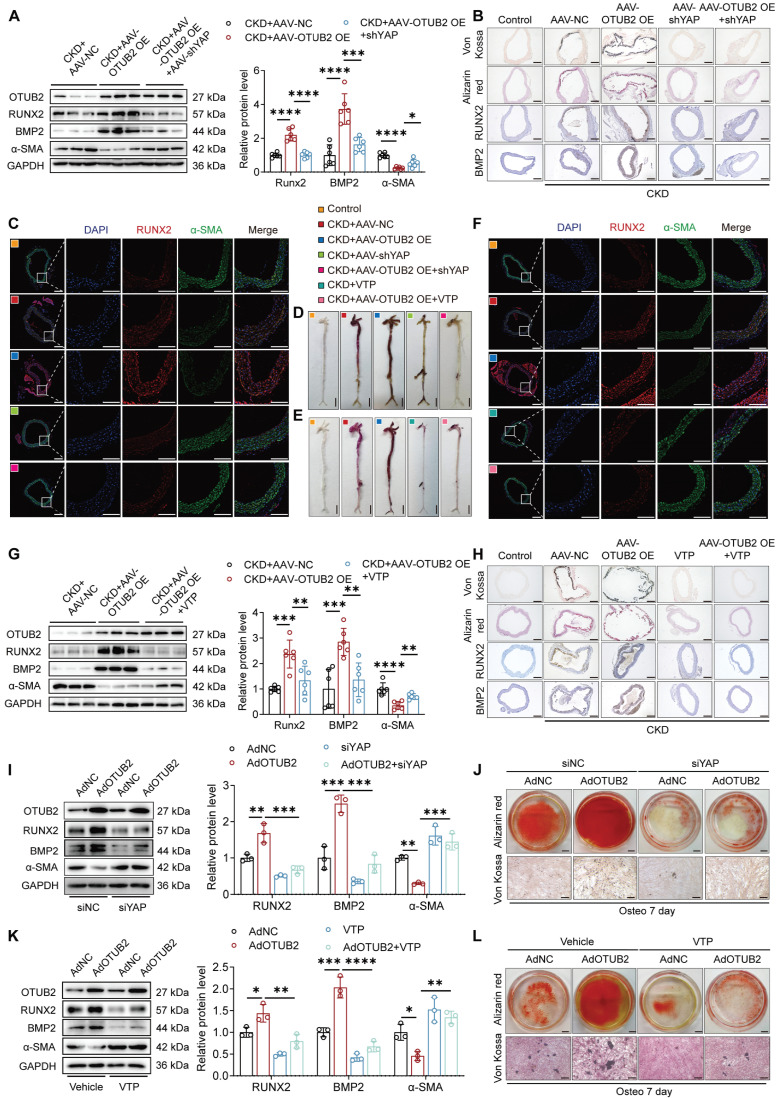
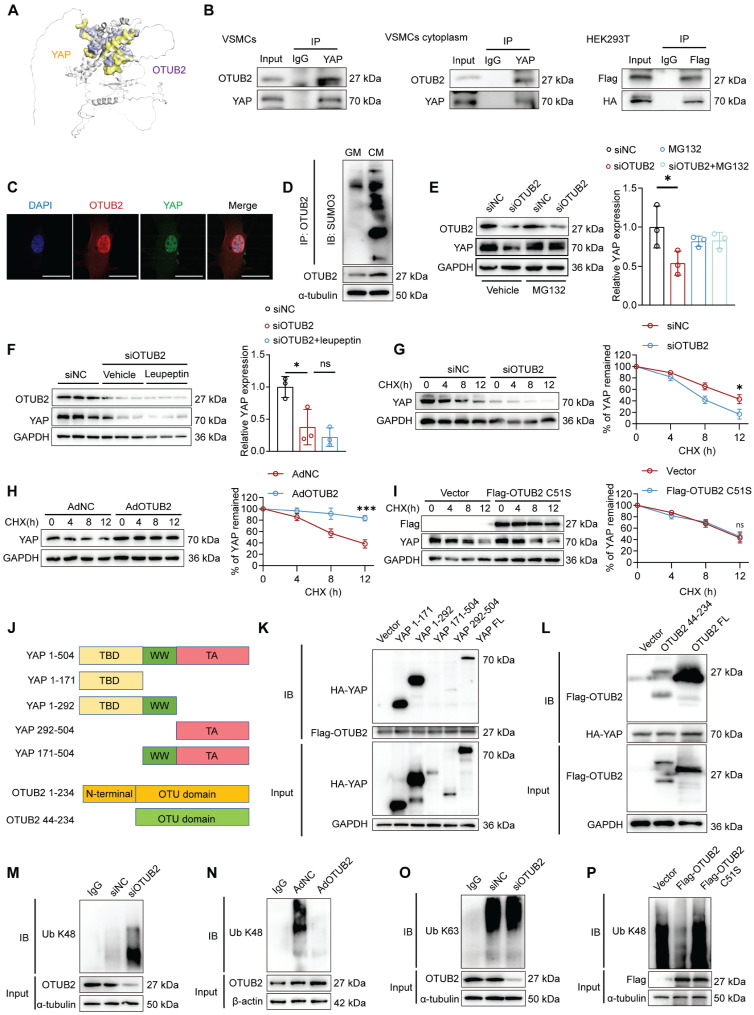
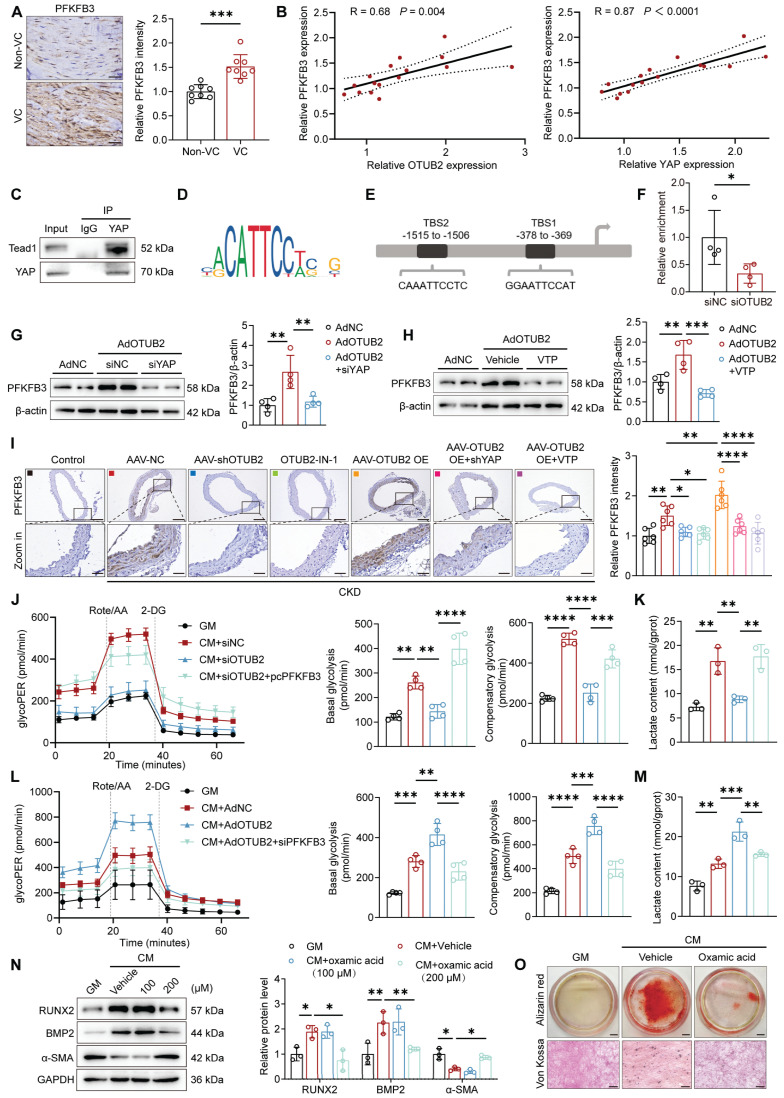
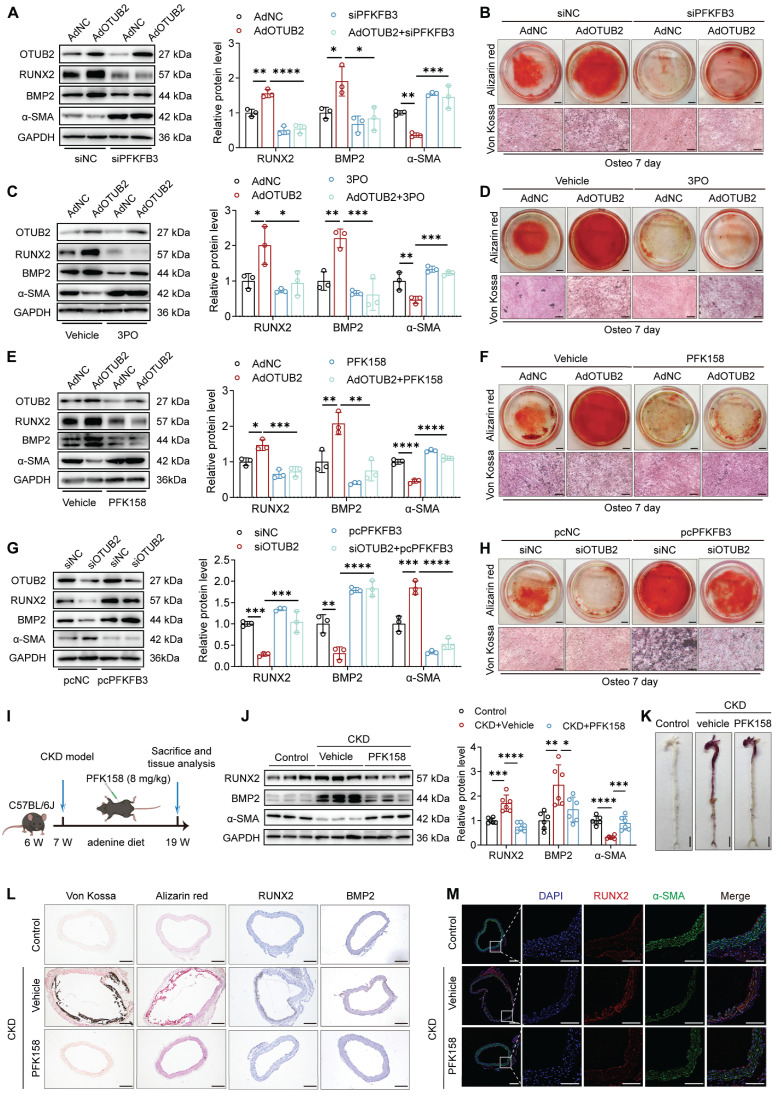
Rationale: Chronic kidney disease (CKD) is a global public health issue, with vascular calcification (VC) being a common and deadly complication. Despite its prevalence, the underlying mechanisms of VC remain unclear. In this study, we aimed to investigate whether and how Otubain-2 (OTUB2) contributes to VC. Methods: The relationship between OTUB2 and VC was examined via immunohistochemical and immunofluorescence staining of discarded calcified radial arteries from uremic patients who underwent arteriovenous fistula operations. Additionally, mice were fed a 0.2% adenine diet supplemented with 1.2% phosphorus to establish a model of CKD-related VC. Vascular smooth muscle cell (VSMC)-specific OTUB2 knockout and overexpression were performed in vivo via the delivery of adeno-associated virus 9 vectors to manipulate the expression of OTUB2. Additionally, a calcified VSMC model was established to explore the roles of OTUB2 in VC by evaluating changes in osteogenic marker expression and calcium deposition. Results: Our results revealed a significant upregulation of OTUB2 expression during VC progression. OTUB2 overexpression upregulated the expression of osteogenic markers and exacerbated VSMC calcification, as verified by Von Kossa and Alizarin red staining. Conversely, VSMC-specific OTUB2 deficiency significantly mitigated adenine diet-induced VC in CKD mice. OTUB2 knockdown or inhibition decreased Yes-associated protein (YAP) abundance. Mechanistically, OTUB2 bound to YAP, decreasing its K48-linked polyubiquitination and inhibiting its subsequent degradation. Knockdown or inhibition of YAP abolished the effect of OTUB2 overexpression on VSMC calcification, indicating a YAP-mediated mechanism. Furthermore, the YAP/TEAD1 complex bound to the promoter of PFKFB3, increasing its transcriptional activity, as determined by CUT&RUN-qPCR. The knockdown or inhibition of PFKFB3 alleviated the procalcific effects of OTUB2. Conclusions: Our findings indicate that OTUB2 promotes VC at least partially by activating the YAP-PFKFB3 signaling pathway. Targeting OTUB2 may be an appealing therapeutic strategy for VC.

Keywords: OTUB2; YAP.; chronic kidney disease; ubiquitin-proteasome degradation; vascular calcification.


Conflict of interest statement

Competing Interests: The authors have declared that no competing interest exists.

Figures

Figure 1
Figure 1
OTUB2 expression is upregulated during VC. (A) Representative images of HE staining, Masson's trichrome staining, Von Kossa staining, and immunohistochemical staining for RUNX2 and OTUB2 expression in radial arteries and multidetector computed tomography (MDCT) scans of CKD patients without or with calcification. Scale bars, 50 μm. n = 8 per group. (B) Scatter dot plot of the correlation between OTUB2 and RUNX2 expression in radial arteries from CKD patients without or with calcification. n = 16. (C) Representative images of immunofluorescence staining for OTUB2 and α-SMA in radial arteries from CKD patients without or with calcification. Scale bars, 100 μm. n = 8 per group. (D) Representative images of Masson's trichrome staining of kidneys from the control and CKD groups. Scale bars, 50 μm. (E) Representative images of Von Kossa staining and immunohistochemical staining for RUNX2 and OTUB2 in the arteries of mice from the control and CKD groups. Scale bars, 200 μm (left panels), 50 μm (right panels). n = 6 per group. (F) Representative images of immunofluorescence staining for OTUB2 and α-SMA in the arteries of the indicated groups. Scale bars, 100 μm. (G) Western blot analysis and quantification of OTUB2, RUNX2, BMP2, and α-SMA expression. n = 6 per group. (H) Representative images of Alizarin red and Von Kossa staining. Scale bars, 5 mm (upper panels), 100 μm (lower panels). (I) Representative images of immunofluorescence staining for OTUB2 expression in VSMCs treated with GM or CM. Scale bars, 50 μm (left panels), 20 μm (right panels). (J) Immunoblots and quantification of OTUB2, RUNX2, BMP2, and α-SMA protein expression in VSMCs treated with GM or CM. n = 3 per group. Statistical significance was assessed using two-tailed t-test (A, C, E, G, J). All values are presented as mean ± SD. *P < 0.05, **P < 0.01, ***P < 0.001, and ****P < 0.0001.
Figure 2
Figure 2
OTUB2 accelerates the development of VC. (A) Western blot analysis of OTUB2, RUNX2, BMP2 and α-SMA expression in aortas. n = 6 per group. (B) Representative images of Von Kossa staining, Alizarin red staining, and immunohistochemical staining for RUNX2 and BMP2 in aortas from the indicated experimental cohorts. Scale bars, 200 μm. (C) Representative images of immunofluorescence staining for RUNX2 and α-SMA in aortas from the different experimental groups. Scale bars, 200 μm (left panels), 100 μm (right panels). (D) Representative images of Alizarin red staining of whole aortas from the indicated experimental groups. Scale bars, 5 mm. (E) Representative images of immunofluorescence staining for RUNX2 and α-SMA in aortas from the different experimental groups. Scale bars, 200 μm (left panels), 100 μm (right panels). (F) Western blot analysis of OTUB2, RUNX2, BMP2 and α-SMA expression in aortas. n = 6 per group. (G) Representative images of Von Kossa staining, Alizarin red staining, and immunohistochemical staining for RUNX2 and BMP2 in aortas from the indicated experimental cohorts. Scale bars, 200 μm. (H) Western blot analysis of OTUB2, RUNX2, BMP2 and α-SMA expression in aortas. n = 6 per group. (I) Representative images of Von Kossa staining, Alizarin red staining, and immunohistochemical staining for RUNX2 and BMP2 in aortas from the indicated experimental cohorts. Scale bars, 200 μm. (J) Western blot analysis of OTUB2, RUNX2, BMP2, and α-SMA expression in VSMCs overexpressing OTUB2. n = 3 per group. (K) Representative images of Alizarin red and Von Kossa staining of VSMCs after transfection of the indicated constructs and CM exposure for another 7 days. Scale bars, 5 mm (upper panels), 100 μm (lower panels). (L) Western blot analysis of OTUB2, RUNX2, BMP2, and α-SMA expression in VSMCs with OTUB2 depletion. n = 3 per group. (M) Representative images of Alizarin red and Von Kossa staining of VSMCs after the transfection of the indicated constructs and CM exposure for another 7 days. Scale bars, 5 mm (upper panels), 100 μm (lower panels). Statistical significance was assessed using one-way ANOVA followed by Dunnett's test (A, F, H, J and L). All values are presented as mean ± SD. *P < 0.05, **P < 0.01, ***P < 0.001, and ****P < 0.0001.
Figure 3
Figure 3
OTUB2 activates YAP in VSMCs. (A) Heatmap of differentially expressed YAP-targeted genes identified using RNA-seq data from VSMCs treated with control adenoviruses or adenoviruses overexpressing OTUB2. (B) KEGG enrichment analysis of the differentially expressed genes in OTUB2-overexpressing VSMCs vs. control VSMCs. (C) Representative images of immunohistochemical staining for YAP in radial arteries from CKD patients. Scale bars, 50 μm. n = 8 per group. (D) Scatter dot plot of the correlation between YAP and OTUB2 expression in radial arteries from CKD patients. n = 16. (E) RT-qPCR analysis of YAP expression after the transfection of the indicated constructs. n = 3 per group. (F) Western blot analysis and quantification of total and active YAP levels in VSMCs with OTUB2 depletion. n = 3 per group. (G) Western blot analysis and quantification of total and active YAP levels in VSMCs with OTUB2 inhibition by OTUB2-IN-1. n = 3 per group. (H) Western blot analysis and quantification of YAP and LATS1 levels in VSMCs. n = 3 per group. (I) RT-qPCR analysis of YAP target gene expression under OTUB2 depletion conditions. n = 3 per group. (J) RT-qPCR analysis of YAP target gene expression under OTUB2-overexpressing conditions. n = 3 per group. (K) Immunofluorescence staining revealed that OTUB2 silencing and inhibition suppressed YAP nuclear translocation. Scale bars, 50 μm. (L-M) Nucleocytoplasmic separation assays revealed that OTUB2 depletion and inhibition inhibited the nuclear translocation of YAP. n = 3 per group. (N) Immunohistochemical staining for YAP in aortic sections from the indicated groups. Scale bars, 200 μm (upper panels) and 50 μm (lower panels). n = 6 per group. Statistical significance was assessed using two-tailed t-test (C, E, F, G, I, J, L and M) and one-way ANOVA followed by Dunnett's test (H). All values are presented as mean ± SD. *P < 0.05, **P < 0.01, ***P < 0.001, and ****P < 0.0001.
Figure 4
Figure 4
Knockdown or inhibition of YAP partially suppresses VC promoted by OTUB2 overexpression. (A) Western blot analysis of OTUB2, RUNX2, BMP2 and α-SMA expression in aortas. n = 6 per group. (B) Representative images of Von Kossa staining, Alizarin red staining, and immunohistochemical staining for RUNX2 and BMP2 in aortas from the indicated experimental cohorts. Scale bars, 200 μm. (C) Representative images of immunofluorescence staining for RUNX2 and α-SMA in aortas from the different experimental groups. Scale bars, 200 μm (left panels), 100 μm (right panels). (D-E) Representative images of Alizarin red staining of whole aortas from the different experimental groups. Scale bars, 5 mm. (F) Representative images of immunofluorescence staining for RUNX2 and α-SMA in aortas from the different experimental groups. Scale bars, 200 μm (left panels), 100 μm (right panels). (G) Western blot analysis of OTUB2, RUNX2, BMP2 and α-SMA expression in aortas. n = 6 per group. (H) Representative images of Von Kossa staining, Alizarin red staining, and immunohistochemical staining for RUNX2 and BMP2 in aortas from the indicated experimental cohorts. Scale bars, 200 μm. (I) Western blot analysis of OTUB2, RUNX2, BMP2, and α-SMA expression in VSMCs. n = 3 per group. (J) Representative images of Alizarin red and Von Kossa staining of VSMCs after the transfection of the indicated constructs and CM exposure for another 7 days. Scale bars, 5 mm (upper panels), 100 μm (lower panels). (K) Western blot analysis of OTUB2, RUNX2, BMP2, and α-SMA expression in VSMCs. n = 3 per group. (L) Representative images of Alizarin red and Von Kossa staining of VSMCs after the transfection of the indicated constructs and CM exposure for another 7 days. Scale bars, 5 mm (upper panels), 100 μm (lower panels). Statistical significance was assessed using one-way ANOVA followed by Dunnett's test (A, G, I, K). All values are presented as mean ± SD. *P < 0.05, **P < 0.01, ***P < 0.001, and ****P < 0.0001.
Figure 5
Figure 5
OTUB2 interacts with and stabilizes YAP. (A) Molecular docking assays of OTUB2 and YAP. (B) VSMC lysates were immunoprecipitated with an anti-YAP antibody, and HEK293T cells transfected with Flag-tagged OTUB2 and HA-tagged YAP were subjected to Co-IP assays. (C) Immunofluorescence staining were performed using antibodies against OTUB2 (red) and YAP (green). DAPI (blue). Scale bars, 50 μm. (D) SUMOylation levels of OTUB2 in VSMCs treated with GM or CM. (E-F) Western blot analysis and quantification of YAP expression. n = 3 per group. (G) Control or OTUB2-silenced VSMCs were treated with cycloheximide (CHX) and subjected to Western blot. (H) Control or OTUB2-overexpressing VSMCs were treated with CHX and subjected to Western blot. (I) An empty vector and Flag-OTUB2 C51S were transfected into VSMCs, which were then treated with CHX, and a quantitative analysis of the half-life of the YAP protein was performed. (J) Schematic diagram showing the wild-type and truncated YAP and OTUB2 constructs. (K) Representative immunoblots showing the interaction between OTUB2 and WT or truncated YAP, as indicated, as assessed by IP. (L) Representative immunoblots showing the interaction between YAP and WT or truncated OTUB2, as indicated, as assessed by IP. (M) K48-linked ubiquitination of YAP was measured by immunoblotting after OTUB2 was silenced. (N) K48-linked ubiquitination of YAP was measured by immunoblotting after OTUB2 was overexpressed. (O) K63-linked ubiquitination of YAP was measured by immunoblotting. (P) An empty vector, Flag-OTUB2 and Flag-OTUB2 C51S mutants were transfected into VSMCs. The K48-linked ubiquitination of YAP was measured by immunoblotting. Statistical significance was assessed using one-way ANOVA followed by Dunnett's test (E, F). All values are presented as mean ± SD. *P < 0.05.
Figure 6
Figure 6
OTUB2 facilitates PFKFB3 transcription through YAP. (A) Representative immunohistochemical staining for PFKFB3 of radial arteries from CKD patients. Scale bars, 50 μm. n = 8 per group. (B) Scatter dot plot of the correlation between PFKFB3, OTUB2 and YAP expression in radial arteries from CKD patients. n = 16. (C) Co-IP assays were performed to verify the interaction between YAP and TEAD1 in VSMCs. (D) Binding motif of TEAD1. (E) Predicted binding sites of TEAD1 in the promoter of PFKFB3. (F) CUT&RUN-qPCR assays were performed to confirm the relative enrichment of genes in VSMCs with the IgG and YAP antibodies. n = 4 per group. (G-H) Western blot analysis and quantification of PFKFB3 protein expression in VSMCs after the indicated treatments. n = 4 per group. (I) Immunohistochemical staining for PFKFB3 in aortic sections from the indicated groups. Scale bars, 200 μm (upper panels), 50 μm (lower panels). n = 6 per group. (J) Glycolysis rate assays were conducted using VSMCs subjected to different treatments with a Seahorse analyzer. n = 4 per group. (K) The lactate content was detected after different treatments. n = 3 per group. (L) Glycolysis rate assays were conducted using VSMCs subjected to different treatments with a Seahorse analyzer. n = 4 per group. (M) The lactate content was detected after different treatments. n = 3 per group. (N) Western blot analysis and quantification of RUNX2, BMP2, and α-SMA protein expression in VSMCs after oxamic acid treatment. n = 3 per group. (O) Representative images of Alizarin red and Von Kossa staining of VSMCs after the indicated treatments and CM exposure for another 7 days. Scale bars, 5 mm (upper panels), 100 μm (lower panels). Statistical significance was assessed using t-test (A, F) and one-way ANOVA followed by Dunnett's test (G, H, I, J, K, L, M, N). All values are presented as mean ± SD. *P < 0.05, **P < 0.01, ***P < 0.001, and ****P < 0.0001.
Figure 7
Figure 7
OTUB2 exerts procalcific effects through PFKFB3 upregulation. (A) Western blot analysis and quantification of RUNX2, BMP2, and α-SMA protein expression. n = 3 per group. (B) Representative images of Alizarin red and Von Kossa staining images. Scale bars, 5 mm (upper panels), 100 μm (lower panels). (C) Western blot analysis and quantification of RUNX2, BMP2, and α-SMA protein expression. n = 3 per group. (D) Representative images of Alizarin red and Von Kossa staining images. Scale bars, 5 mm (upper panels), 100 μm (lower panels). (E) Western blot analysis and quantification of RUNX2, BMP2, and α-SMA protein expression. n = 3 per group. (F) Representative images of Alizarin red and Von Kossa staining images. Scale bars, 5 mm (upper panels), 100 μm (lower panels). (G) Western blot analysis and quantification of RUNX2, BMP2, and α-SMA protein expression. n = 3 per group. (H) Representative images of Alizarin red and Von Kossa staining images. Scale bars, 5 mm (upper panels), 100 μm (lower panels). (I) Experimental protocols used in (J) through (M). (J) Western blot analysis and quantification of RUNX2, BMP2 and α-SMA expression in aortas. n = 6 per group. (K) Representative images of Alizarin red staining of whole aortas. Scale bars, 5 mm. (L) Representative images of Von Kossa staining, Alizarin red staining, and immunohistochemical staining for RUNX2 and BMP2 in aortas from the indicated experimental cohorts. Scale bars, 200 μm. (M) Representative images of immunofluorescence staining for RUNX2 and α-SMA in aortas. Scale bars, 200 μm (left panels), 100 μm (right panels). Statistical significance was assessed using one-way ANOVA followed by Dunnett's test (A, C, E, G, J). All values are presented as mean ± SD. *P < 0.05, **P < 0.01, ***P < 0.001, and ****P < 0.0001.

References

    1. Onnis C, Virmani R, Kawai K, Nardi V, Lerman A, Cademartiri F. et al. Coronary artery calcification: current concepts and clinical implications. Circulation. 2024;149(3):251–266. - PMC - PubMed
    1. Dong QQ, Tu YC, Gao P, Liao QQ, Zhou P, Zhang H. et al. SGK3 promotes vascular calcification via Pit-1 in chronic kidney disease. Theranostics. 2024;14(2):861–878. - PMC - PubMed
    1. Zhang H, Li G, Yu X, Yang J, Jiang A, Cheng H. et al. Progression of vascular calcification and clinical outcomes in patients receiving maintenance dialysis. JAMA Netw Open. 2023;6(5):e2310909. - PMC - PubMed
    1. Li X, Liu A, Xie C, Chen Y, Zeng K, Xie C. et al. The transcription factor GATA6 accelerates vascular smooth muscle cell senescence-related arterial calcification by counteracting the role of anti-aging factor SIRT6 and impeding DNA damage repair. Kidney Int. 2024;105(1):115–131. - PubMed
    1. Sutton NR, Malhotra R, St Hilaire C, Aikawa E, Blumenthal RS, Gackenbach G. et al. Molecular mechanisms of vascular health: insights from vascular aging and calcification. Arterioscler Thromb Vasc Biol. 2023;43(1):15–29. - PMC - PubMed

Publication types

MeSH terms