. 2025 Jan 1;15(3):784-803.
doi: 10.7150/thno.101498. eCollection 2025.

Advancing the clinical assessment of glomerular podocyte pathology in kidney biopsies via super-resolution microscopy and angiopoietin-like 4 staining

Affiliations

Advancing the clinical assessment of glomerular podocyte pathology in kidney biopsies via super-resolution microscopy and angiopoietin-like 4 staining

Xiaojing Liu et al. Theranostics. .

Abstract

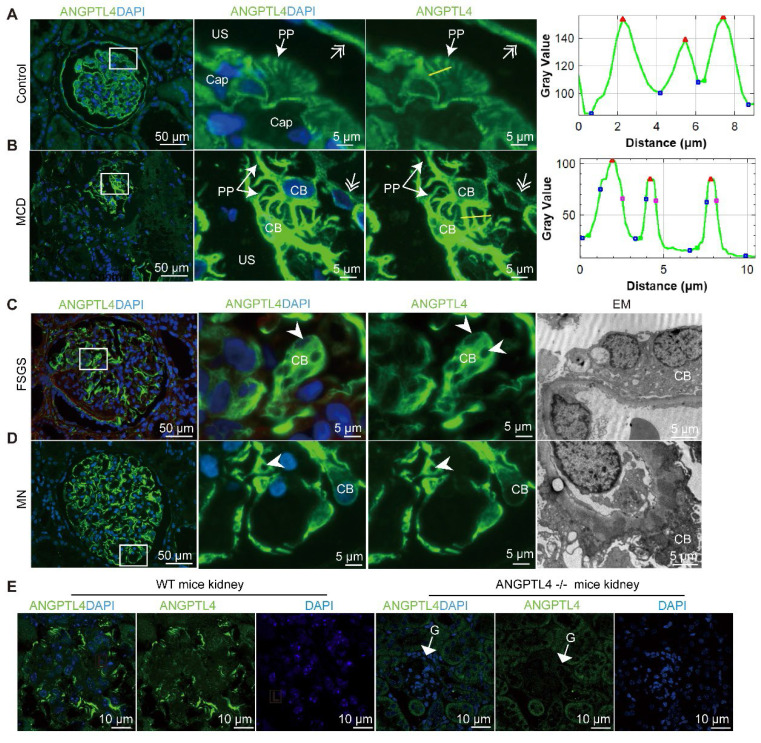
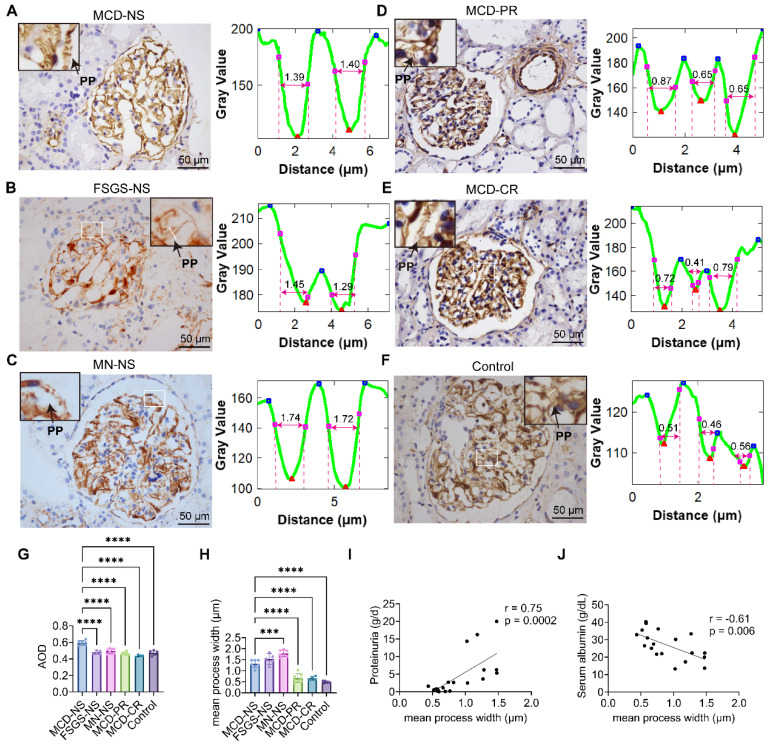
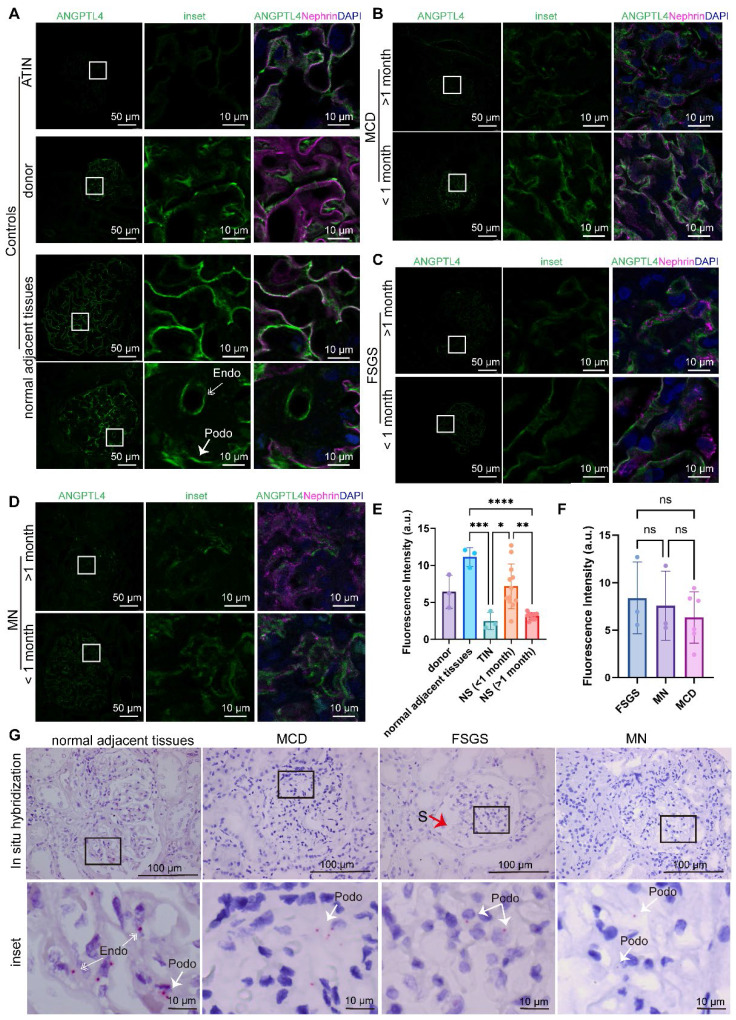
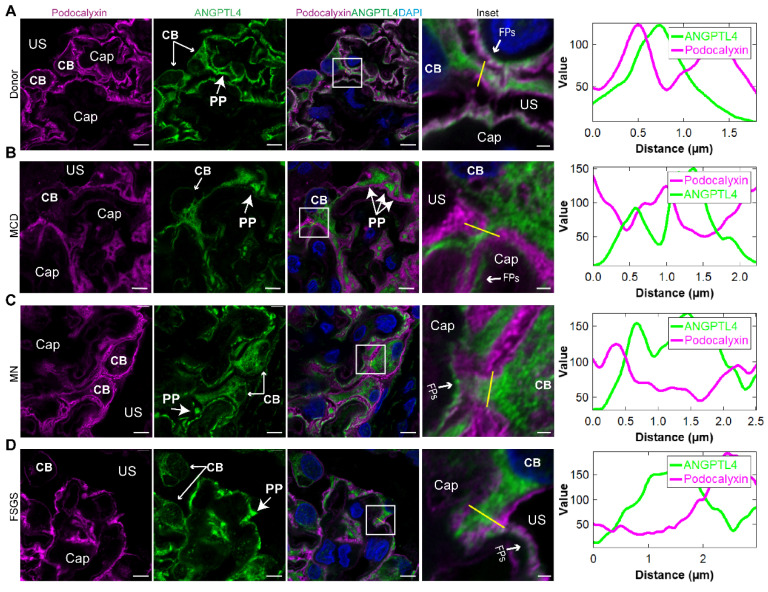
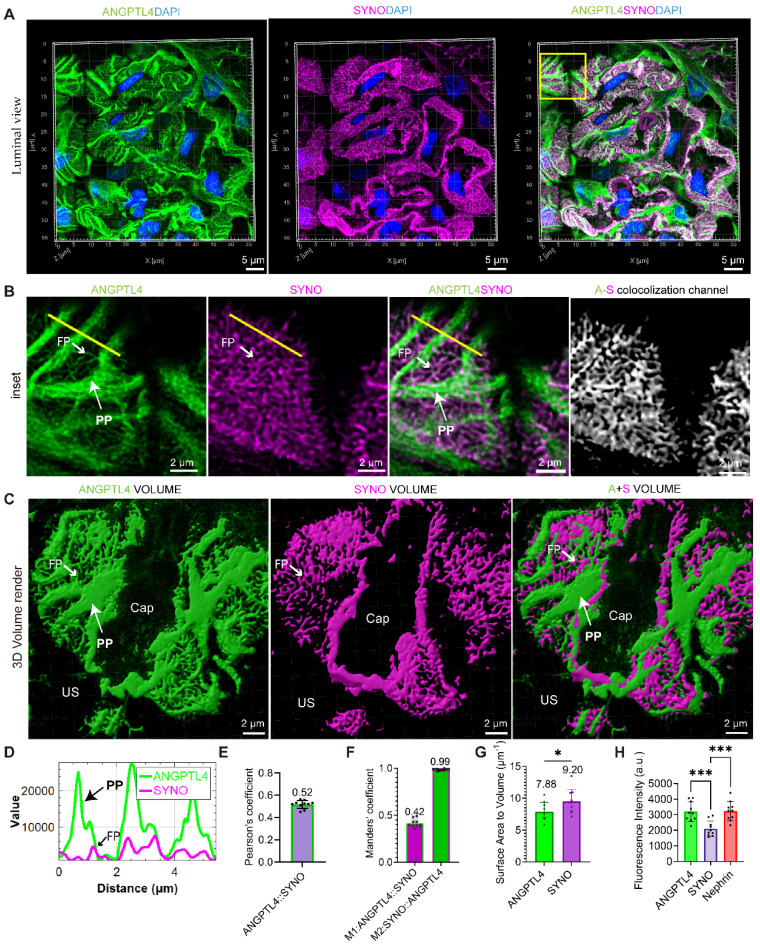
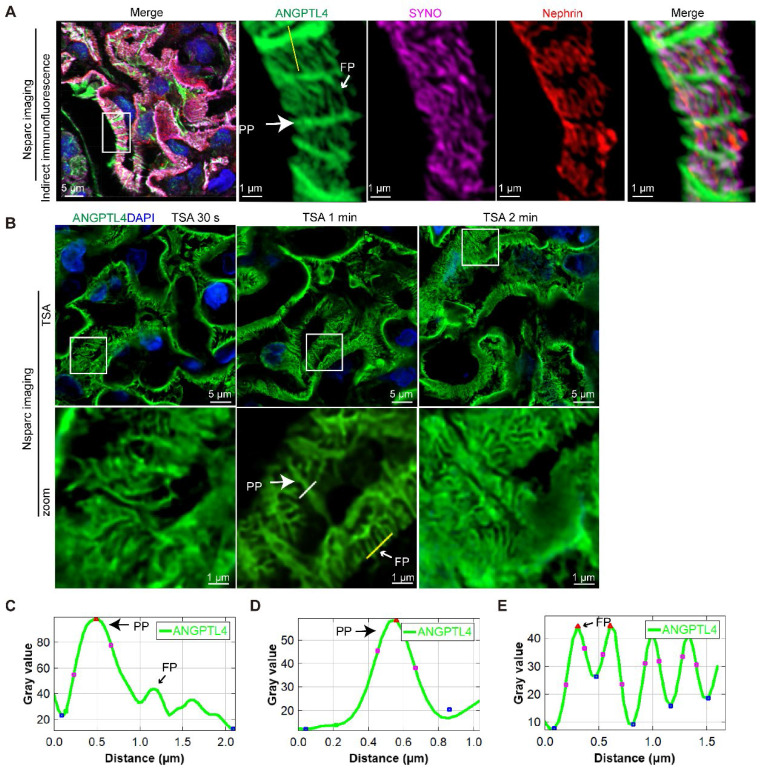
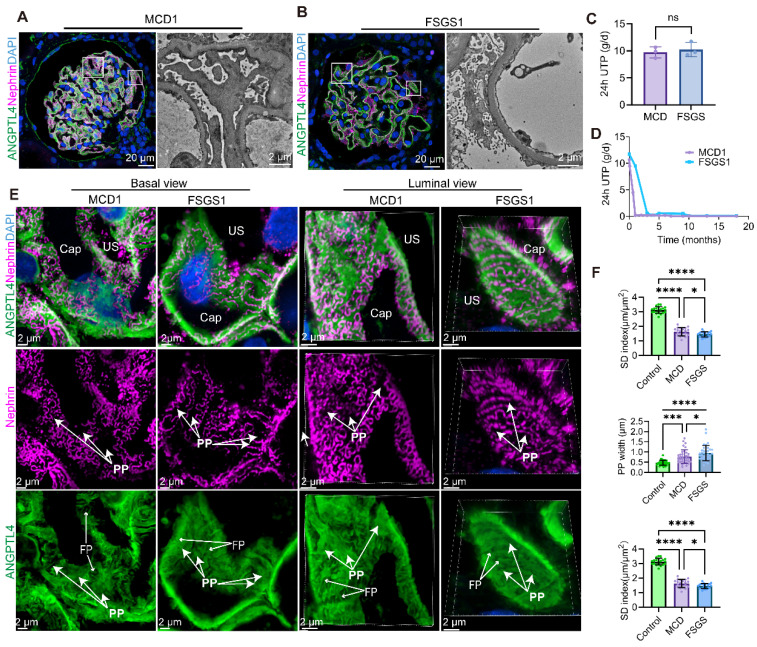
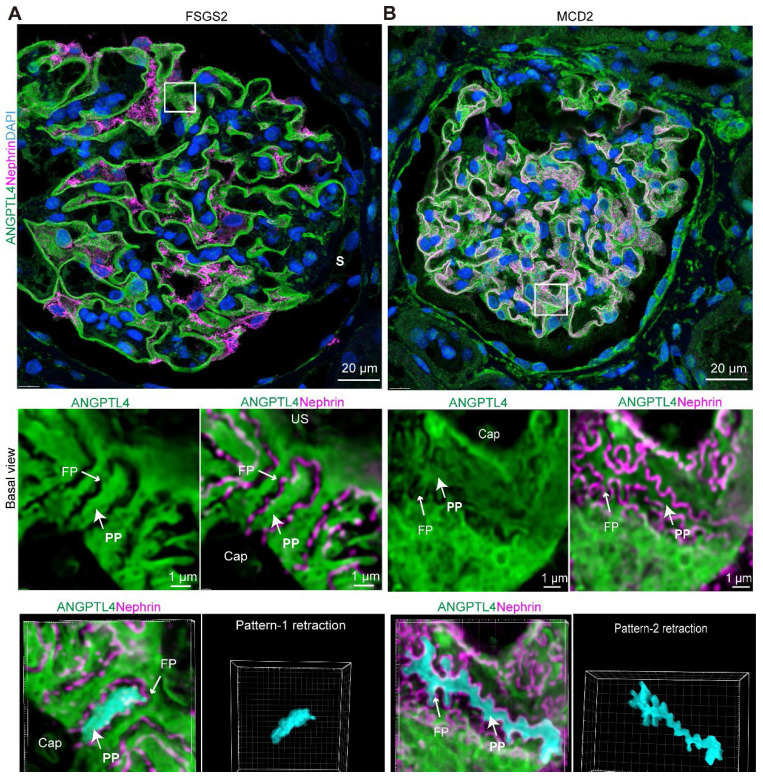
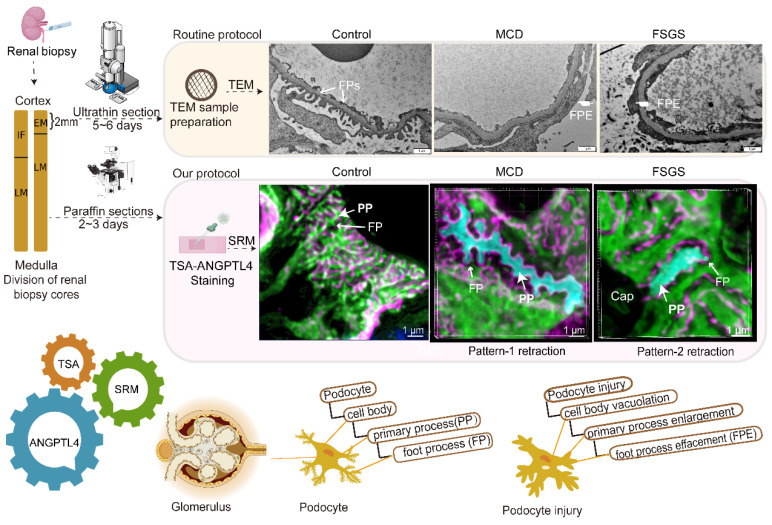
Rationale: The tertiary structure of normal podocytes prevents protein from leaking into the urine. However, observing the complexity of podocytes is challenging because of the scale differences in their three-dimensional structure and the close proximity between neighboring cells in space. In this study, we explored podocyte-secreted angiopoietin-like 4 (ANGPTL4) as a potential morphological marker via super-resolution microscopy (SRM). Methods and Results: Specimens from patients with minimal change disease (MCD), focal segmental glomerulosclerosis (FSGS), and membranous nephropathy (MN), along with normal controls, were analyzed via immunofluorescence and immunohistochemistry to determine the expression and localization of ANGPTL4, confirming its extensive presence in podocytes across both healthy and diseased conditions. Immunoelectron microscopy revealed that ANGPTL4 is distributed throughout the podocyte cell body, primary processes, and foot processes. Compared with conventional podocyte markers such as nephrin and synaptopodin, ANGPTL4 excels in depicting the three-dimensional structure of podocytes via SRM imaging. We then refined a protocol using tyramide signal amplification staining and confocal microscopy to uniformly enhance podocyte fluorescence, facilitating the clinical assessment of biopsies. In patients diagnosed with MCD and FSGS, measurements of slit diaphragm density, primary process width, and foot process width were taken after further co-staining with nephrin to identify patterns of podocyte morphological alterations. Distinctive patterns of foot process effacement were identified in MCD and FSGS patients, with FSGS patients showing more pronounced podocyte injury. Conclusions: ANGPTL4 serves as a reliable morphological marker for podocyte analysis, offering enhanced visualization of their three-dimensional structure and facilitating the identification of distinct pathological changes in nephrotic syndrome patients.

Keywords: 3D imaging; angiopoietin-like 4; podocytes; renal biopsy; super-resolution confocal microscopy.


Conflict of interest statement

Competing Interests: The authors have declared that no competing interest exists.

Figures

Figure 1
Figure 1
ANGPTL4 immunostaining allows visualization of the podocyte cell body (CB) and primary processes (PPs) via conventional fluorescence microscopy (FM). (A-B) The FM results illustrated the robust expression of ANGPTL4 within a peritumoral kidney tissue sample and in a patient with minimal change disease. (A) ANGPTL4 staining distinctly accentuates the orderly disposition of PPs and parietal epithelial cells (indicated by a double arrow). The zoomed-in images in (B) offer an en face view, where ANGPTL4 signals illustrate the juxtaposed podocyte CB and its characteristic intertwining branches. On the right-hand side of the figure, fluorescence intensity profiles are presented along two designated yellow lines, providing a quantitative understanding of the distribution of ANGPTL4 signals. Notably, the peaks within the profile corresponded to the primary processes of the podocytes. (C) Podocytes from a patient with focal segmental glomerulosclerosis (FSGS) display a notably enlarged and vacuolated CB (arrowhead). (D) Podocytes from a patient with membranous nephropathy (MN) demonstrated a loss of PPs and adhered to the capillary wall. The arrowhead points to the vacuolation of the podocytes. Scale bars = 50 μm and 5 μm (zoomed images). Representative EM images are shown in the right panel (scale bar, 5 µm). (E) Images of kidney sections stained with ANGPTL4 from control mice (left panel) versus ANGPTL4 knockout mice (right panel). The glomeruli (G) of wild-type (WT) mice presented positive ANGPTL4 staining in podocytes, whereas podocyte staining was negative in knockout mice. Scale bars = 10 μm. Abbreviations: CAP, capillary lumen; US, urinary space.
Figure 2
Figure 2
Quantitative analysis of immunohistochemical staining and process width measurements via ANGPTL4 immunohistochemical images. (A-F) The left panel displays ANGPTL4 immunohistochemical images with the measured area outlined (enlarged images are shown in the upper corners), and the right panel shows profile measurements of the protrusions on the capillary walls outlined from the left PANEL. The protrusion width is determined by fitting the plot profile curve via the Fiji plugin Spikey to obtain the full width at half maximum of the valley. Scale bars = 50 μm. (G) The protein expression of ANGPTL4 in the glomeruli was quantified by the average optical density (AOD), which was calculated by averaging over at least three glomeruli per sample. (H) The average process width of podocytes in each group, measured over at least ten vascular loops at three glomeruli per sample. The data are presented as the means ± standard deviations. Statistical significance was analyzed via one-way ANOVA. ***P < 0.001, ****P < 0.0001. (I-J) Spearman correlation analysis of the relationships between the mean process width and proteinuria, as well as between the mean process width and the level of albumin, in 19 MCD patients revealed positive and negative correlations. The Spearman correlation coefficient and the exact p value are provided. Abbreviations: CR, complete remission; NS, nephrotic syndrome; PR, partial remission; FSGS, focal segmental glomerulosclerosis; PP, primary process; MCD, minimal change disease; MN, membranous nephropathy.
Figure 3
Figure 3
Comparative quantitative analysis of ANGPTL4 immunofluorescence and in situ hybridization in patients with nephrotic syndrome biopsied at different times after relapse. (A-D) All images were captured via a 40x objective lens on a Leica STELLARIS 8. The left panel used the same acquisition parameters (smart gain set to 2.5, smart intensity to 1.26, determined on the basis of the glomerulus from tissue adjacent to the tumor not being overexposed). The middle panel shows enlarged details of the selected images from the left panel with the same parameters. The right panel shows merged images of ANGPTL4 with DyLight 488 (green), nephrin with Cy3, and DAPI (blue) to illustrate the location of ANGPTL4 expression (exposure parameters were adjusted according to different samples). Scale bars = 50 μm for the main images and 10 μm for the enlarged images. (E) Quantitative results of glomerular immunofluorescence analysis across different groups, calculated by averaging over at least three glomeruli per sample. The data are presented as the means ± standard deviations. Statistical significance was analyzed via one-way ANOVA. *P < 0.05, **P < 0.01, ***P < 0.001, ****P < 0.0001. (F) There was no statistically significant difference in the mean ANGPTL4 fluorescence intensity among the MCD, FSGS, and MN groups who underwent biopsy less than one month after relapse. (G) Results of ANGPTL4 in situ hybridization in biopsy samples taken within one month after relapse via monochromatic chemical red staining. The arrows indicate positive areas. Scale bars = 100 μm for the main images and 10 μm for the enlarged images. Abbreviations: FSGS, focal segmental glomerulosclerosis; MCD, minimal change disease; MN, membranous nephropathy; TIN, tubulointerstitial nephritis; Endo, endothelial cell; Podo, podocyte.
Figure 4
Figure 4
Super-resolution images of immunofluorescence costaining for ANGPTL4 and podocalyxin from nephrotic syndrome patients and donor controls. (A-D) All the images were captured and processed via an Airyscan system with a 100×/1.4 numerical aperture oil immersion objective lens. Three-micron-thick sections of donor kidney tissue (A), MCD patient (B), MN patient (C), and FSGS patient (D) were immunostained for ANGPTL4 with DyLight 488 (green) and podocalyxin with Alexa Fluor 647 (magenta) and counterstained with DAPI (blue). Scale bars = 5 μm, with insets at 1 μm. The far right panel shows the plot profile of the outlined area in the detailed enlargement on the left. Abbreviations: FSGS, focal segmental glomerulosclerosis; MCD, minimal change disease; MN, membranous nephropathy; CAP, capillary lumen; US, urinary space; CB, cell body; PP, primary process; FP, foot process.
Figure 5
Figure 5
3D visualization of ANGPTL4 expression in podocytes derived from a donor kidney using a Leica STELLARIS 8 confocal microscope. All images were captured and processed via a STELLARIS 8 FALCON system equipped with a 100×/1.4 numerical aperture oil immersion objective lens (pinhole set at 0.7 Airy Units). Three-micron-thick sections of donor kidney tissue were immunostained for ANGPTL4 with DyLight 488 (green) and synaptopodin (SYNO) with Alexa Fluor 647 (magenta) and counterstained with DAPI (blue). (A) The top row displays images showing ANGPTL4 staining, SYNO staining, and merged images. Scale bars = 5 μm. The mean Pearson's correlation coefficient for ANGPTL4 and SYNO is depicted in (E), with the M1 and M2 values presented in (F). (B) The middle panel presents enlarged views of the area within the square, with the rightmost image representing a new channel generated from the colocalization signals and the colocalization channel. Scale bars = 2 μm. (D) The fluorescence intensity profile along the yellow line reveals significant signal peaks for ANGPTL4 in both the primary and foot processes, whereas SYNO exhibits a peak solely in the foot processes. (C) The bottom row features 3D volume renderings achieved through Imaris software, depicting ANGPTL4 and SYNO volumes, respectively, indicating the overall podocyte volume and foot process volume. Scale bars = 2 μm. The podocyte and foot process surface area‒to‒volume ratios, determined from ANGPTL4 signal intensities and SYNO, are presented in (G). (H) Immunofluorescence intensity analysis of the proteins ANGPTL4, SYNO, and nephrin. The data are presented as the means ± standard deviations. Statistical significance was analyzed via one-way ANOVA. *P < 0.05, ***P < 0.001. These data are derived from individual measurements taken from at least three separate glomeruli originating from two control samples. Abbreviations: CAP, capillary lumen; US, urinary space; CB, cell body; PP, primary process; FP, foot process.
Figure 6
Figure 6
Arrayed confocal microscopy observations of normal control kidney tissue samples immunostained for ANGPTL4 via indirect immunofluorescence versus tyramide signal amplification (TSA) techniques for comparative imaging. All images were obtained via an Nsparc confocal microscope with an oil immersion objective at ×100 magnification and an NA of 1.49. (A) Indirect immunofluorescence staining of control tissues, where sections were immunostained for ANGPTL4 using DyLight 488 (green), synaptopodin (SYNO) with Alexa Fluor 647 (magenta), and nephrin with CY3 (red) and counterstained with DAPI (blue). The accompanying enlarged details illustrate that, viewed from the luminal aspect, ANGPTL4 can be discerned within the primary podocyte processes and colocalized with SYNO in the foot processes, all of which are enveloped by the meandering pattern of nephrin staining. (B) Representative comparative images of control renal tissues stained with a distinct dye (DendronFluor®NEON570) and incubated for 30 s, 1 min, or 2 min. The results indicate that an incubation time of 1 min resulted in a favorable signal‒to‒noise ratio and relatively uniform signal peak intensity between the primary processes and foot processes. (C) and (D), (E) show the fluorescence intensity along the yellow line in A and B, respectively. C shows that the ANGPTL4 signal at foot processes is one-third of the primary process peak intensity. The foot process signals (C) are nearly equivalent in intensity to those of the primary processes (D). Scale bars = 5 μm and 1 μm (zoomed images). Abbreviations: PP, primary process; FP, foot process.
Figure 7
Figure 7
Comparative analysis of super-resolution confocal imaging in minimal change disease (MCD) and focal segmental glomerulosclerosis (FSGS) samples costained for ANGPTL4 via tyramide signal amplification (TSA) techniques and nephrin. Images were captured via an Nsparc confocal microscope with a ×100 oil immersion objective and an NA of 1.49. ANGPTL4 was immunostained in tissue sections with DendronFluor®NEON570 (green), stained with CY3-labeled nephrin (magenta), and counterstained with DAPI (blue). Super-resolution confocal microscopy and corresponding electron microscopy (EM) images of glomeruli from MCD (A) and FSGS (B) patients; in FSGS patients, nonsclerotic glomeruli are shown. Scale bars = 20 μm and 2 μm (EM). (C) Three MCD and three FSGS patients all had severe proteinuria (> 8 g/d) without intergroup differences in 24-h protein excretion. Both exhibited good responses to corticosteroid treatment (D). (E) MCD and FSGS glomeruli were compared via basal view maximum intensity projections and 3D luminal views. (F) Bar charts showing the SD density, primary process width (PP), and foot process width (FP) for controls (n = 2), MCD patients (n = 3), and FSGS patients (n = 3). At least two glomeruli per patient were measured, with ≥10 positions assessed in each glomerulus, excluding sclerotic regions, in FSGS patients. n.s., not significant, ***Significant difference (P < 0.001) between the 2 groups according to Student t test or one-way ANOVA when three groups were compared. Scale bars = 2 μm. Abbreviations: CAP, capillary lumen; US, urinary space; PP, primary process; FP, foot process.
Figure 8
Figure 8
Distinct podocyte foot process effacement in minimal change disease (MCD) and focal segmental glomerulosclerosis (FSGS) patients. Imaging was performed via a super-resolution Nsparc confocal microscope (×100 oil objective, NA 1.49). Sections were stained for ANGPTL4 (green, DendronFluor®NEON570), nephrin (magenta, CY3), and nuclei (blue, DAPI). (A) In FSGS patients, podocyte primary processes exhibit nearly complete loss of foot processes, resulting in uniform swelling and widening, with podocytes adopting a simplified appearance characterized by linearized SD patterns, which we term "Pattern-1 retraction". In contrast, in the MCD group (B), although the foot processes were bluntly thickened and widened, they remained discernible. The region of lateral podocyte processes (RLPs) shows increased width but maintains a similar three-dimensional structure, presenting relatively tortuous SD patterns, which we classify as "Pattern-2 retraction". Scale bars = 20 μm and 1 μm (zoomed images). Abbreviations: S, sclerosis; CAP, capillary lumen; US, urinary space; CB, cell body; PP, primary process; FP, foot process.
Figure 9
Figure 9
A comparative study between the super-resolution examination of renal biopsy samples following ANGPTL4 staining and the traditional electron microscopy (EM) findings. After renal biopsy, the tissue was divided, with a portion reserved for EM and the rest reserved for light microscopy (LM) and immunofluorescence (IF). Special handling is required for EM tissue, which allows for detailed examination of one or two glomeruli. A formalin-fixed paraffin-embedded (FFPE) section was subjected to ANGPTL4 staining via tyramine signal amplification (TSA) and imaged via super-resolution microscopy (SRM). SRM provides nanoscale insights into podocyte abnormalities, aiding in the detection of cellular vacuolization, thickening and swelling of primary processes, and foot process effacement. This approach transitions the assessment of podocyte injury from a 2D EM view to a 3D volumetric analysis, enhancing the accuracy of pathological diagnosis. Our method offers a potentially complementary or alternative strategy for the thorough evaluation of podocyte lesions in renal biopsy samples. This image was created with the help of the Fig-draw website, ID: RSUPS4444d.

Similar articles

Cited by

References

    1. Brinkkoetter PT, Ising C, Benzing T. The role of the podocyte in albumin filtration. Nat Rev Nephrol. 2013;9:328–36. - PubMed
    1. Florian Grahammer CS, Tobias B Huber. The podocyte slit diaphragm-from a thin grey line to a complex signalling hub. Nat Rev Nephrol. 2013;9:587–98. - PubMed
    1. Nagata M. Podocyte injury and its consequences. Kidney Int. 2016;89:1221–30. - PubMed
    1. S O Bohman GJ, A B Bohlin, U Berg. Foot process fusion and glomerular filtration rate in minimal change nephrotic syndrome. Kidney Int. 1984;25:696–700. - PubMed
    1. Benzing T, Salant D. Insights into glomerular filtration and albuminuria. New Engl J Med. 2021;384:1437–46. - PubMed

Publication types

MeSH terms

Substances

LinkOut - more resources